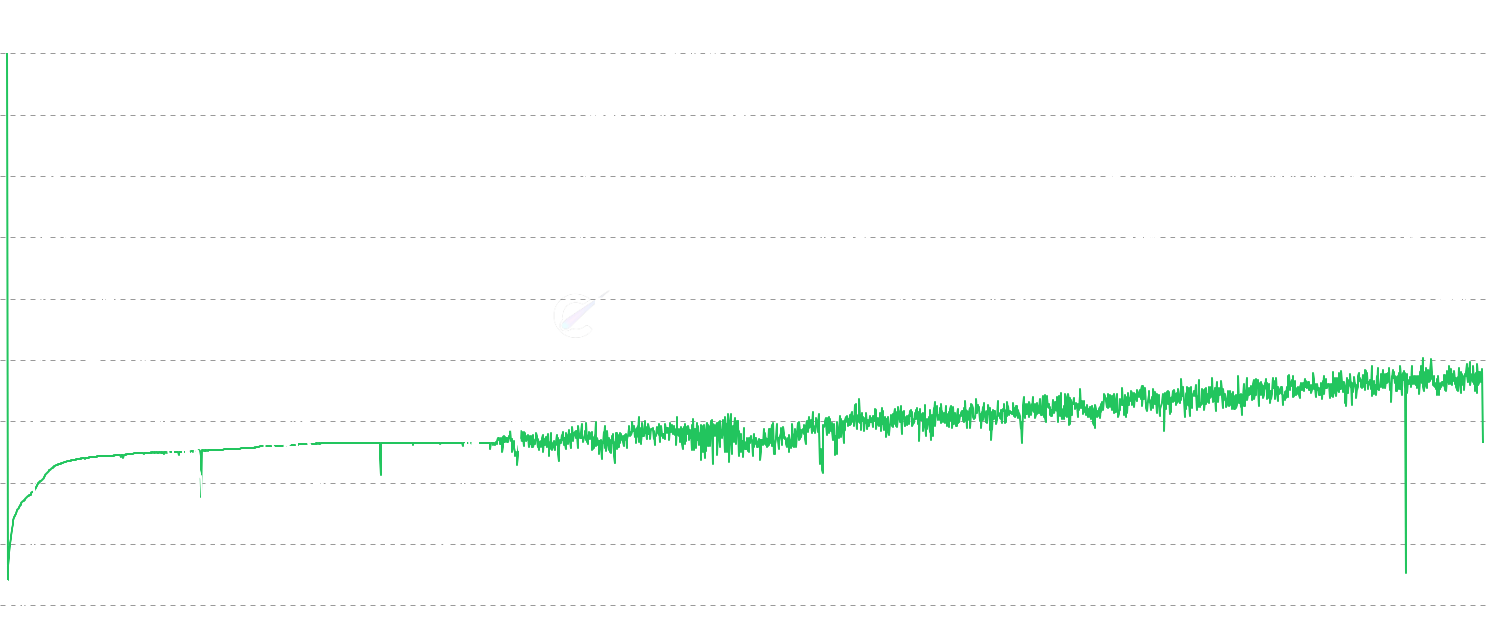
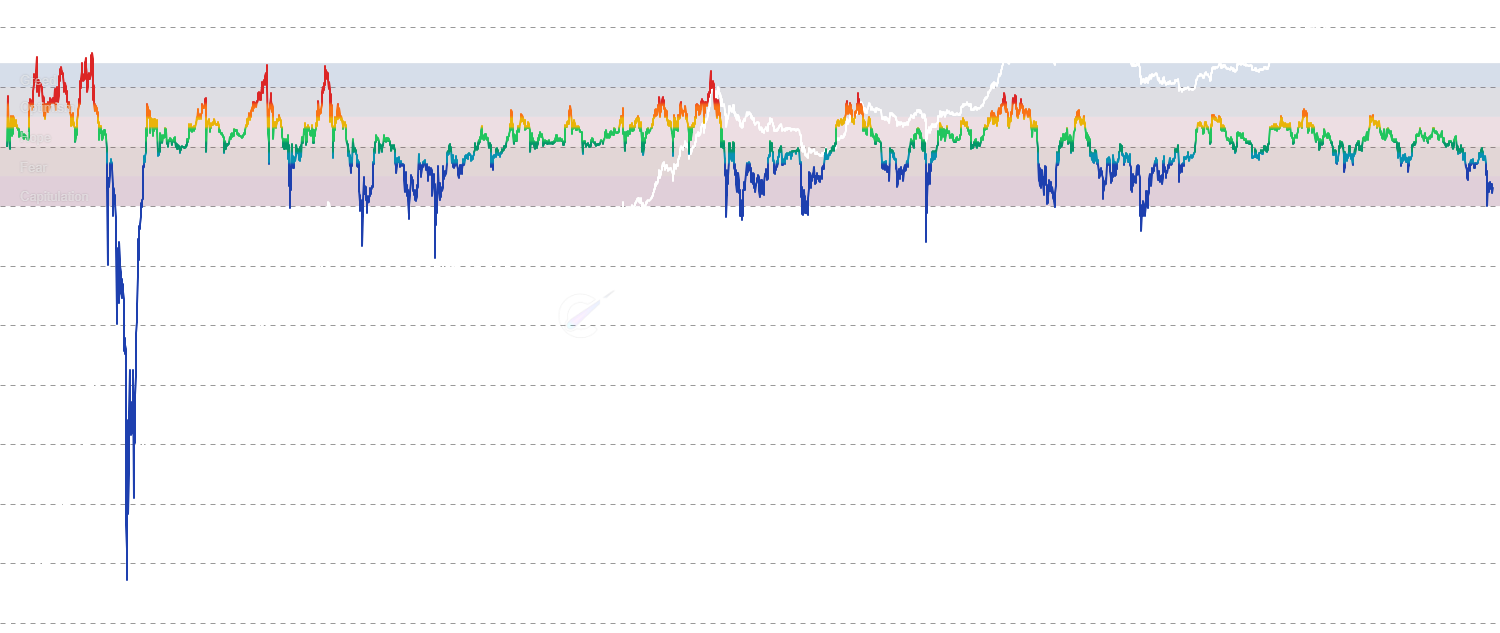
LINK Relative Realized P/L: Chainlink On-Chain Indicator
Chainlink on-chain: Track Relative Realized Profit and Loss (RRP/RRL) — normalized measures of daily profit-taking and loss-realization relative to the overall market. Unlike Net Realized P/L which shows net difference, this chart displays both RRP (profit intensity - green) and RRL (loss intensity - red) independently, revealing the relative magnitude of each. Watch for crossover points where RRL exceeds RRP - these often mark capitulation events and potential cycle bottoms where weak hands are flushed out. Conversely, when RRP dominates with sustained high values, it indicates profit-taking behavior typical of distribution phases near market tops. Normalization by market cap allows comparison across different market cycle stages regardless of absolute price levels.
What is LINK Relative Realized P/L?
LINK Relative Realized P/L is a Chainlink on-chain indicator categorized under Valuation Metrics. Chainlink on-chain: Track Relative Realized Profit and Loss (RRP/RRL) — normalized measures of daily profit-taking and loss-realization relative to the overall market. Unlike Net Realized P/L which shows net difference, this chart displays both RRP (profit intensity - green) and RRL (loss intensity - red) independently, revealing the relative magnitude of each. Watch for crossover points where RRL exceeds RRP - these often mark capitulation events and potential cycle bottoms where weak hands are flushed out. Conversely, when RRP dominates with sustained high values, it indicates profit-taking behavior typical of distribution phases near market tops. Normalization by market cap allows comparison across different market cycle stages regardless of absolute price levels.
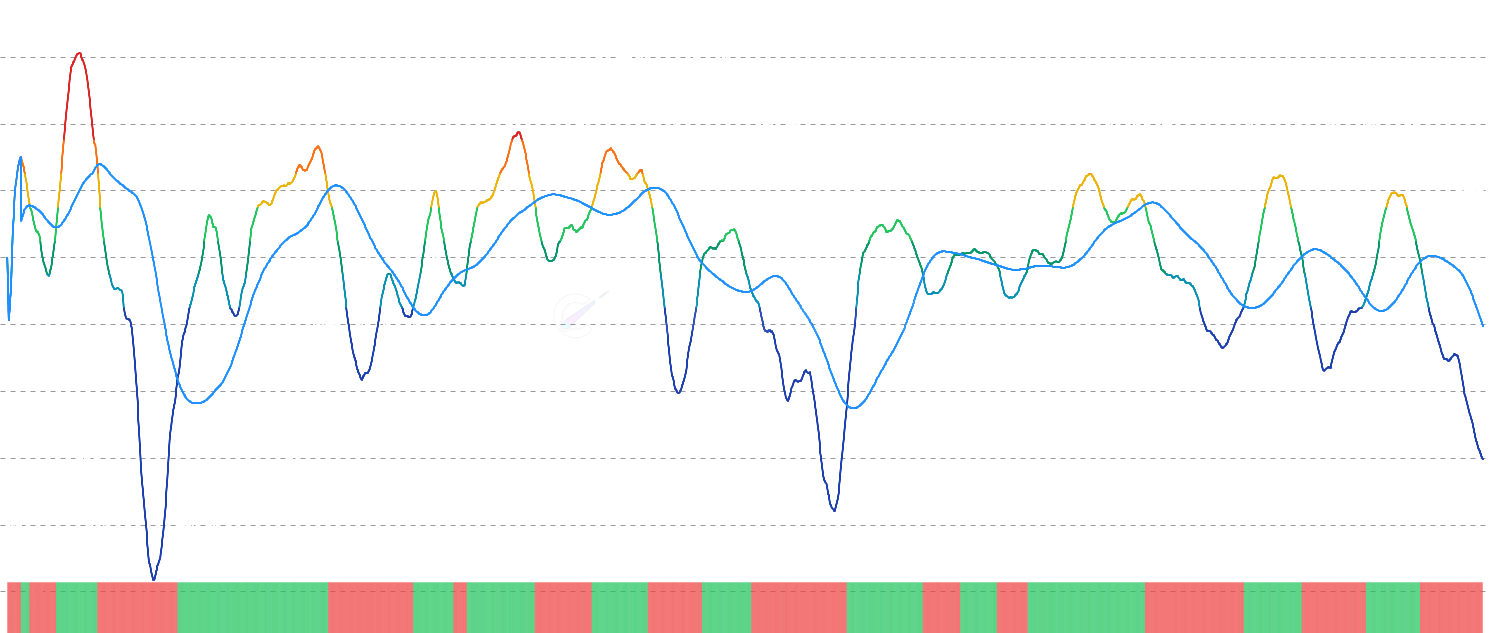
How to read LINK Relative Realized P/L
Use this chart to identify Chainlink on-chain regime shifts: zoom into specific cycles, compare the indicator against price, and watch for extreme readings that historically marked turning points. Toggle the timeframe selector for short-term tactical reads (30d, 90d, 1y) or full-history macro context.
Related On-Chain Metrics charts
- Realized Cap / Gold Ratio: Compares Bitcoin's Realized Cap (aggregate cost basis of all coins) to the gold price
- Composite Momentum: Combines multiple on-chain momentum indicators into composite metrics: Binary Consensus (% of indicators bullish) and Weighted Momentum Score
- Active MVRV Norm: Active MVRV adjusted for network activity using Cointime Economics principles, then normalized over a multi-cycle rolling window to produce a consistent 0-100% cycle indicator
- Crypto Risk Metrics: Monitor cryptocurrency market risk indicators and volatility
- Adaptive Risk Oscillator: Advanced risk metric using autocorrelation, variance decay, entropy, and fractal analysis to create a dynamic oscillator

Exhibits6
Cryptocurrency931
Alpha (Momentum/Deviation)PRO
Cryptocurrency Market BreadthPRO
Altcoin Season IndexPRO
Combined VWAP MVRV Z-ScorePRO
Advanced Decline IndexPRO
Fear & Greed Index
Price Horizons
ROI Analysis
Sharpe Ratio Analysis
RSI
Economic Indicators vs Crypto Correlation
Global M2 vs Crypto Correlation
GoldWave
Death Cross Analysis
Monthly Returns Table
Days Since Percentage Decline
Price Derivative
OG Whale Spending EventsPRO
Cumulative LTH Realized Profit [Bull Market]PRO
STH vs LTH Supply
Cohort Supply P/L
Hodler Net Position Change
LTH Wealth Concentration
LTH Wealth Concentration AttributionNEW
STH Wealth Concentration
STH % Supply in Profit
STH % Supply in Loss
LTH % Supply in Profit
LTH % Supply in Loss
Active Supply in Profit & Loss
Vaulted Supply in Profit & Loss
STH Net Position Change
LTH Net Position Change
Realized P&L By Age
Revived Supply By Age
Supply Last Active 1yr+ Net Position Change
Percent of Supply Last Active 1yr+NEW
Apparent Demand
LTH Maturation vs Distribution
Forward-Looking LTH Accumulation
NUPL by Cohort RiskPRO
Relative Unrealized P/LPRO
STH/LTH Profit-to-Volatility RatioPRO
STH/LTH CDDPRONEW
Relative Unrealized P/L by CohortPRONEW
Relative Unrealized P/L by AgePRONEW
Supply In Profit/Loss
NUPL
NUPL Z-Score
aSOPR
STH-NUPL
LTH-NUPL
AVIV-NUPL
SOPR
RHODL Ratio
STH/LTH Realized Price Ratio
Market Realized P/L Ratio
SLRV Ratio
Bull Market SOPR Loss Pressure
Cost Basis Heatmaps1
Unrealized P/L Heatmaps1
Address Count Heatmaps1
Market Cap by AgePRONEW
Balance Distribution (Shrimp to Whale)PRO
Balance Distribution Flows (Whale Accumulation)PRO
Accumulation IndexPRO
Whale vs Retail Delta HeatmapPRO
Accumulation WavesPRO
HODL Waves in Profit/LossPRONEW
Cost Basis QuantilesPRONEW
Realized Cap HODL Profit/LossPRONEW
Yearly Absorption RatePRONEW
HODL Waves
UTXO Realized Price Distribution
URPD by Age Cohort
Daily Issuance
Block Rewards
Circulating Supply
Cost Basis Heatmaps3
Unrealized P/L Heatmaps3
Realized P/L Heatmaps4
Address Count Heatmaps3
SOPD Heatmaps4
Cross-Chain AnalyticsPRO
Price vs MVRV Percentile Divergence MomentumPRO
Onchain Risk CompositePRO
Realized P/L by BandPRONEW
Cost Basis ConcentrationPRONEW
Implied On-Chain VolatilityPRONEW
CB Profit/Loss RatioPRONEW
CB Profit Take RatePRONEW
CB Supply ShiftPRONEW
Bitcoin Cycle Index (BCI)PRO
Cost Basis ConvergencePRO
Seller Exhaustion ConstantPRO
Cost Basis Distribution by Age CohortPRONEW
Median Cost Basis by Age CohortPRONEW
STH Median MVRVPRONEW
LTH Median MVRVPRONEW
STH:LTH Median Cost Basis RatioPRONEW
Seller Median Cost BasisPRONEW
LTH Adaptive MVRV Z-Score
Price vs MVRV Percentile Divergence
Sell Side Pressure
Realized P&L Sharpe Ratio
Realized P&L Acceleration
UTXO Entropy Cascade
ETH STH vs LTH SupplyPRO
ETH Hodler Net Position ChangePRO
ETH STH-SOPRPRO
ETH LTH-SOPRPRO
ETH SOPR by AgePRO
ETH OG Whale Spending EventsPRO
ETH SOPR Z-ScorePRO
ETH STH Cost BasisPRO
ETH STH Cost Basis ChangePRO
ETH LTH Wealth ConcentrationPRO
ETH Cumulative LTH Realized Profit [Bull Market]PRO
ETH STH Wealth ConcentrationPRO
ETH STH % Supply in ProfitPRO
ETH STH % Supply in LossPRO
ETH LTH % Supply in ProfitPRO
ETH LTH % Supply in LossPRO
ETH Active Supply in Profit & LossPRO
ETH Vaulted Supply in Profit & LossPRO
ETH STH Net Position ChangePRO
ETH LTH Net Position ChangePRO
ETH LTH Cost BasisPRO
ETH LTH Cost Basis ChangePRO
ETH STH MVRVPRO
ETH LTH MVRVPRO
ETH Holder Realized PricesPRO
ETH STH StressPRO
ETH LTH StressPRO
ETH STH MVRV Z-ScorePRO
ETH LTH MVRV Z-ScorePRO
ETH Realized P&L DeviationPRO
ETH SOPR by Cost Basis BandPRONEW
ETH Realized P&L By AgePRO
ETH Revived Supply By AgePRO
ETH Supply Last Active 1yr+ Net Position ChangePRO
ETH Percent of Supply Last Active 1yr+PRONEW
ETH LTH Realized P/L RatioPRO
ETH STH Realized P/L RatioPRO
ETH STH P/L Price FlowPRO
ETH LTH P/L Price FlowPRO
ETH Relative Long/Short-Term Holder Realized P/LPRO
ETH Active MVRV NormPRO
ETH CVDD BandsPRO
ETH MVRVPRO
ETH True Market Mean AVIVPRO
ETH Onchain Price LevelsPRO
ETH Realized P&LPRO
ETH Net Realized P&LPRO
ETH Relative Realized P/LPRO
ETH MVRV BandsPRO
ETH Reserve RiskPRO
ETH Reserve Risk AdjustedPRO
ETH MVRV Z-ScorePRO
ETH Median MVRVPRONEW
ETH Realized CapPRO
ETH Realized Cap DrawdownPRO
ETH Days Above/Below Realized PricePRO
ETH Sell-Side Risk RatioPRO
ETH Vaultedness - Active MVRV DivergencePRO
ETH Market Cap to Thermocap Ratio (MCTC)PRO
ETH AVIV Z-ScorePRO
ETH AVIV BandsPRO
ETH Active MVRV & Active Realized PricePRO
ETH Puell MultiplePRO
ETH Investorness & ProducernessPRO
ETH HODL WavesPRO
ETH Market Cap by AgePRONEW
ETH Balance Distribution (Shrimp to Whale)PRO
ETH Accumulation IndexPRO
ETH Whale vs Retail Delta HeatmapPRO
ETH Cost Basis HeatmapPRONEW
ETH HODL Waves in Profit/LossPRONEW
ETH Cost Basis QuantilesPRONEW
ETH Unrealized P/L HeatmapPRONEW
ETH Realized Cap HODL Profit/LossPRONEW
ETH Address Count HeatmapPRONEW
ETH Daily IssuancePRO
ETH Circulating SupplyPRO
ETH LTH Adaptive MVRV Z-ScorePRO
ETH Onchain Risk CompositePRO
ETH Sell Side PressurePRO
ETH Realized P/L by BandPRONEW
ETH Realized P/L HeatmapPRONEW
ETH Cost Basis ConcentrationPRONEW
ETH Implied On-Chain VolatilityPRONEW
ETH CB Profit/Loss RatioPRONEW
ETH CB Profit Take RatePRONEW
ETH CB Supply ShiftPRONEW
ETH Realized P&L Sharpe RatioPRO
ETH Cost Basis ConvergencePRO
ETH Realized P&L AccelerationPRO
ETH Seller Exhaustion ConstantPRO
ETH SOPD HeatmapPRONEW
ETH STH Cost Basis DistributionPRONEW
ETH LTH Cost Basis DistributionPRONEW
ETH STH Unrealized P/L HeatmapPRONEW
ETH LTH Unrealized P/L HeatmapPRONEW
ETH STH Address Count HeatmapPRONEW
ETH LTH Address Count HeatmapPRONEW
ETH STH SOPD HeatmapPRONEW
ETH LTH SOPD HeatmapPRONEW
ETH STH Realized P/L HeatmapPRONEW
ETH LTH Realized P/L HeatmapPRONEW
ETH Cost Basis Heatmap by Age CohortPRONEW
ETH Cost Basis Distribution by Age CohortPRONEW
ETH Unrealized P/L Heatmap by Age CohortPRONEW
ETH Address Count Heatmap by Age CohortPRONEW
ETH SOPD Heatmap by Age CohortPRONEW
ETH Realized P/L Heatmap by Age CohortPRONEW
ETH Median Cost Basis by Age CohortPRONEW
ETH STH Median MVRVPRONEW
ETH LTH Median MVRVPRONEW
ETH STH:LTH Median Cost Basis RatioPRONEW
ETH Seller Median Cost BasisPRONEW
DOGE STH vs LTH SupplyPRO
DOGE Hodler Net Position ChangePRO
DOGE STH-SOPRPRO
DOGE LTH-SOPRPRO
DOGE SOPR by AgePRO
DOGE SOPR Z-ScorePRO
DOGE STH Cost BasisPRO
DOGE STH Cost Basis ChangePRO
DOGE LTH Wealth ConcentrationPRO
DOGE STH Wealth ConcentrationPRO
DOGE STH % Supply in ProfitPRO
DOGE STH % Supply in LossPRO
DOGE LTH % Supply in ProfitPRO
DOGE LTH % Supply in LossPRO
DOGE Active Supply in Profit & LossPRO
DOGE Vaulted Supply in Profit & LossPRO
DOGE STH Net Position ChangePRO
DOGE LTH Net Position ChangePRO
DOGE LTH Cost BasisPRO
DOGE LTH Cost Basis ChangePRO
DOGE STH MVRVPRO
DOGE LTH MVRVPRO
DOGE Holder Realized PricesPRO
DOGE STH StressPRO
DOGE LTH StressPRO
DOGE STH MVRV Z-ScorePRO
DOGE LTH MVRV Z-ScorePRO
DOGE Realized P&L DeviationPRO
DOGE SOPR by Cost Basis BandPRONEW
DOGE Realized P&L By AgePRO
DOGE Revived Supply By AgePRO
DOGE Supply Last Active 1yr+ Net Position ChangePRO
DOGE Percent of Supply Last Active 1yr+PRONEW
DOGE LTH Realized P/L RatioPRO
DOGE STH Realized P/L RatioPRO
DOGE STH P/L Price FlowPRO
DOGE LTH P/L Price FlowPRO
DOGE Relative Long/Short-Term Holder Realized P/LPRO
DOGE Active MVRV NormPRO
DOGE CVDD BandsPRO
DOGE MVRVPRO
DOGE True Market Mean AVIVPRO
DOGE Onchain Price LevelsPRO
DOGE Realized P&LPRO
DOGE Net Realized P&LPRO
DOGE Relative Realized P/LPRO
DOGE MVRV BandsPRO
DOGE Reserve RiskPRO
DOGE Reserve Risk AdjustedPRO
DOGE MVRV Z-ScorePRO
DOGE Median MVRVPRONEW
DOGE Realized CapPRO
DOGE Realized Cap DrawdownPRO
DOGE Days Above/Below Realized PricePRO
DOGE Sell-Side Risk RatioPRO
DOGE Vaultedness - Active MVRV DivergencePRO
DOGE Market Cap to Thermocap Ratio (MCTC)PRO
DOGE AVIV Z-ScorePRO
DOGE AVIV BandsPRO
DOGE Active MVRV & Active Realized PricePRO
DOGE Puell MultiplePRO
DOGE Investorness & ProducernessPRO
DOGE Supply In Profit/LossPRO
DOGE NUPLPRO
DOGE NUPL Z-ScorePRO
DOGE Relative Unrealized P/LPRO
DOGE aSOPRPRO
DOGE STH-NUPLPRO
DOGE LTH-NUPLPRO
DOGE AVIV-NUPLPRO
DOGE SOPRPRO
DOGE RHODL RatioPRO
DOGE STH/LTH Realized Price RatioPRO
DOGE Market Realized P/L RatioPRO
DOGE SLRV RatioPRO
DOGE STH/LTH CDDPRONEW
DOGE Active AddressesPRONEW
DOGE Composite MomentumPRO
DOGE STH-NUPL MomentumPRO
DOGE LTH-NUPL MomentumPRO
DOGE Realized P&L Deviation MomentumPRO
DOGE RHODL MomentumPRO
DOGE LTH Realized P/L Ratio MomentumPRO
DOGE STH Realized P/L Ratio MomentumPRO
DOGE MVRV MomentumPRO
DOGE AVIV MomentumPRO
DOGE STH SOPR MomentumPRO
DOGE LTH SOPR MomentumPRO
DOGE VDD MultiplePRO
DOGE Block HeightPRO
DOGE Thermocap FlowPRO
DOGE CDD (Coin Days Dest.)PRO
DOGE Daily UTXOs SpentPRO
DOGE Daily UTXOs CreatedPRO
DOGE Transaction FeesPRO
DOGE Blocks MinedPRO
DOGE Coinblocks CreatedPRO
DOGE Coinblocks DestroyedPRO
DOGE LivelinessPRO
DOGE VaultednessPRO
DOGE A2VR - Activity to Vaulted RatioPRO
DOGE A2VR MomentumPRO
DOGE LTH Adaptive MVRV Z-ScorePRO
DOGE Onchain Risk CompositePRO
DOGE Sell Side PressurePRO
DOGE Realized P/L by BandPRONEW
DOGE Realized P/L HeatmapPRONEW
DOGE Cost Basis ConcentrationPRONEW
DOGE Implied On-Chain VolatilityPRONEW
DOGE CB Profit/Loss RatioPRONEW
DOGE CB Profit Take RatePRONEW
DOGE CB Supply ShiftPRONEW
DOGE Realized P&L Sharpe RatioPRO
DOGE Cost Basis ConvergencePRO
DOGE Realized P&L AccelerationPRO
DOGE Seller Exhaustion ConstantPRO
DOGE SOPD HeatmapPRONEW
DOGE STH Cost Basis DistributionPRONEW
DOGE LTH Cost Basis DistributionPRONEW
DOGE STH Unrealized P/L HeatmapPRONEW
DOGE LTH Unrealized P/L HeatmapPRONEW
DOGE STH Address Count HeatmapPRONEW
DOGE LTH Address Count HeatmapPRONEW
DOGE STH SOPD HeatmapPRONEW
DOGE LTH SOPD HeatmapPRONEW
DOGE STH Realized P/L HeatmapPRONEW
DOGE LTH Realized P/L HeatmapPRONEW
DOGE Cost Basis Heatmap by Age CohortPRONEW
DOGE Cost Basis Distribution by Age CohortPRONEW
DOGE Unrealized P/L Heatmap by Age CohortPRONEW
DOGE Address Count Heatmap by Age CohortPRONEW
DOGE SOPD Heatmap by Age CohortPRONEW
DOGE Realized P/L Heatmap by Age CohortPRONEW
DOGE Median Cost Basis by Age CohortPRONEW
DOGE STH Median MVRVPRONEW
DOGE LTH Median MVRVPRONEW
DOGE STH:LTH Median Cost Basis RatioPRONEW
DOGE Seller Median Cost BasisPRONEW
LTC STH vs LTH SupplyPRO
LTC Hodler Net Position ChangePRO
LTC STH-SOPRPRO
LTC LTH-SOPRPRO
LTC SOPR by AgePRO
LTC SOPR Z-ScorePRO
LTC STH Cost BasisPRO
LTC STH Cost Basis ChangePRO
LTC LTH Wealth ConcentrationPRO
LTC STH Wealth ConcentrationPRO
LTC STH % Supply in ProfitPRO
LTC STH % Supply in LossPRO
LTC LTH % Supply in ProfitPRO
LTC LTH % Supply in LossPRO
LTC Active Supply in Profit & LossPRO
LTC Vaulted Supply in Profit & LossPRO
LTC STH Net Position ChangePRO
LTC LTH Net Position ChangePRO
LTC LTH Cost BasisPRO
LTC LTH Cost Basis ChangePRO
LTC STH MVRVPRO
LTC LTH MVRVPRO
LTC Holder Realized PricesPRO
LTC STH StressPRO
LTC LTH StressPRO
LTC STH MVRV Z-ScorePRO
LTC LTH MVRV Z-ScorePRO
LTC Realized P&L DeviationPRO
LTC SOPR by Cost Basis BandPRONEW
LTC Realized P&L By AgePRO
LTC Revived Supply By AgePRO
LTC Supply Last Active 1yr+ Net Position ChangePRO
LTC Percent of Supply Last Active 1yr+PRONEW
LTC LTH Realized P/L RatioPRO
LTC STH Realized P/L RatioPRO
LTC STH P/L Price FlowPRO
LTC LTH P/L Price FlowPRO
LTC Relative Long/Short-Term Holder Realized P/LPRO
LTC Active MVRV NormPRO
LTC CVDD BandsPRO
LTC MVRVPRO
LTC True Market Mean AVIVPRO
LTC Onchain Price LevelsPRO
LTC Realized P&LPRO
LTC Net Realized P&LPRO
LTC Relative Realized P/LPRO
LTC MVRV BandsPRO
LTC Reserve RiskPRO
LTC Reserve Risk AdjustedPRO
LTC MVRV Z-ScorePRO
LTC Median MVRVPRONEW
LTC Realized CapPRO
LTC Realized Cap DrawdownPRO
LTC Days Above/Below Realized PricePRO
LTC Sell-Side Risk RatioPRO
LTC Market Cap to Thermocap Ratio (MCTC)PRO
LTC AVIV Z-ScorePRO
LTC AVIV BandsPRO
LTC Active MVRV & Active Realized PricePRO
LTC Puell MultiplePRO
LTC Investorness & ProducernessPRO
LTC Supply In Profit/LossPRO
LTC NUPLPRO
LTC NUPL Z-ScorePRO
LTC Relative Unrealized P/LPRO
LTC aSOPRPRO
LTC STH-NUPLPRO
LTC LTH-NUPLPRO
LTC AVIV-NUPLPRO
LTC SOPRPRO
LTC RHODL RatioPRO
LTC STH/LTH Realized Price RatioPRO
LTC Market Realized P/L RatioPRO
LTC SLRV RatioPRO
LTC STH/LTH CDDPRONEW
LTC Active/Vaulted Profit & LossPRONEW
LTC Active AddressesPRONEW
LTC VDD MultiplePRO
LTC Block HeightPRO
LTC Thermocap FlowPRO
LTC CDD (Coin Days Dest.)PRO
LTC ACDD (Adjusted CDD)PRO
LTC Transaction FeesPRO
LTC Hash RatePRO
LTC Blocks MinedPRO
LTC Coinblocks CreatedPRO
LTC Coinblocks DestroyedPRO
LTC LivelinessPRO
LTC VaultednessPRO
LTC A2VR - Activity to Vaulted RatioPRO
LTC A2VR MomentumPRO
LTC LTH Adaptive MVRV Z-ScorePRO
LTC Onchain Risk CompositePRO
LTC Sell Side PressurePRO
LTC Realized P/L by BandPRONEW
LTC Realized P/L HeatmapPRONEW
LTC Cost Basis ConcentrationPRONEW
LTC Implied On-Chain VolatilityPRONEW
LTC CB Profit/Loss RatioPRONEW
LTC CB Profit Take RatePRONEW
LTC CB Supply ShiftPRONEW
LTC Realized P&L Sharpe RatioPRO
LTC Cost Basis ConvergencePRO
LTC Realized P&L AccelerationPRO
LTC Seller Exhaustion ConstantPRO
LTC SOPD HeatmapPRONEW
LTC STH Cost Basis DistributionPRONEW
LTC LTH Cost Basis DistributionPRONEW
LTC STH Unrealized P/L HeatmapPRONEW
LTC LTH Unrealized P/L HeatmapPRONEW
LTC STH Address Count HeatmapPRONEW
LTC LTH Address Count HeatmapPRONEW
LTC STH SOPD HeatmapPRONEW
LTC LTH SOPD HeatmapPRONEW
LTC STH Realized P/L HeatmapPRONEW
LTC LTH Realized P/L HeatmapPRONEW
LTC Cost Basis Heatmap by Age CohortPRONEW
LTC Cost Basis Distribution by Age CohortPRONEW
LTC Unrealized P/L Heatmap by Age CohortPRONEW
LTC Address Count Heatmap by Age CohortPRONEW
LTC SOPD Heatmap by Age CohortPRONEW
LTC Realized P/L Heatmap by Age CohortPRONEW
LTC Median Cost Basis by Age CohortPRONEW
LTC STH Median MVRVPRONEW
LTC LTH Median MVRVPRONEW
LTC STH:LTH Median Cost Basis RatioPRONEW
LTC Seller Median Cost BasisPRONEW
ADA STH vs LTH SupplyPRO
ADA Hodler Net Position ChangePRO
ADA STH-SOPRPRO
ADA LTH-SOPRPRO
ADA SOPR by AgePRO
ADA SOPR Z-ScorePRO
ADA STH Cost BasisPRO
ADA STH Cost Basis ChangePRO
ADA LTH Wealth ConcentrationPRO
ADA STH Wealth ConcentrationPRO
ADA STH % Supply in ProfitPRO
ADA STH % Supply in LossPRO
ADA LTH % Supply in ProfitPRO
ADA LTH % Supply in LossPRO
ADA Active Supply in Profit & LossPRO
ADA Vaulted Supply in Profit & LossPRO
ADA STH Net Position ChangePRO
ADA LTH Net Position ChangePRO
ADA LTH Cost BasisPRO
ADA LTH Cost Basis ChangePRO
ADA STH MVRVPRO
ADA LTH MVRVPRO
ADA Holder Realized PricesPRO
ADA STH StressPRO
ADA LTH StressPRO
ADA STH MVRV Z-ScorePRO
ADA LTH MVRV Z-ScorePRO
ADA Realized P&L DeviationPRO
ADA SOPR by Cost Basis BandPRONEW
ADA Realized P&L By AgePRO
ADA Revived Supply By AgePRO
ADA Supply Last Active 1yr+ Net Position ChangePRO
ADA Percent of Supply Last Active 1yr+PRONEW
ADA LTH Realized P/L RatioPRO
ADA STH Realized P/L RatioPRO
ADA STH P/L Price FlowPRO
ADA LTH P/L Price FlowPRO
ADA Active MVRV NormPRO
ADA CVDD BandsPRO
ADA MVRVPRO
ADA True Market Mean AVIVPRO
ADA Onchain Price LevelsPRO
ADA Realized P&LPRO
ADA Net Realized P&LPRO
ADA Relative Realized P/LPRO
ADA MVRV BandsPRO
ADA Reserve RiskPRO
ADA Reserve Risk AdjustedPRO
ADA MVRV Z-ScorePRO
ADA Median MVRVPRONEW
ADA Realized CapPRO
ADA Realized Cap DrawdownPRO
ADA Days Above/Below Realized PricePRO
ADA Sell-Side Risk RatioPRO
ADA Market Cap to Thermocap Ratio (MCTC)PRO
ADA AVIV Z-ScorePRO
ADA AVIV BandsPRO
ADA Active MVRV & Active Realized PricePRO
ADA Puell MultiplePRO
ADA Investorness & ProducernessPRO
ADA LTH Adaptive MVRV Z-ScorePRO
ADA Onchain Risk CompositePRO
ADA Sell Side PressurePRO
ADA Realized P/L by BandPRONEW
ADA Realized P/L HeatmapPRONEW
ADA Cost Basis ConcentrationPRONEW
ADA Implied On-Chain VolatilityPRONEW
ADA CB Profit/Loss RatioPRONEW
ADA CB Profit Take RatePRONEW
ADA CB Supply ShiftPRONEW
ADA Realized P&L Sharpe RatioPRO
ADA Cost Basis ConvergencePRO
ADA Realized P&L AccelerationPRO
ADA Seller Exhaustion ConstantPRO
ADA SOPD HeatmapPRONEW
ADA STH Cost Basis DistributionPRONEW
ADA LTH Cost Basis DistributionPRONEW
ADA STH Unrealized P/L HeatmapPRONEW
ADA LTH Unrealized P/L HeatmapPRONEW
ADA STH Address Count HeatmapPRONEW
ADA LTH Address Count HeatmapPRONEW
ADA STH SOPD HeatmapPRONEW
ADA LTH SOPD HeatmapPRONEW
ADA STH Realized P/L HeatmapPRONEW
ADA LTH Realized P/L HeatmapPRONEW
ADA Cost Basis Heatmap by Age CohortPRONEW
ADA Cost Basis Distribution by Age CohortPRONEW
ADA Unrealized P/L Heatmap by Age CohortPRONEW
ADA Address Count Heatmap by Age CohortPRONEW
ADA SOPD Heatmap by Age CohortPRONEW
ADA Realized P/L Heatmap by Age CohortPRONEW
ADA Median Cost Basis by Age CohortPRONEW
ADA STH Median MVRVPRONEW
ADA LTH Median MVRVPRONEW
ADA STH:LTH Median Cost Basis RatioPRONEW
ADA Seller Median Cost BasisPRONEW
LINK STH vs LTH SupplyPRO
LINK Hodler Net Position ChangePRO
LINK STH-SOPRPRO
LINK LTH-SOPRPRO
LINK SOPR by AgePRO
LINK OG Whale Spending EventsPRO
LINK SOPR Z-ScorePRO
LINK STH Cost BasisPRO
LINK STH Cost Basis ChangePRO
LINK LTH Wealth ConcentrationPRO
LINK STH Wealth ConcentrationPRO
LINK STH % Supply in ProfitPRO
LINK STH % Supply in LossPRO
LINK LTH % Supply in ProfitPRO
LINK LTH % Supply in LossPRO
LINK STH Net Position ChangePRO
LINK LTH Net Position ChangePRO
LINK LTH Cost BasisPRO
LINK LTH Cost Basis ChangePRO
LINK STH MVRVPRO
LINK LTH MVRVPRO
LINK Holder Realized PricesPRO
LINK STH StressPRO
LINK LTH StressPRO
LINK STH MVRV Z-ScorePRO
LINK LTH MVRV Z-ScorePRO
LINK Realized P&L DeviationPRO
LINK SOPR by Cost Basis BandPRONEW
LINK Realized P&L By AgePRO
LINK Revived Supply By AgePRO
LINK Supply Last Active 1yr+ Net Position ChangePRO
LINK Percent of Supply Last Active 1yr+PRONEW
LINK STH P/L Price FlowPRO
LINK LTH P/L Price FlowPRO
LINK Relative Long/Short-Term Holder Realized P/LPRO
LINK HODL WavesPRO
LINK Market Cap by AgePRONEW
LINK Balance Distribution (Shrimp to Whale)PRO
LINK Accumulation IndexPRO
LINK Whale vs Retail Delta HeatmapPRO
LINK Cost Basis HeatmapPRONEW
LINK HODL Waves in Profit/LossPRONEW
LINK Cost Basis QuantilesPRONEW
LINK Unrealized P/L HeatmapPRONEW
LINK Realized Cap HODL Profit/LossPRONEW
LINK Address Count HeatmapPRONEW
LINK Circulating SupplyPRO
LINK LTH Adaptive MVRV Z-ScorePRO
LINK Onchain Risk CompositePRO
LINK Sell Side PressurePRO
LINK Realized P/L by BandPRONEW
LINK Realized P/L HeatmapPRONEW
LINK Cost Basis ConcentrationPRONEW
LINK Implied On-Chain VolatilityPRONEW
LINK Realized P&L Sharpe RatioPRO
LINK Cost Basis ConvergencePRO
LINK Realized P&L AccelerationPRO
LINK Seller Exhaustion ConstantPRO
Economics30
Dashboards3
Crypto Risk Metrics
PROCrypto Risk · Monitor cryptocurrency market risk indicators and volatility
B
B
E
E
A
A
Adaptive Risk Oscillator
PROCrypto Risk · Advanced risk metric using autocorrelation, variance decay, ...
B
B
E
E
A
A
Risk Values Non Color Coded
PROCrypto Risk · Analyze cryptocurrency risk values with traditional line cha...
B
B
E
E
A
A
Crypto Market Risk Indicator
PROCrypto Risk · Aggregate risk levels from top cryptocurrencies into a singl...
B
B
E
E
A
A
Time in Risk Bands
PROCrypto Risk · Analyze the distribution of time spent in different risk ban...
B
B
E
E
A
A
Price By Risk Level
PROCrypto Risk · Calculate and display predicted cryptocurrency prices at dif...
B
B
E
E
A
A
Alpha (Momentum/Deviation)
PROCrypto Analysis · Analyze cryptocurrency momentum and deviation from long-term...
B
B
E
E
A
A
KAMA Moving Average
PROCrypto Analysis · Cryptocurrency price analysis with Kaufman Adaptive Moving A...
B
B
E
E
A
A
Cryptocurrency Market Breadth
PROCrypto Analysis · Analyze market participation by tracking how many cryptocurr...
B
B
E
E
A
A
Altcoin Season Index
PROCrypto Analysis · Track altcoin vs Bitcoin performance cycles by measuring the...
B
B
E
E
A
A
Combined VWAP MVRV Z-Score
PROCrypto Analysis · Multi-asset Z-Score indicator that aggregates VWAP MVRV Z-Sc...
B
B
E
E
A
A
Fear & Greed Index
Crypto Analysis · Track market sentiment with the Bitcoin Fear and Greed Index...
B
B
E
E
A
A
Advanced Decline Index
PROCrypto Analysis · Track market breadth using Advanced Decline Index (ADI)
B
B
E
E
A
A
Price Horizons
Crypto Analysis · Displays price across four time horizons (Days, Months, Year...
B
B
E
E
A
A
ROI Analysis
Crypto Analysis · Return on investment analysis across different market segmen...
B
B
E
E
A
A
Sharpe Ratio Analysis
Crypto Analysis · Analyze risk-adjusted returns using the Sharpe ratio to meas...
B
B
E
E
A
A
RSI
Crypto Analysis · Analyze cryptocurrency market using RSI Analysis - the Relat...
B
B
E
E
A
A
Economic Indicators vs Crypto Correlation
Crypto Analysis · Analyze the rolling correlation between various economic ind...
B
B
E
E
A
A
Global M2 vs Crypto Correlation
Crypto Analysis · Analyze the rolling correlation between Global M2 Money Supp...
B
B
E
E
A
A
Moving Averages
Crypto Analysis · Analyze price trends using multiple moving averages to ident...
B
B
E
E
A
A
Bitcoin Fractal Dimension
Crypto Analysis · Analyze market complexity using fractal dimension calculatio...
B
B
E
E
A
A
Power Law Model
Crypto Analysis · Bitcoin price model based on the power law relationship P(t)...
B
B
E
E
A
A
GoldWave
Crypto Analysis · Advanced trend analysis using SMMA-based wave indicators to ...
B
B
E
E
A
A
Death Cross Analysis
Crypto Analysis · Track Death Cross events (50D MA crossing below 200D MA) and...
B
B
E
E
A
A
Crypto Volume Analysis
Crypto Analysis · Analyze cryptocurrency trading volume alongside price action...
B
B
E
E
A
A
Monthly Returns Table
Crypto Analysis · View Bitcoin's historical monthly returns in a comprehensive...
B
B
E
E
A
A
Days Since Percentage Decline
Crypto Analysis · Tracks the number of days since Bitcoin experienced a specif...
B
B
E
E
A
A
Price Derivative
Crypto Analysis · Plots the first derivative (rate of change) over time, showi...
B
B
E
E
A
A
Crypto Relative Strength
Crypto Analysis · Compare the relative strength and performance between two cr...
B
B
E
E
A
A
Annualized Volatility
Crypto Analysis · Measure cryptocurrency price volatility using a rolling wind...
B
B
E
E
A
A
968 charts
↑↓navigate↵selectescclose⌘Qtoggle