Necessary cookies keep ChartInspect working. With your permission, analytics helps us improve the site and marketing measures campaigns. Analytics is on by default and you can switch it off at any time; marketing stays off until you turn it on. You can keep browsing and change either choice in Cookie settings.
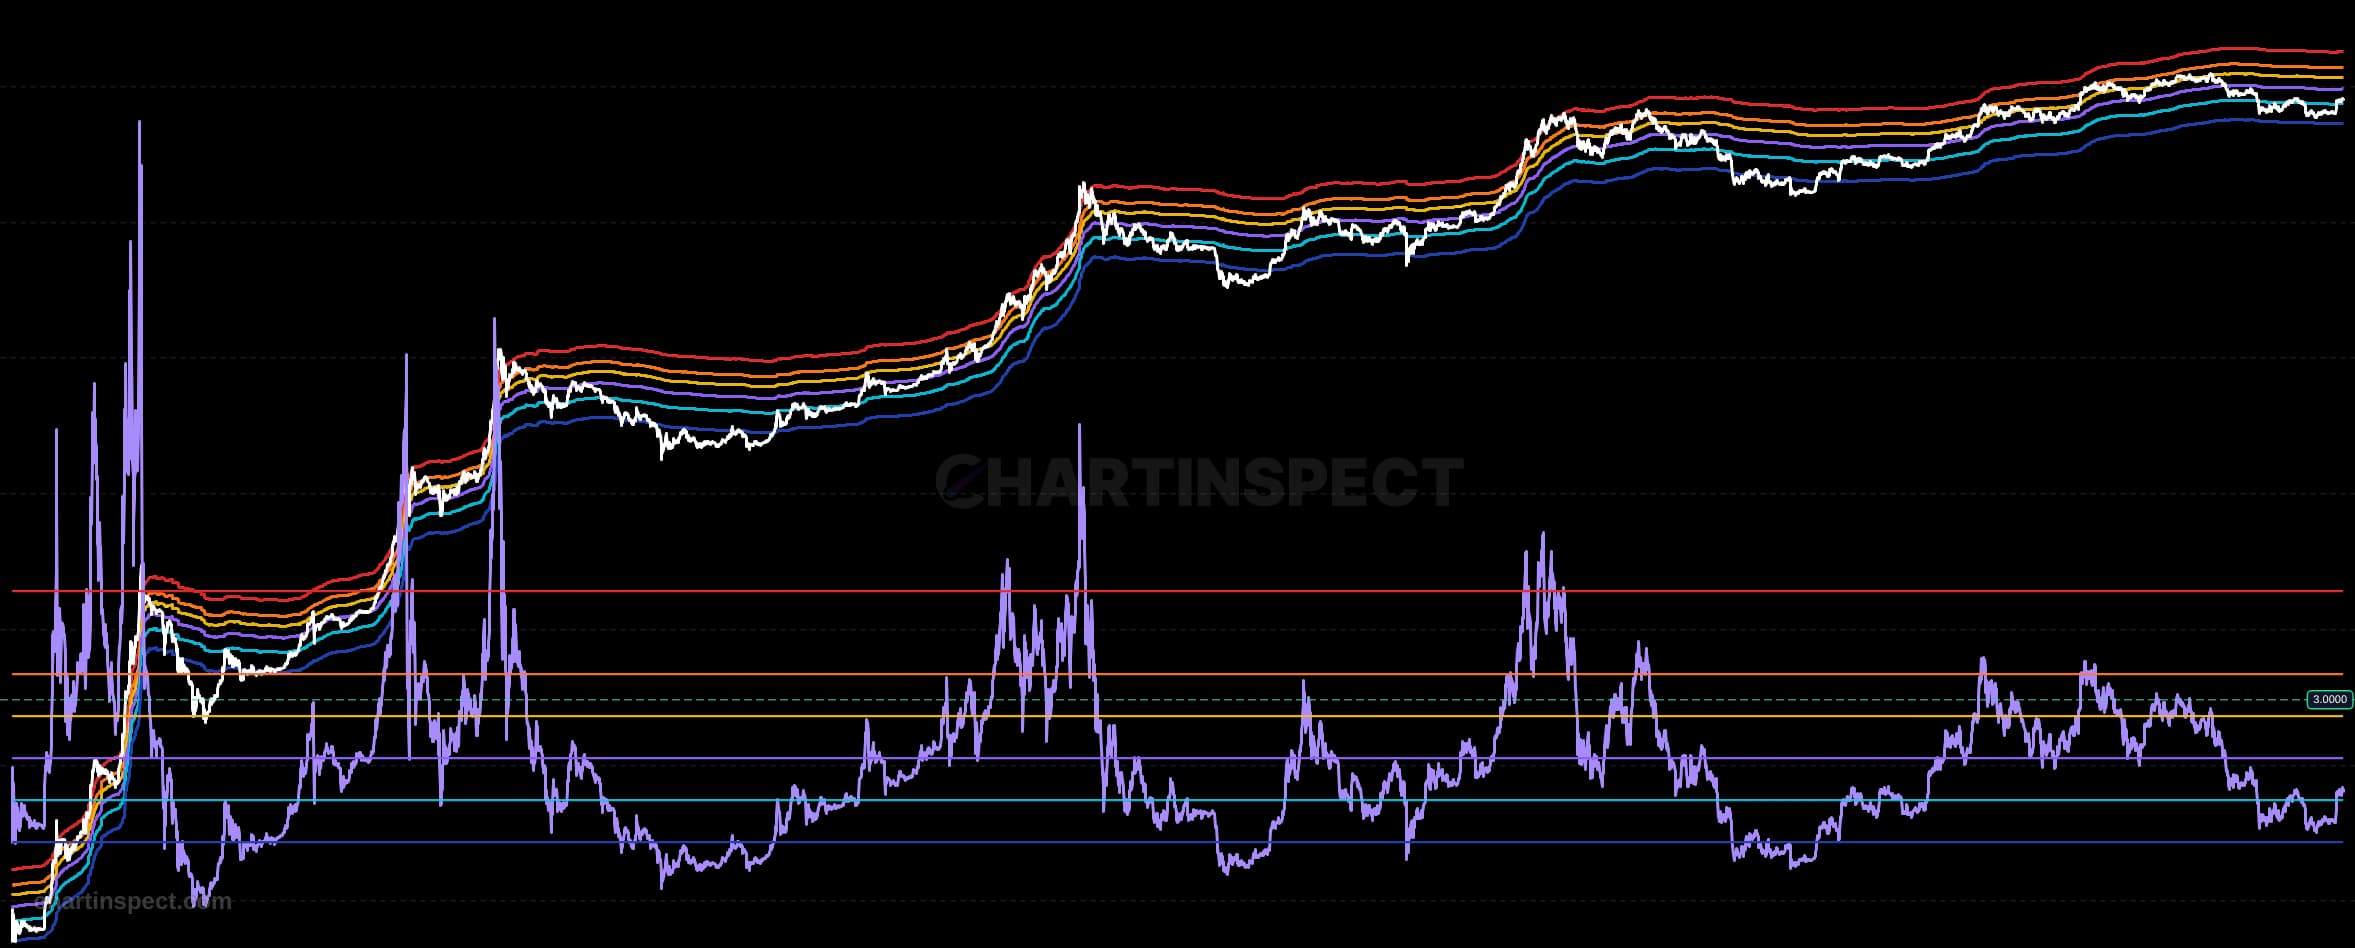
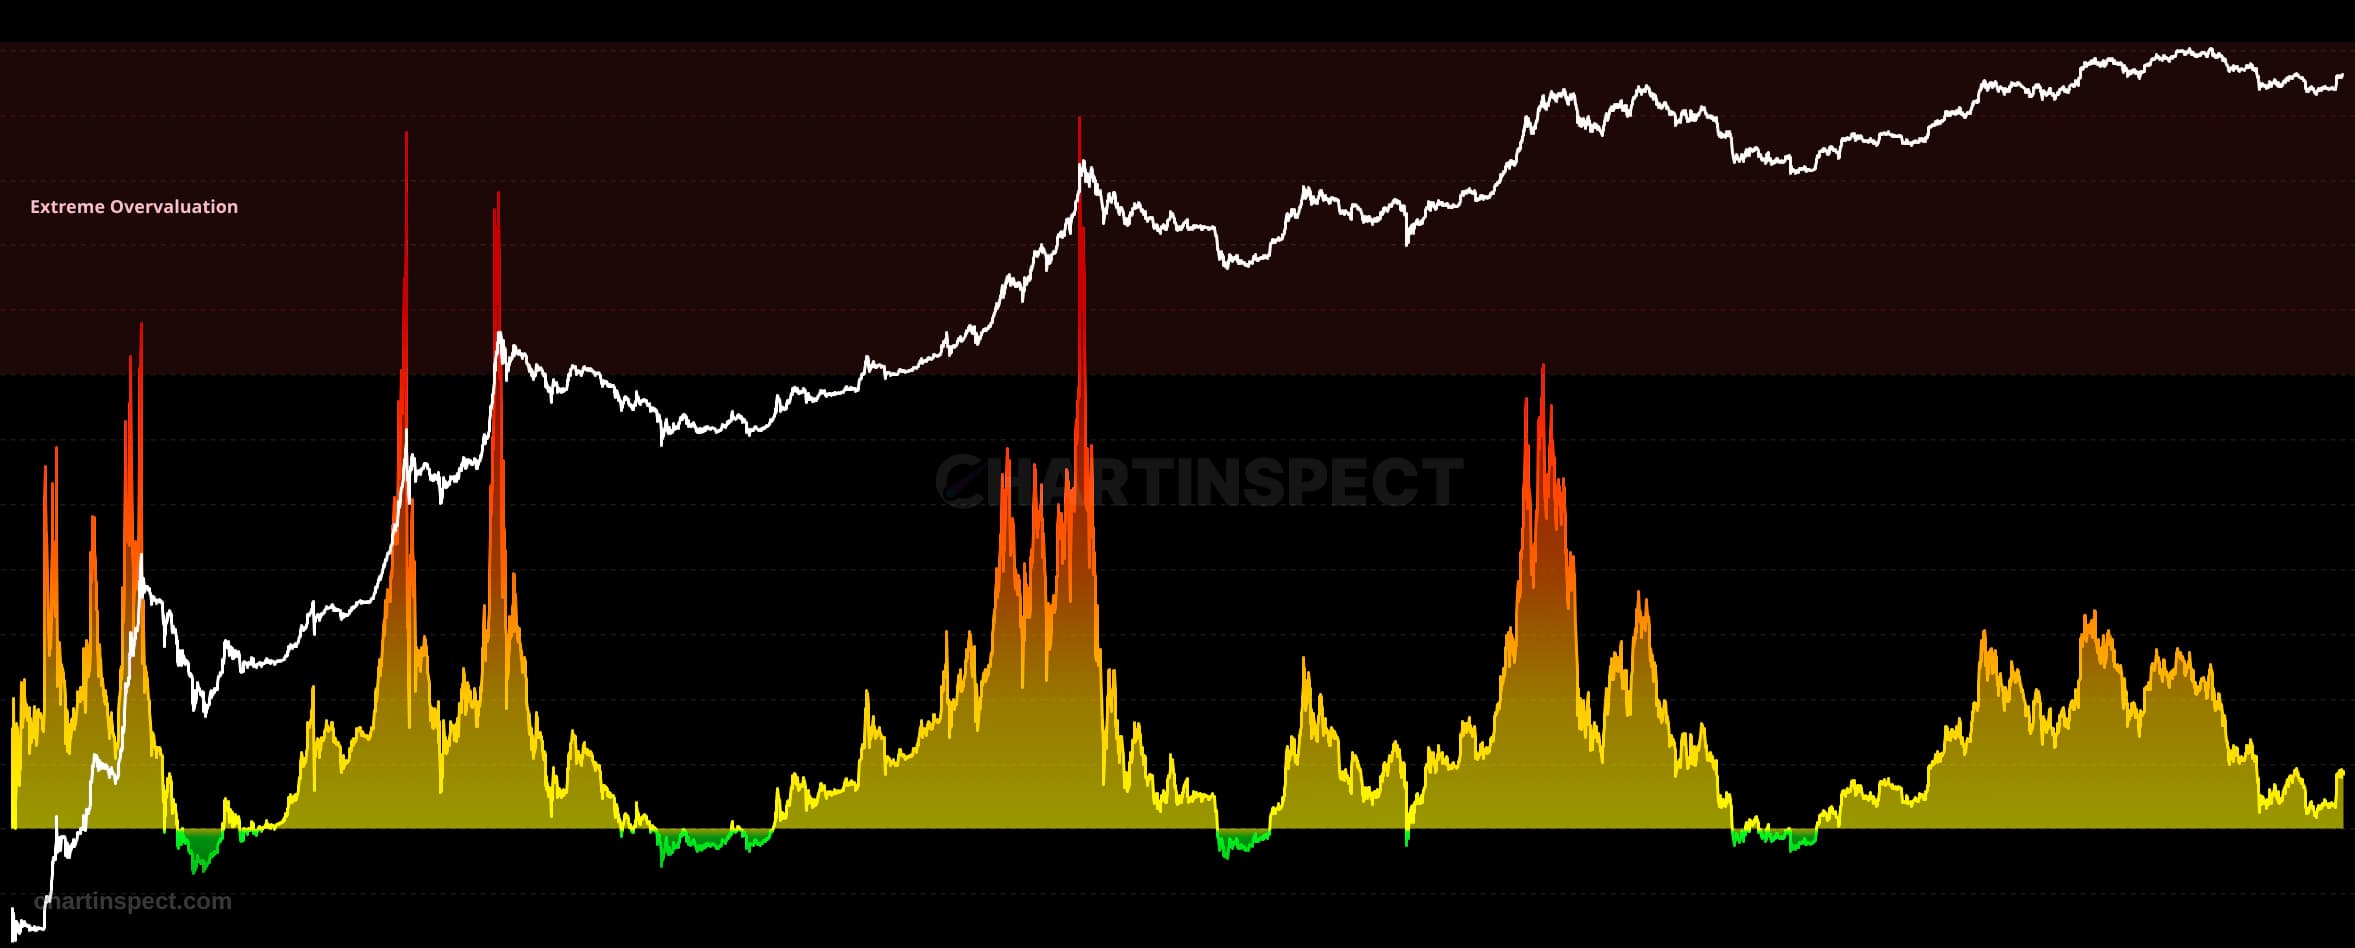
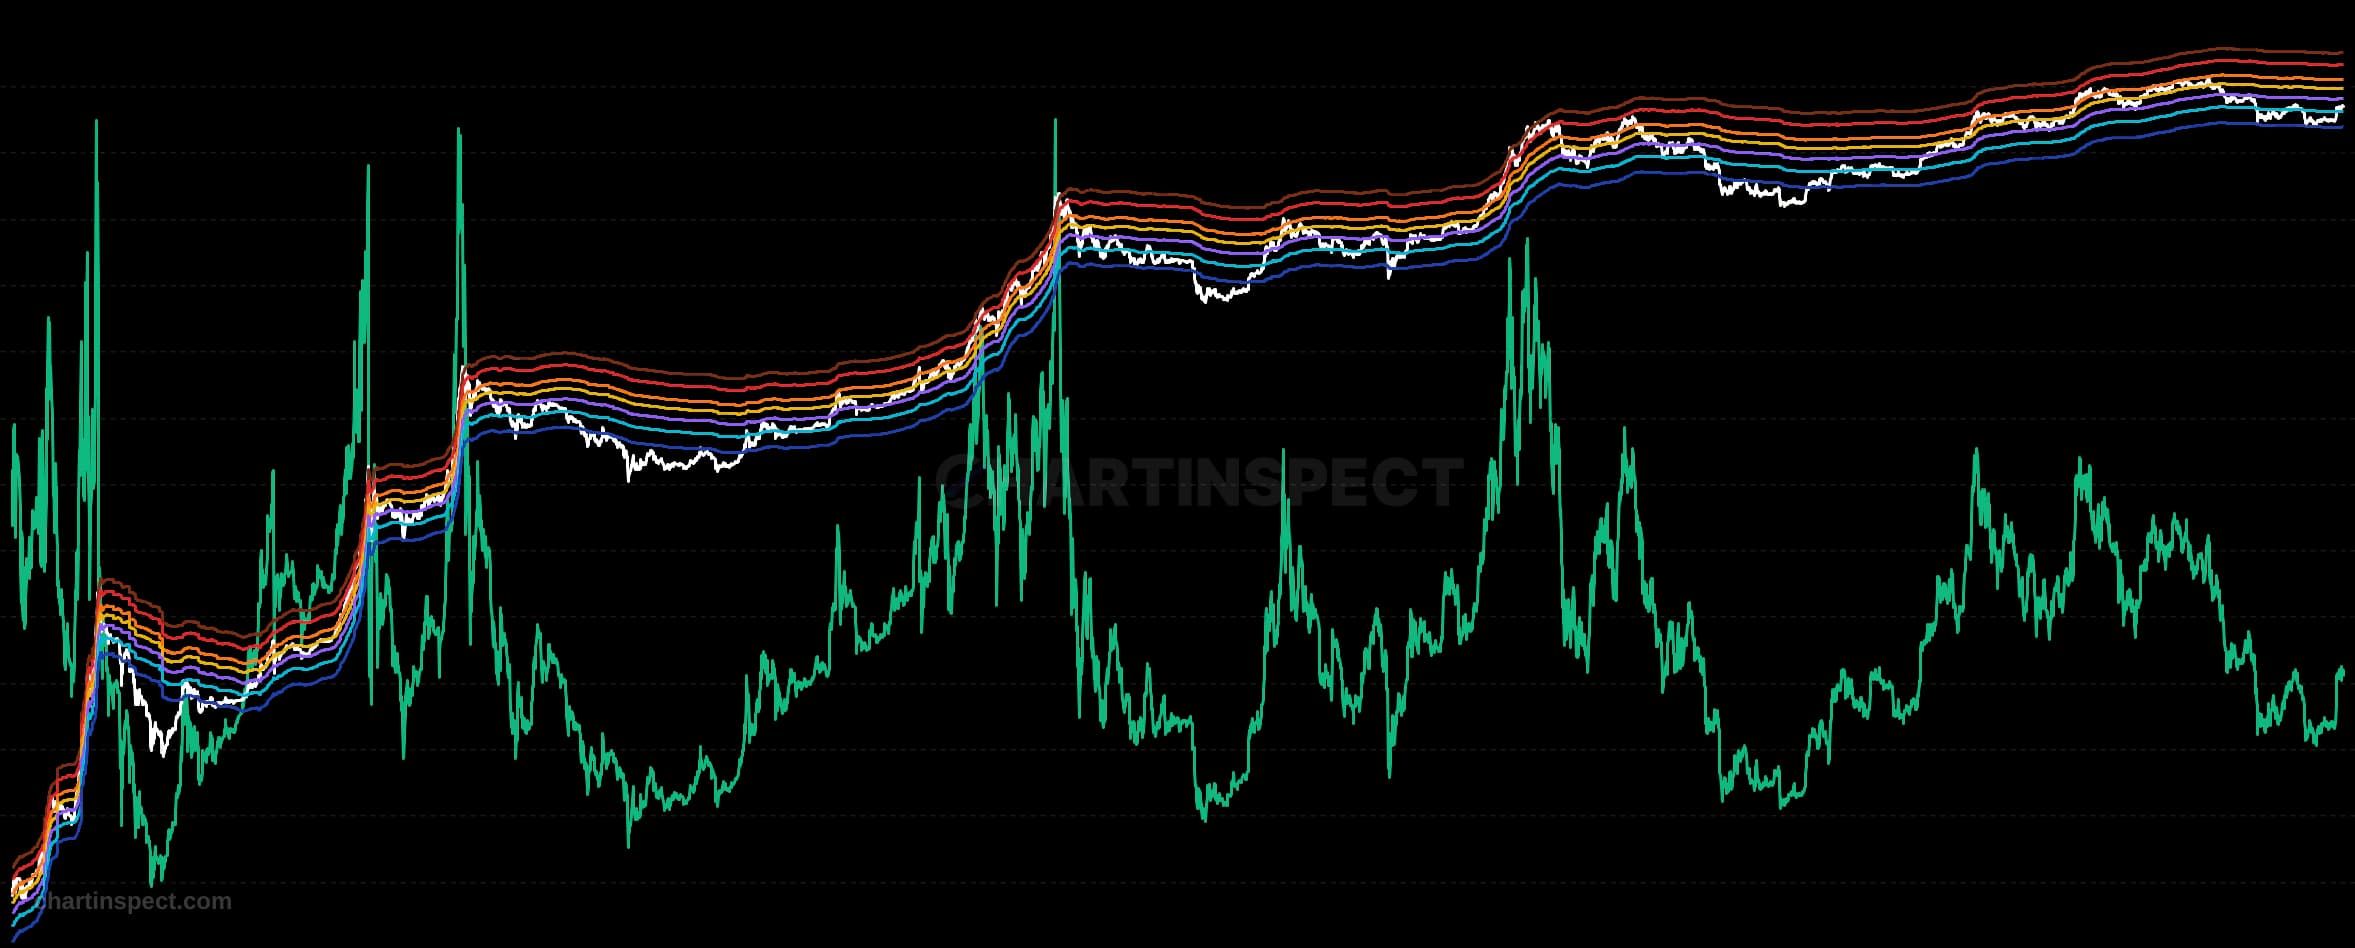
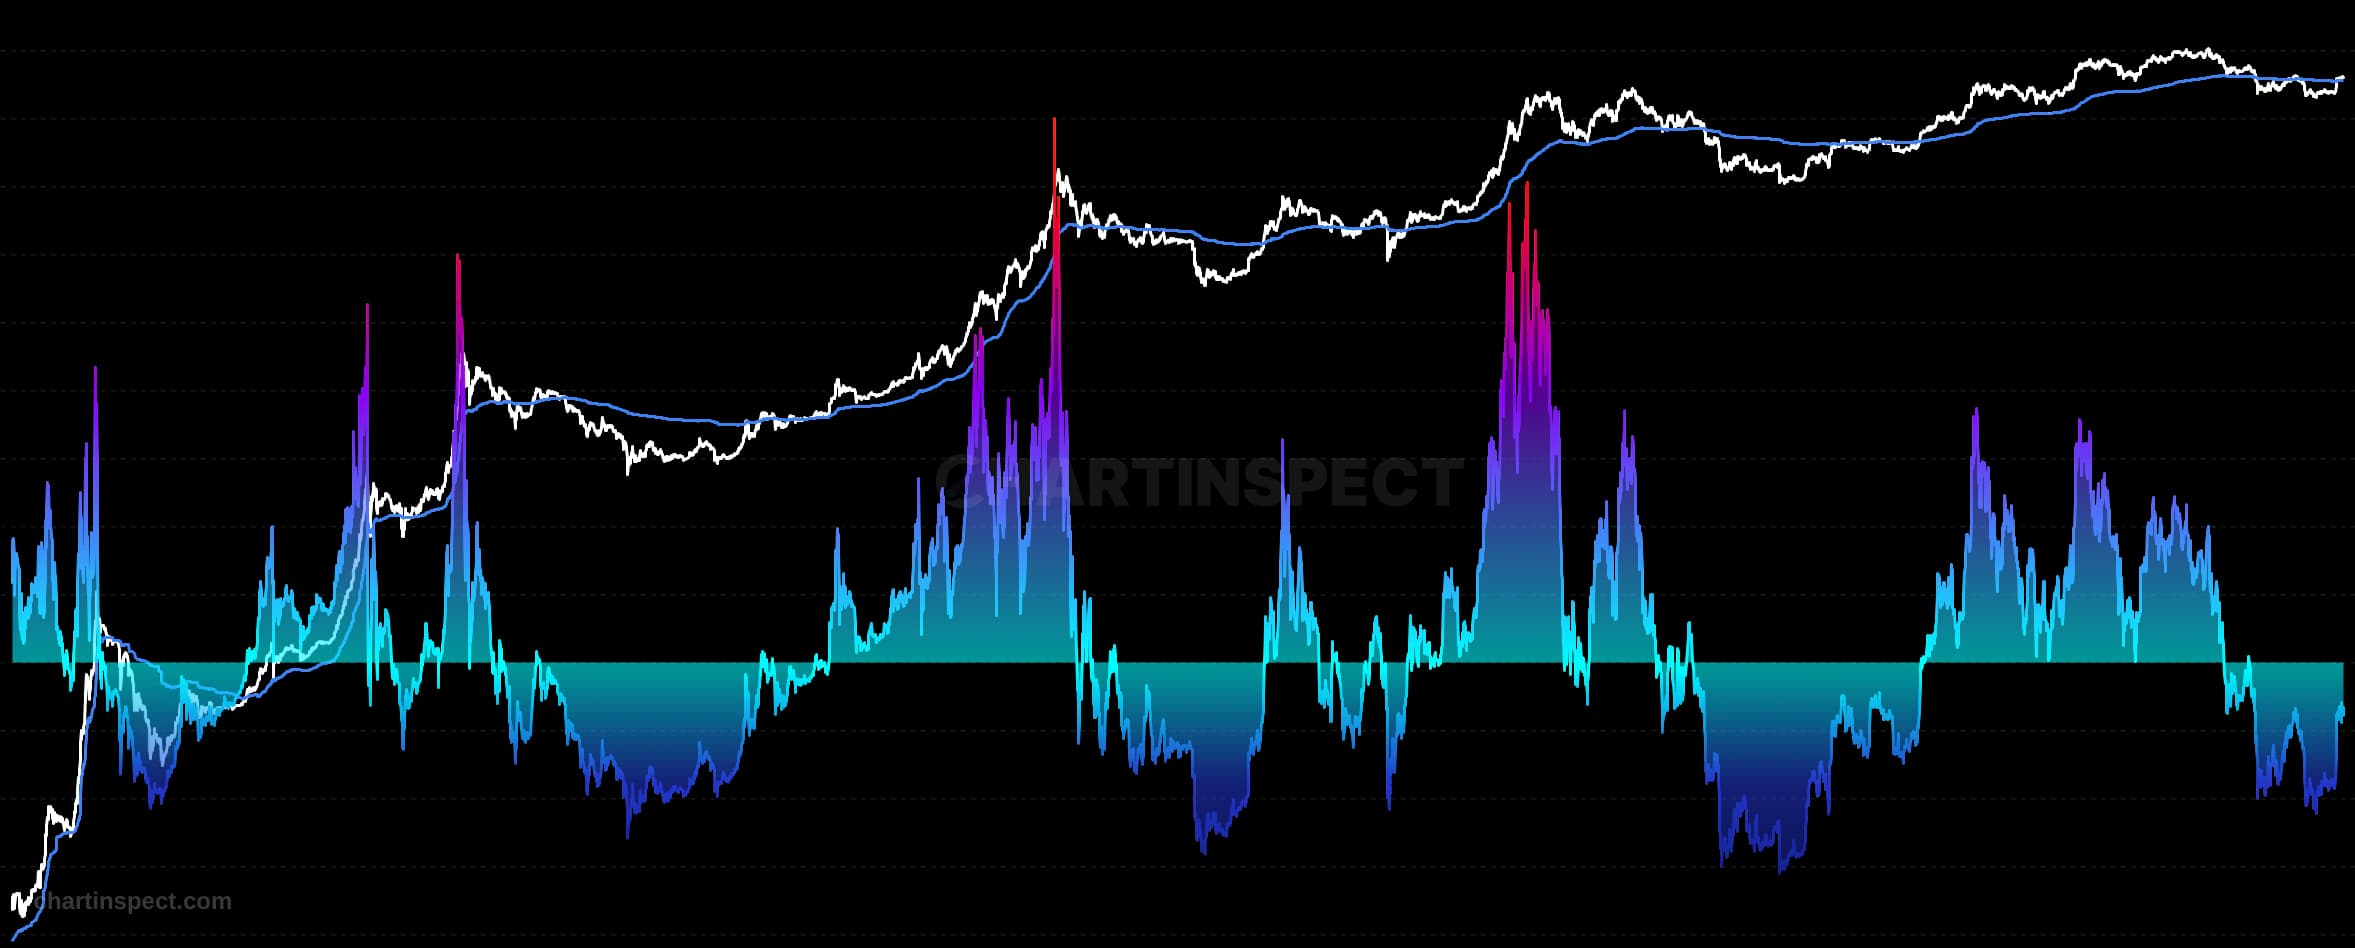
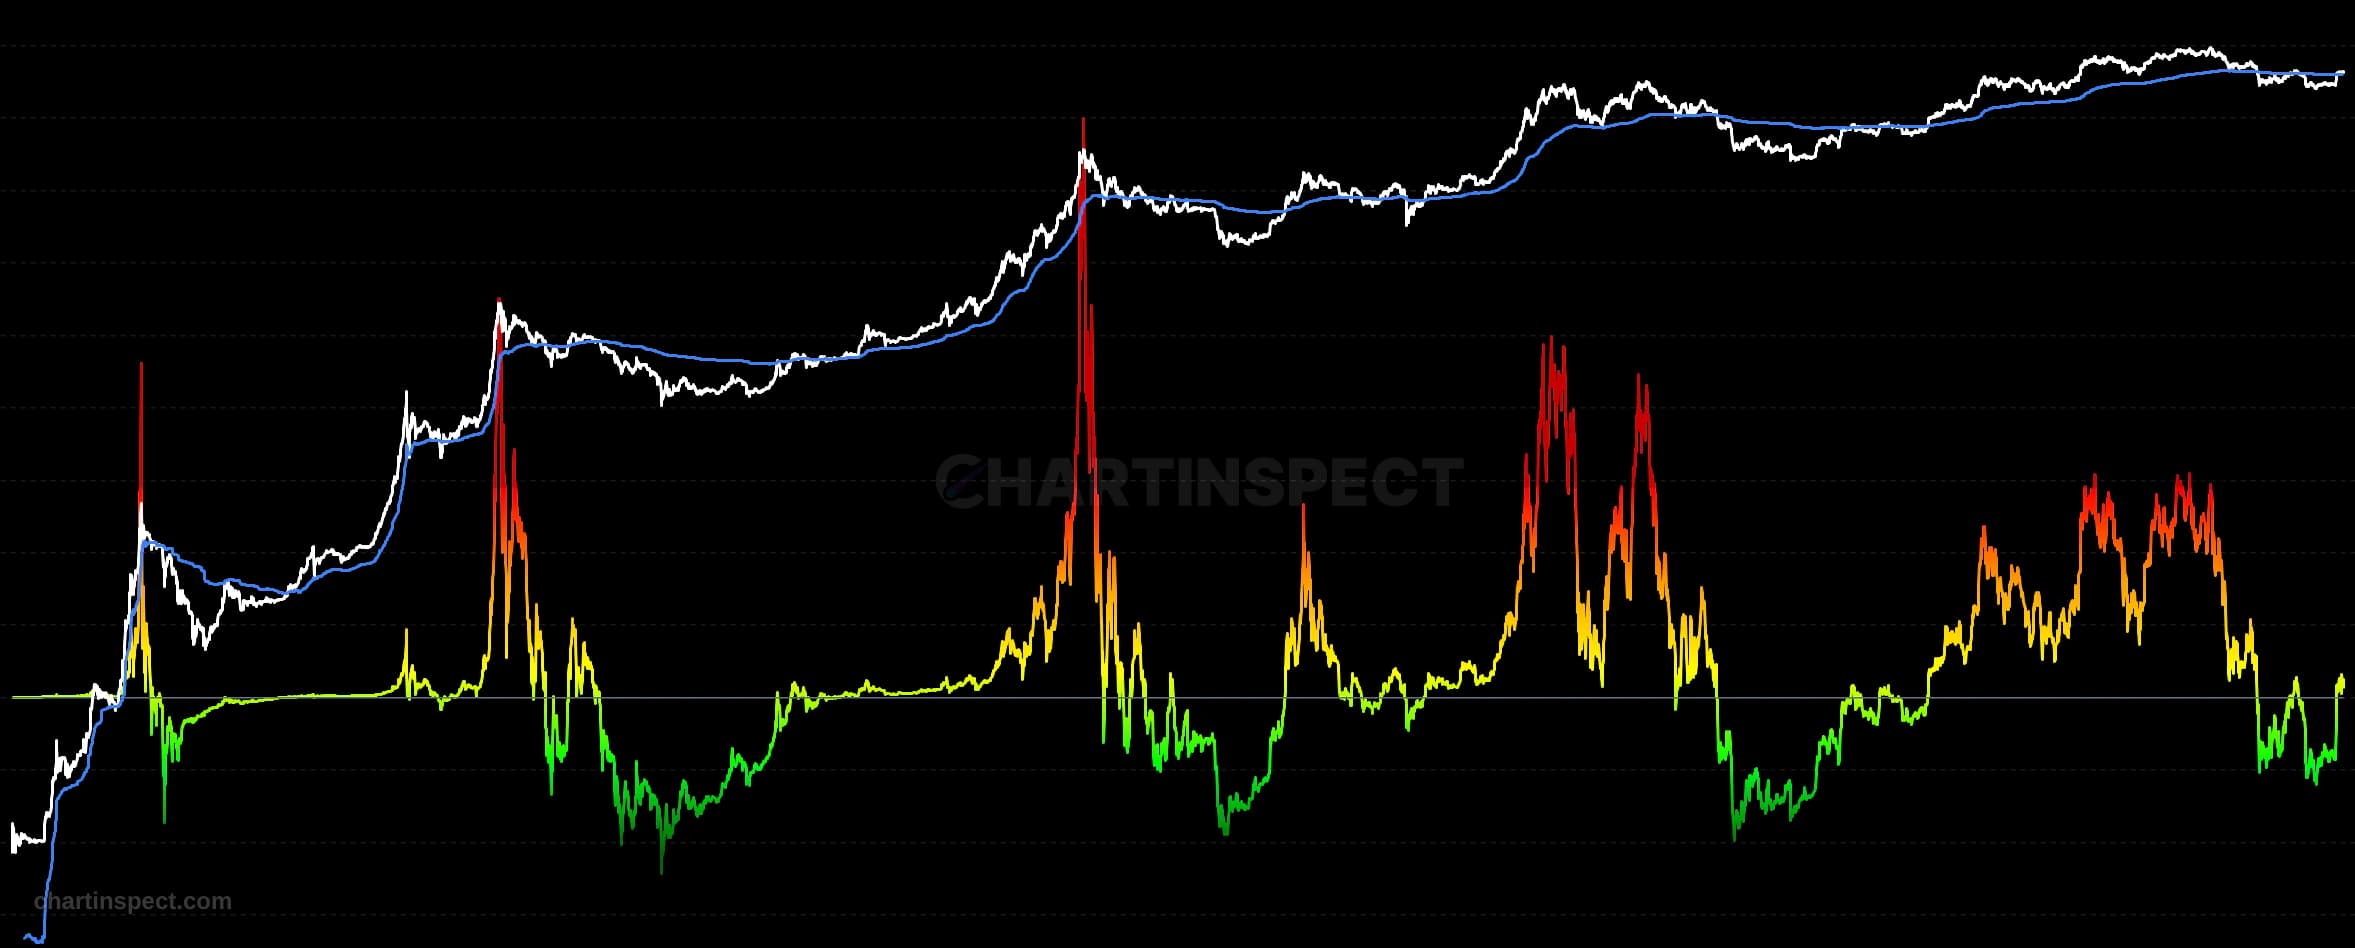
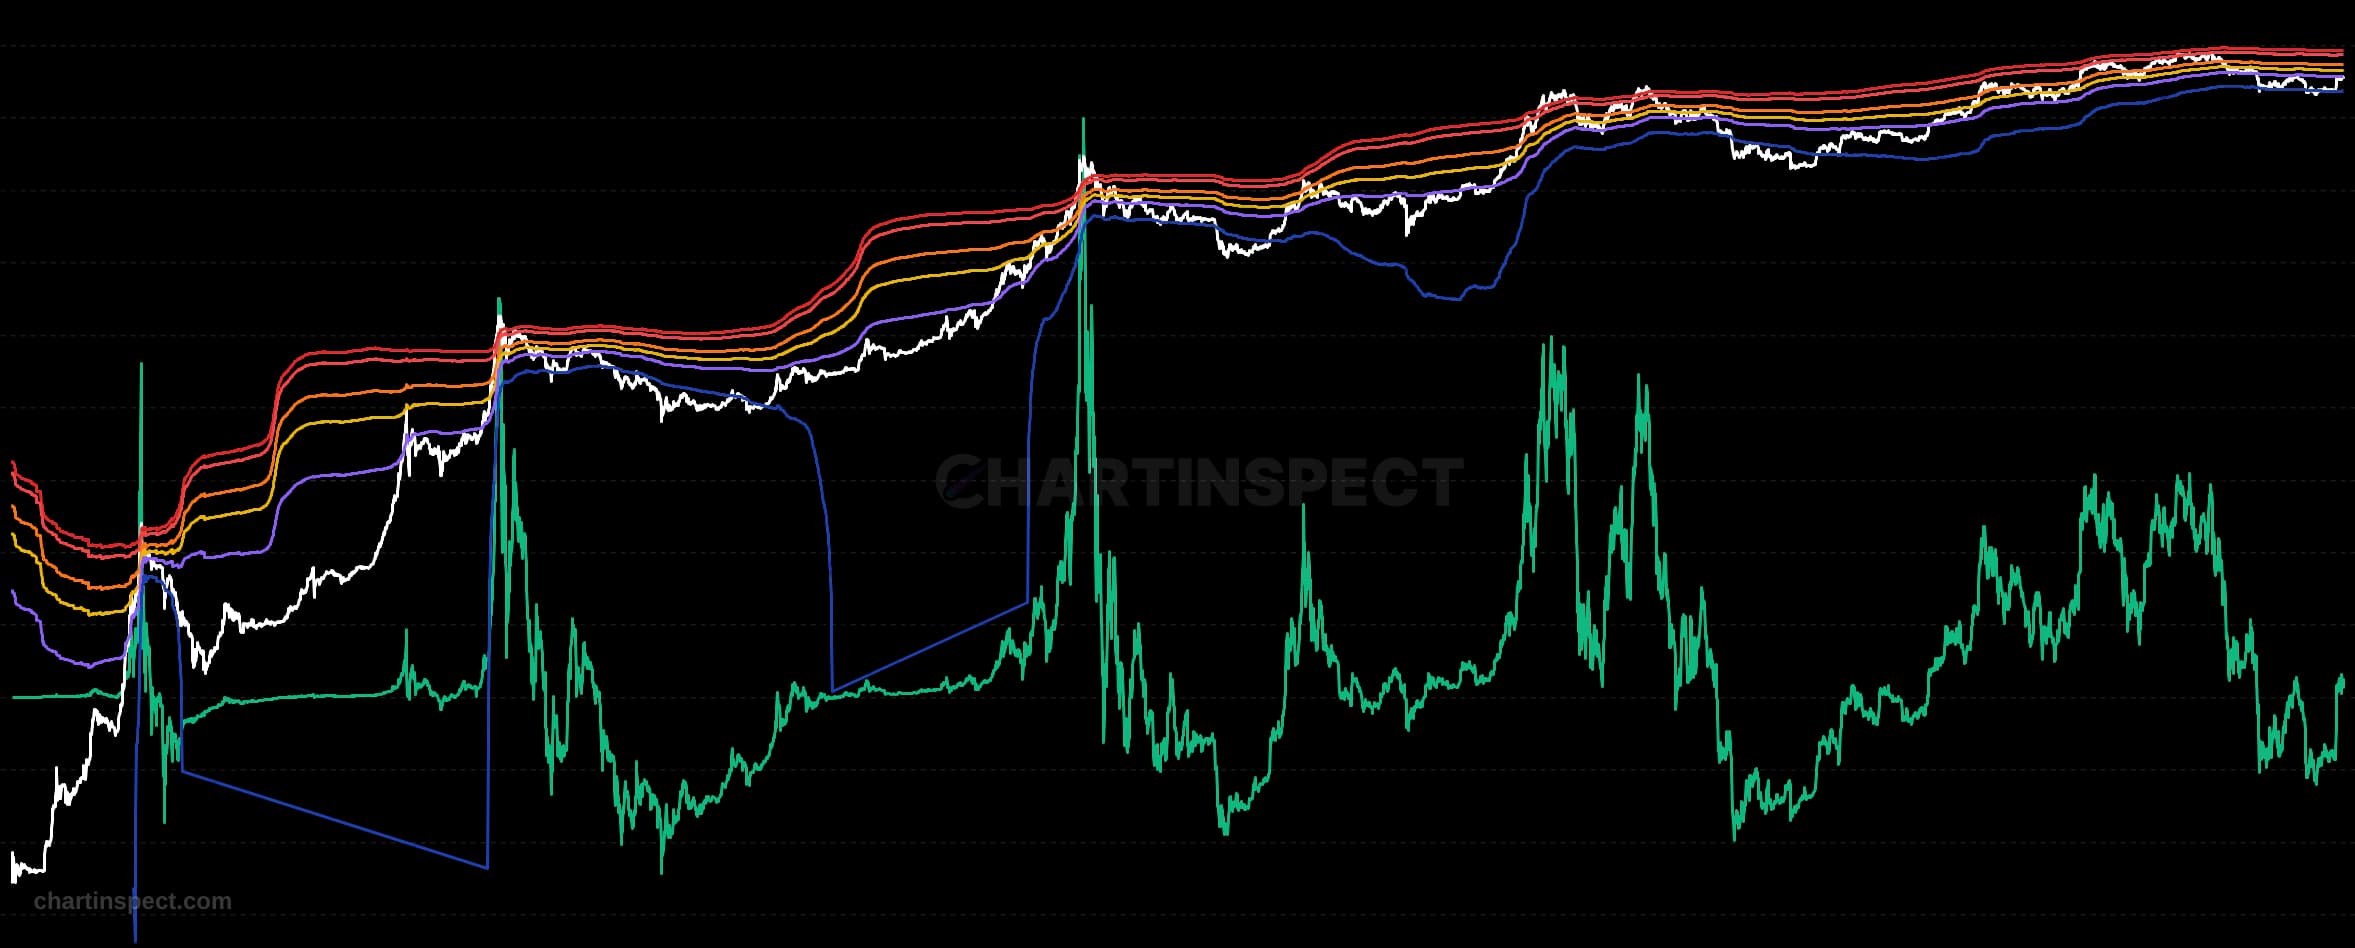
Bitcoin MVRV ratio chart: market value divided by realized value, plotted with realized price and the bitcoin price. Statistical bands reveal historical overvaluation and undervaluation zones for market timing
The Bitcoin MVRV ratio compares Bitcoin's market capitalization to its realized capitalization. Market cap is the current price multiplied by circulating supply. Realized cap values each coin at the price it last moved on-chain, so it represents the aggregate cost basis of the network rather than today's quote. The ratio tells you how much the network is in profit or loss as a multiple of what holders paid.
Historically, an MVRV above roughly 3.5 has marked Bitcoin cycle tops as latent profit becomes too tempting to hold, while values below roughly 1.0 correspond to deep bear-market accumulation zones where most of the supply trades below its on-chain cost basis. The statistical bands overlaid on this chart show plus or minus 1 and 2 standard deviations from the long-run mean, giving you a regime-aware view rather than a single fixed threshold.
Read MVRV alongside the realized price line: when spot price trends well above realized price, holders sit on unrealized gains and selling pressure builds; when spot trades below realized price, the average holder is underwater and capitulation risk rises. Use MVRV as a cycle-position gauge, not a precise timing signal; it can stay extended for months.
Check the selected asset, units, and cohort before comparing readings. Compare the metric over consistent dates and use related measures to understand what contributes to a change.
Interpretation and limitations
Addresses and on-chain cohorts do not identify individual people. Network designs and available histories differ, so a threshold observed on one asset may not transfer to another.
Bitcoin MVRV ratio chart: market value divided by realized value, plotted with realized price and the bitcoin price. Statistical bands reveal historical overvaluation and undervaluation zones for market timing
Freshness: Not yet verified
Community snapshot
No community calls on MVRV yet. Be the first to share a take.