Necessary cookies keep ChartInspect working. With your permission, analytics helps us improve the site and marketing measures campaigns. Analytics is on by default and you can switch it off at any time; marketing stays off until you turn it on. You can keep browsing and change either choice in Cookie settings.
Read our cookie policyOn-Chain Metrics
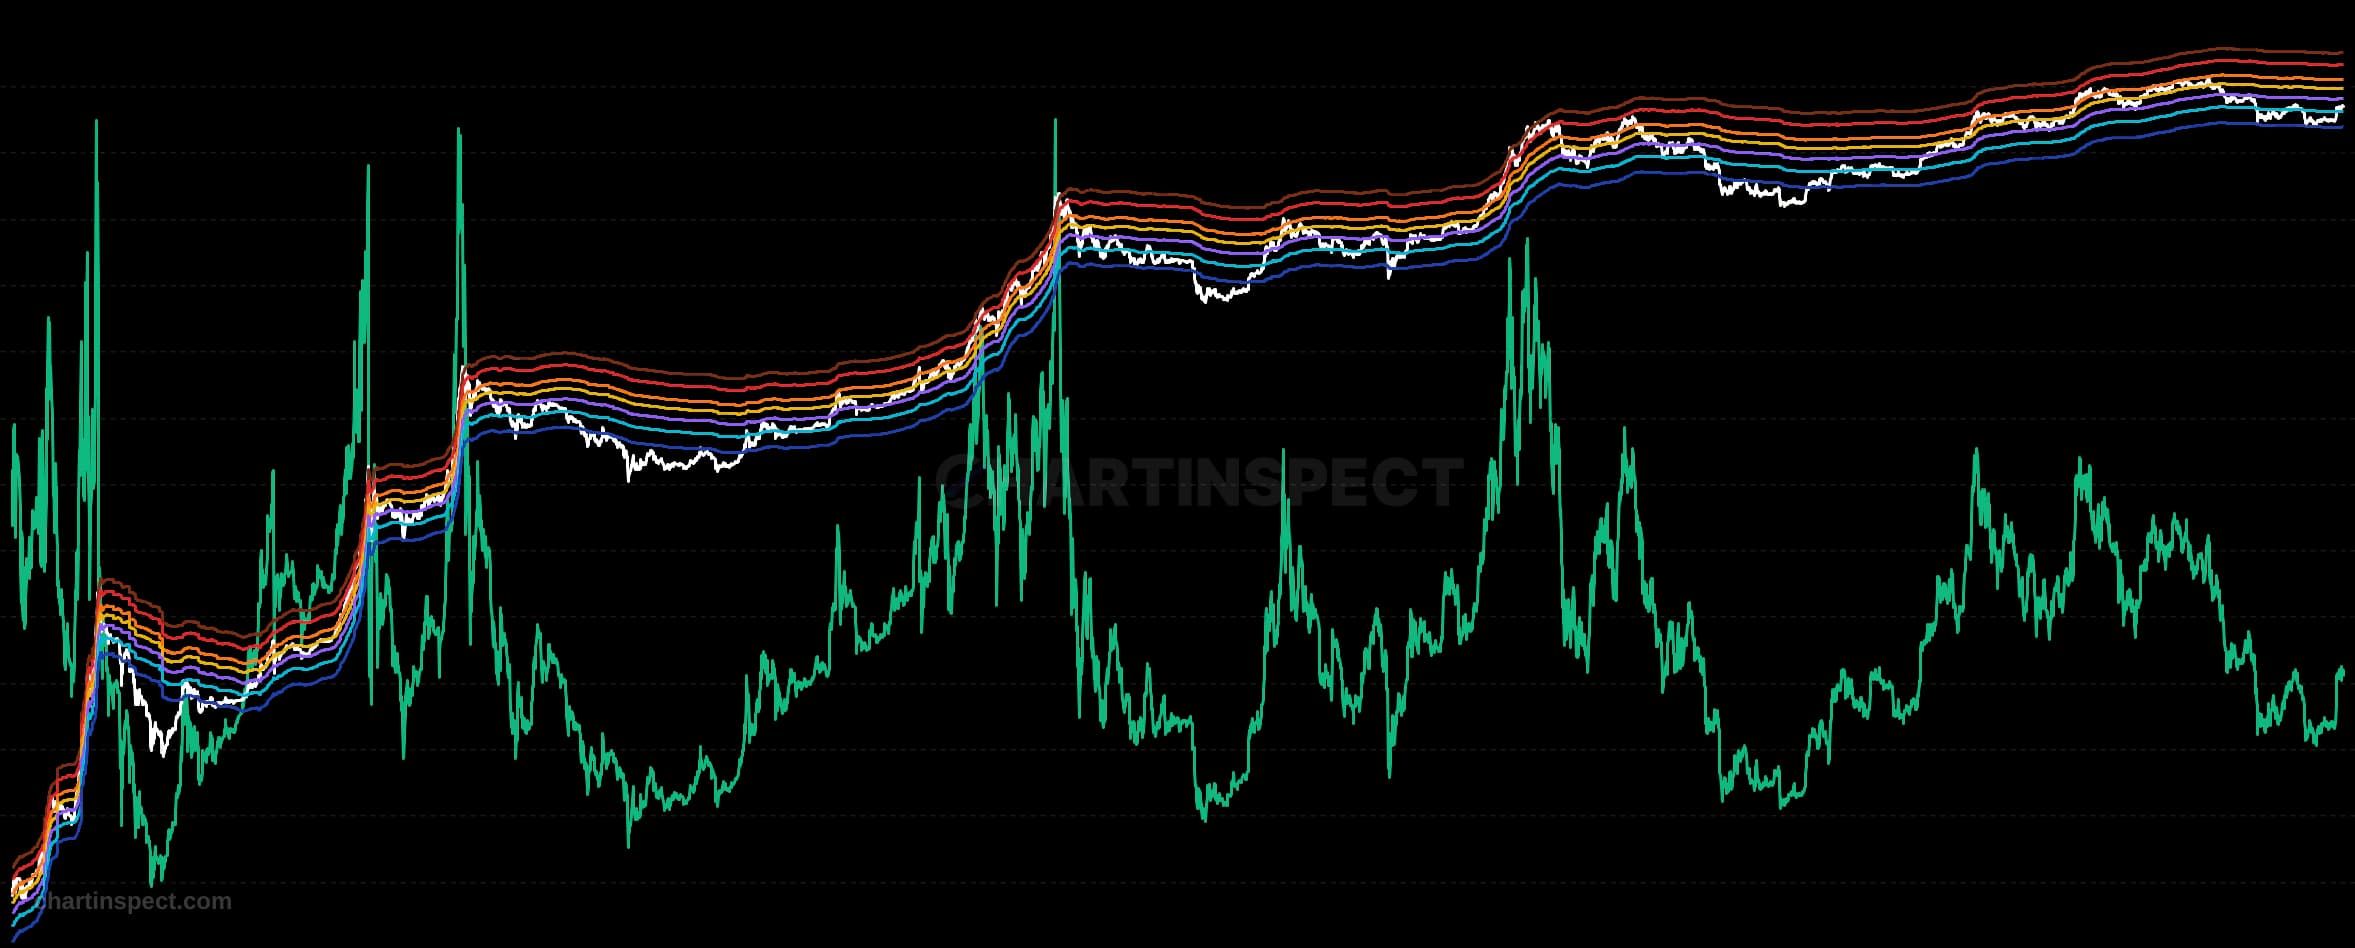
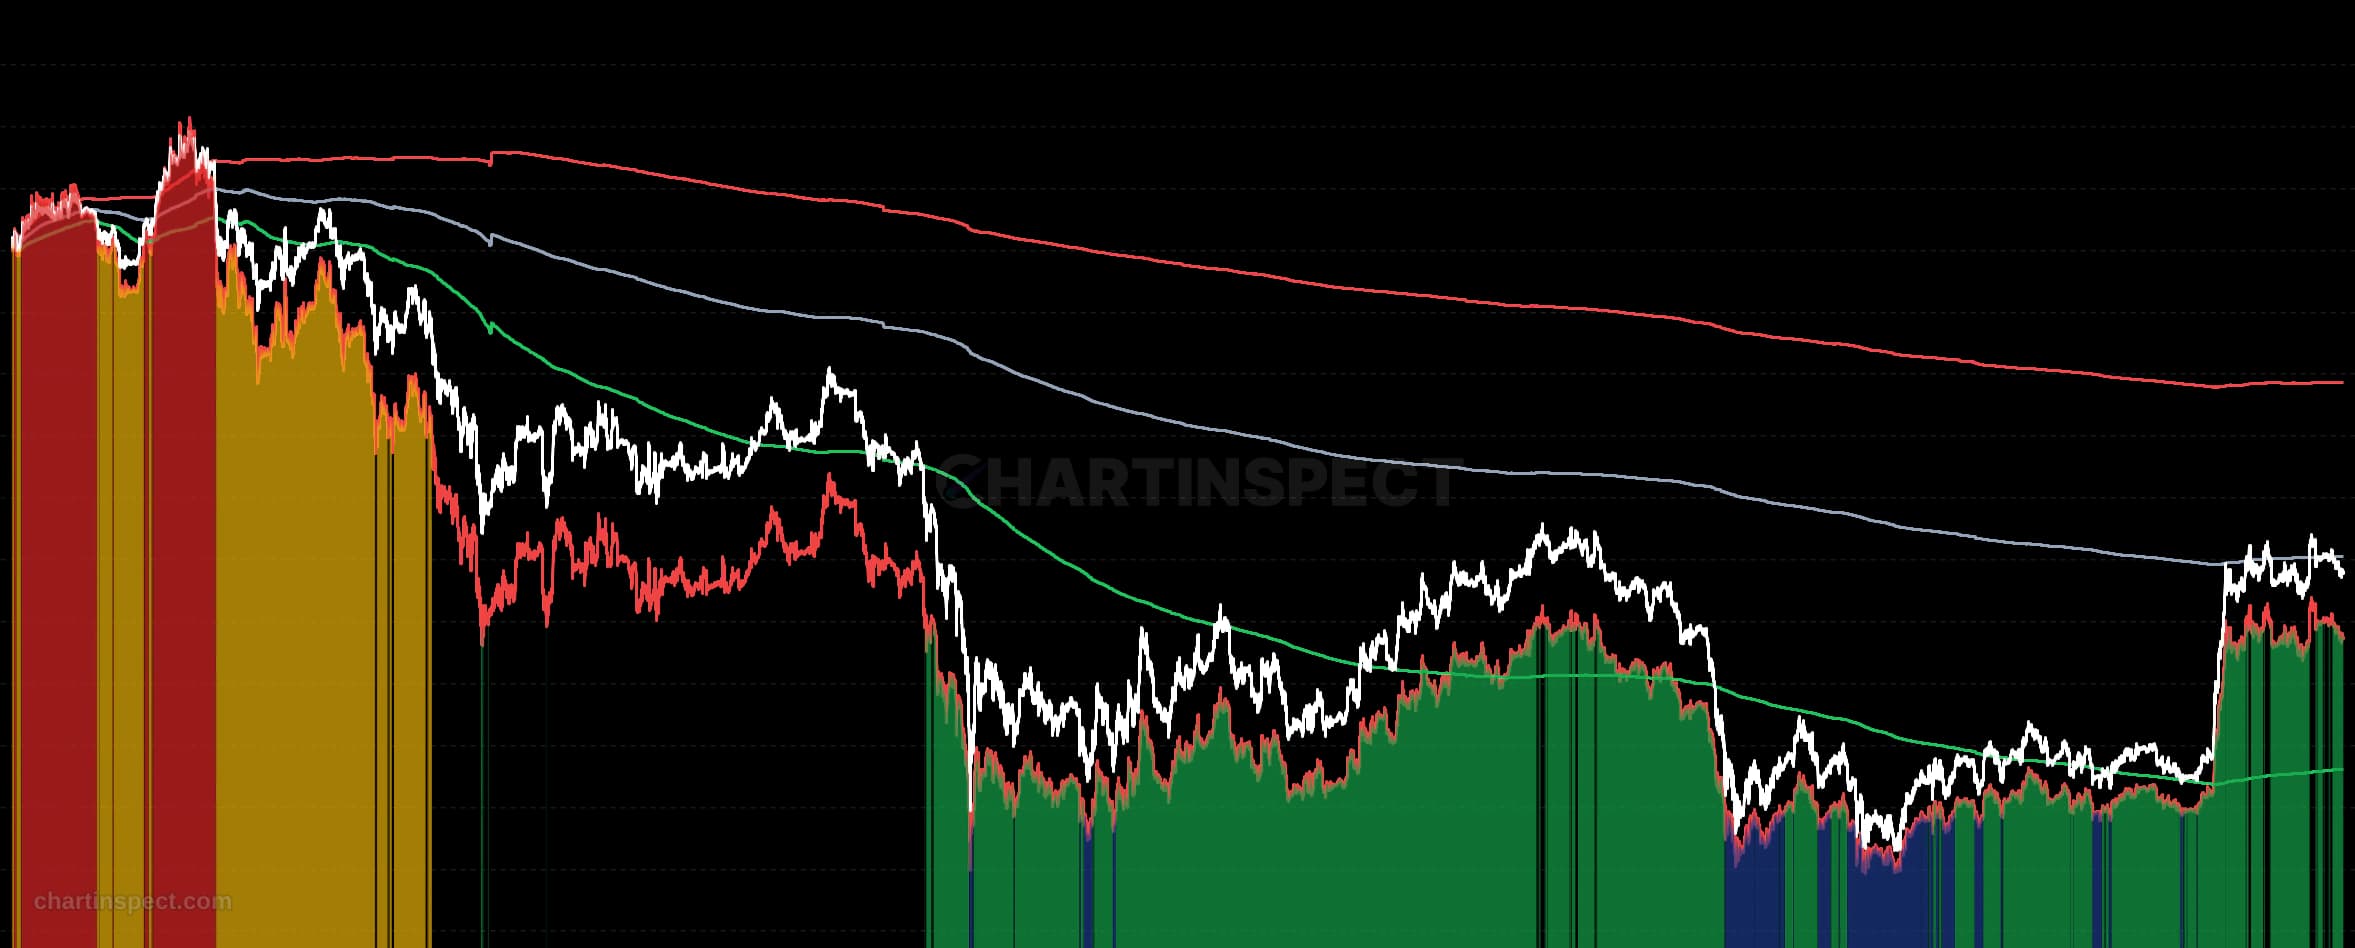
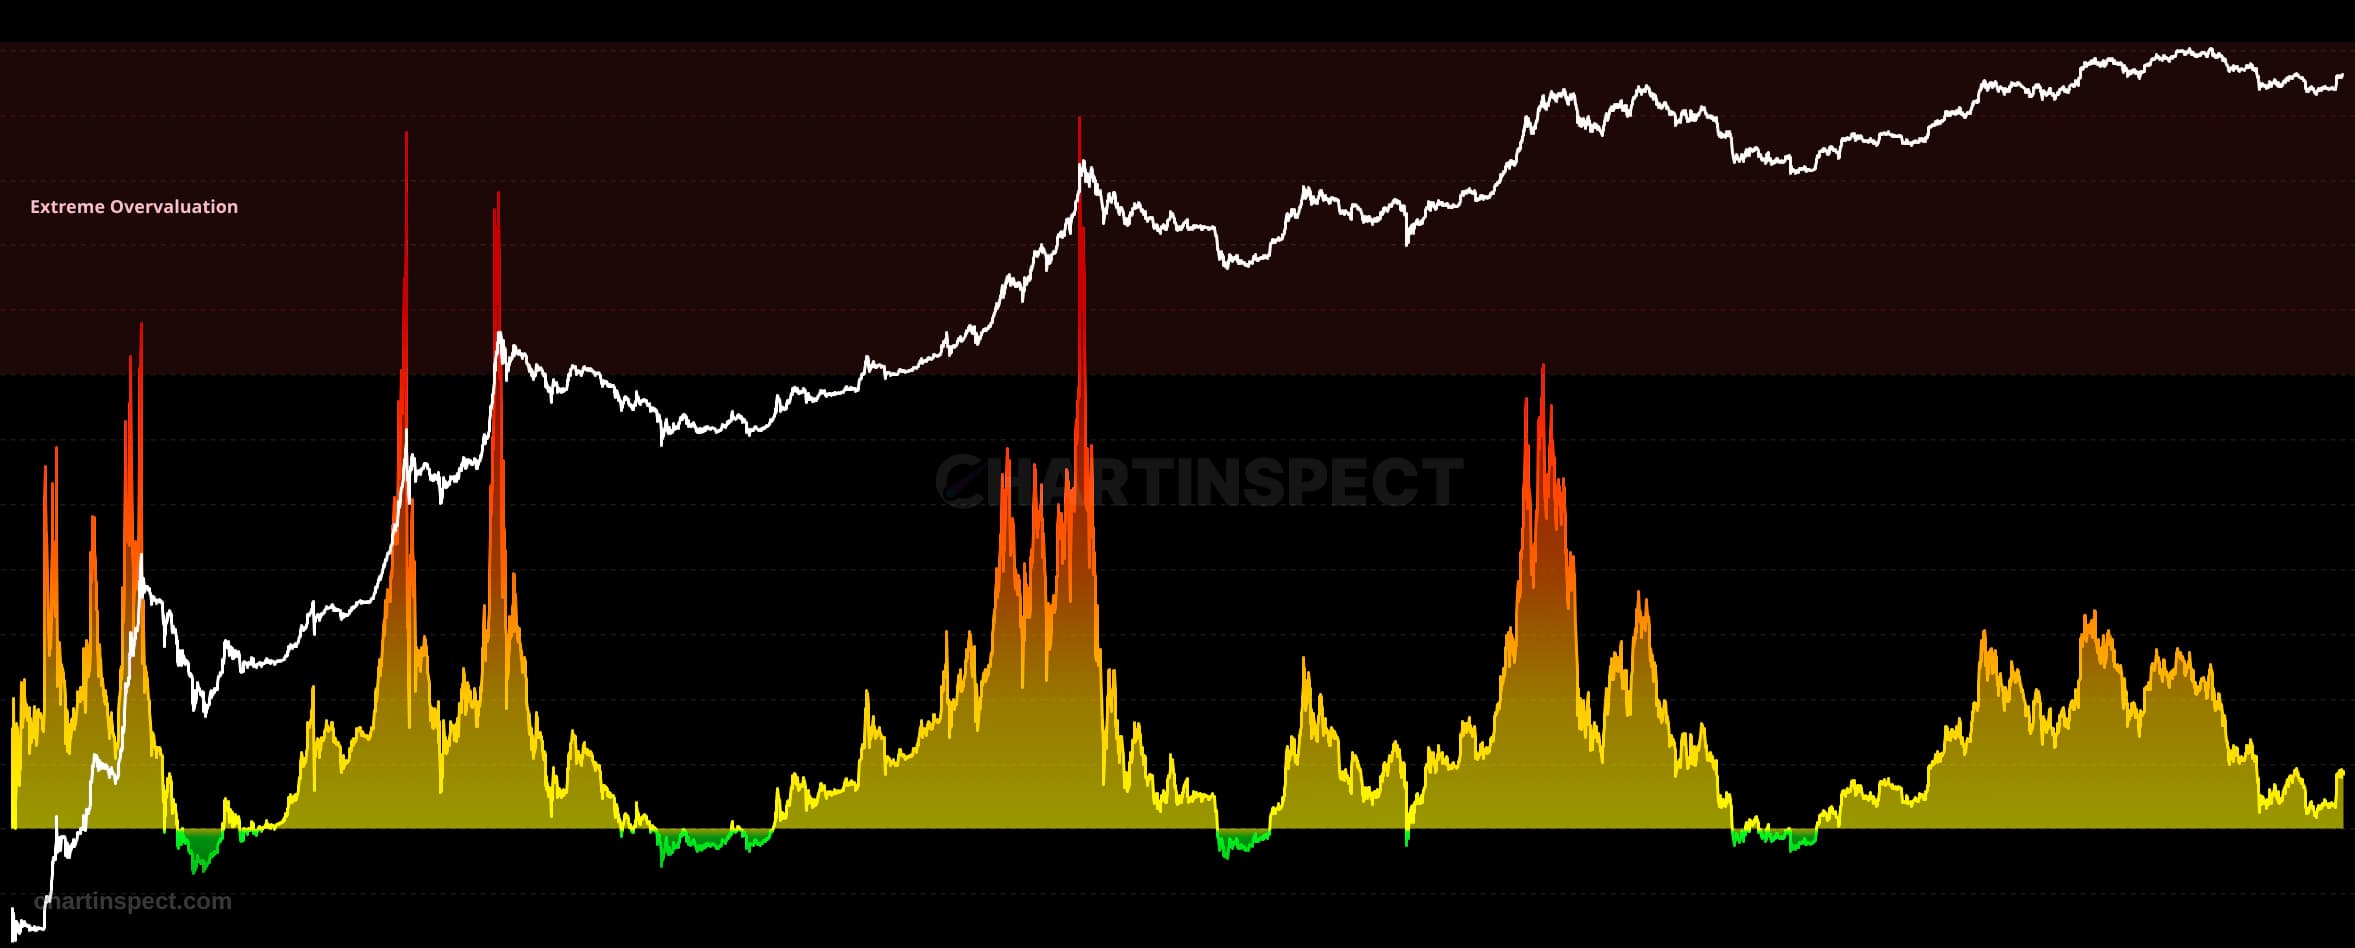
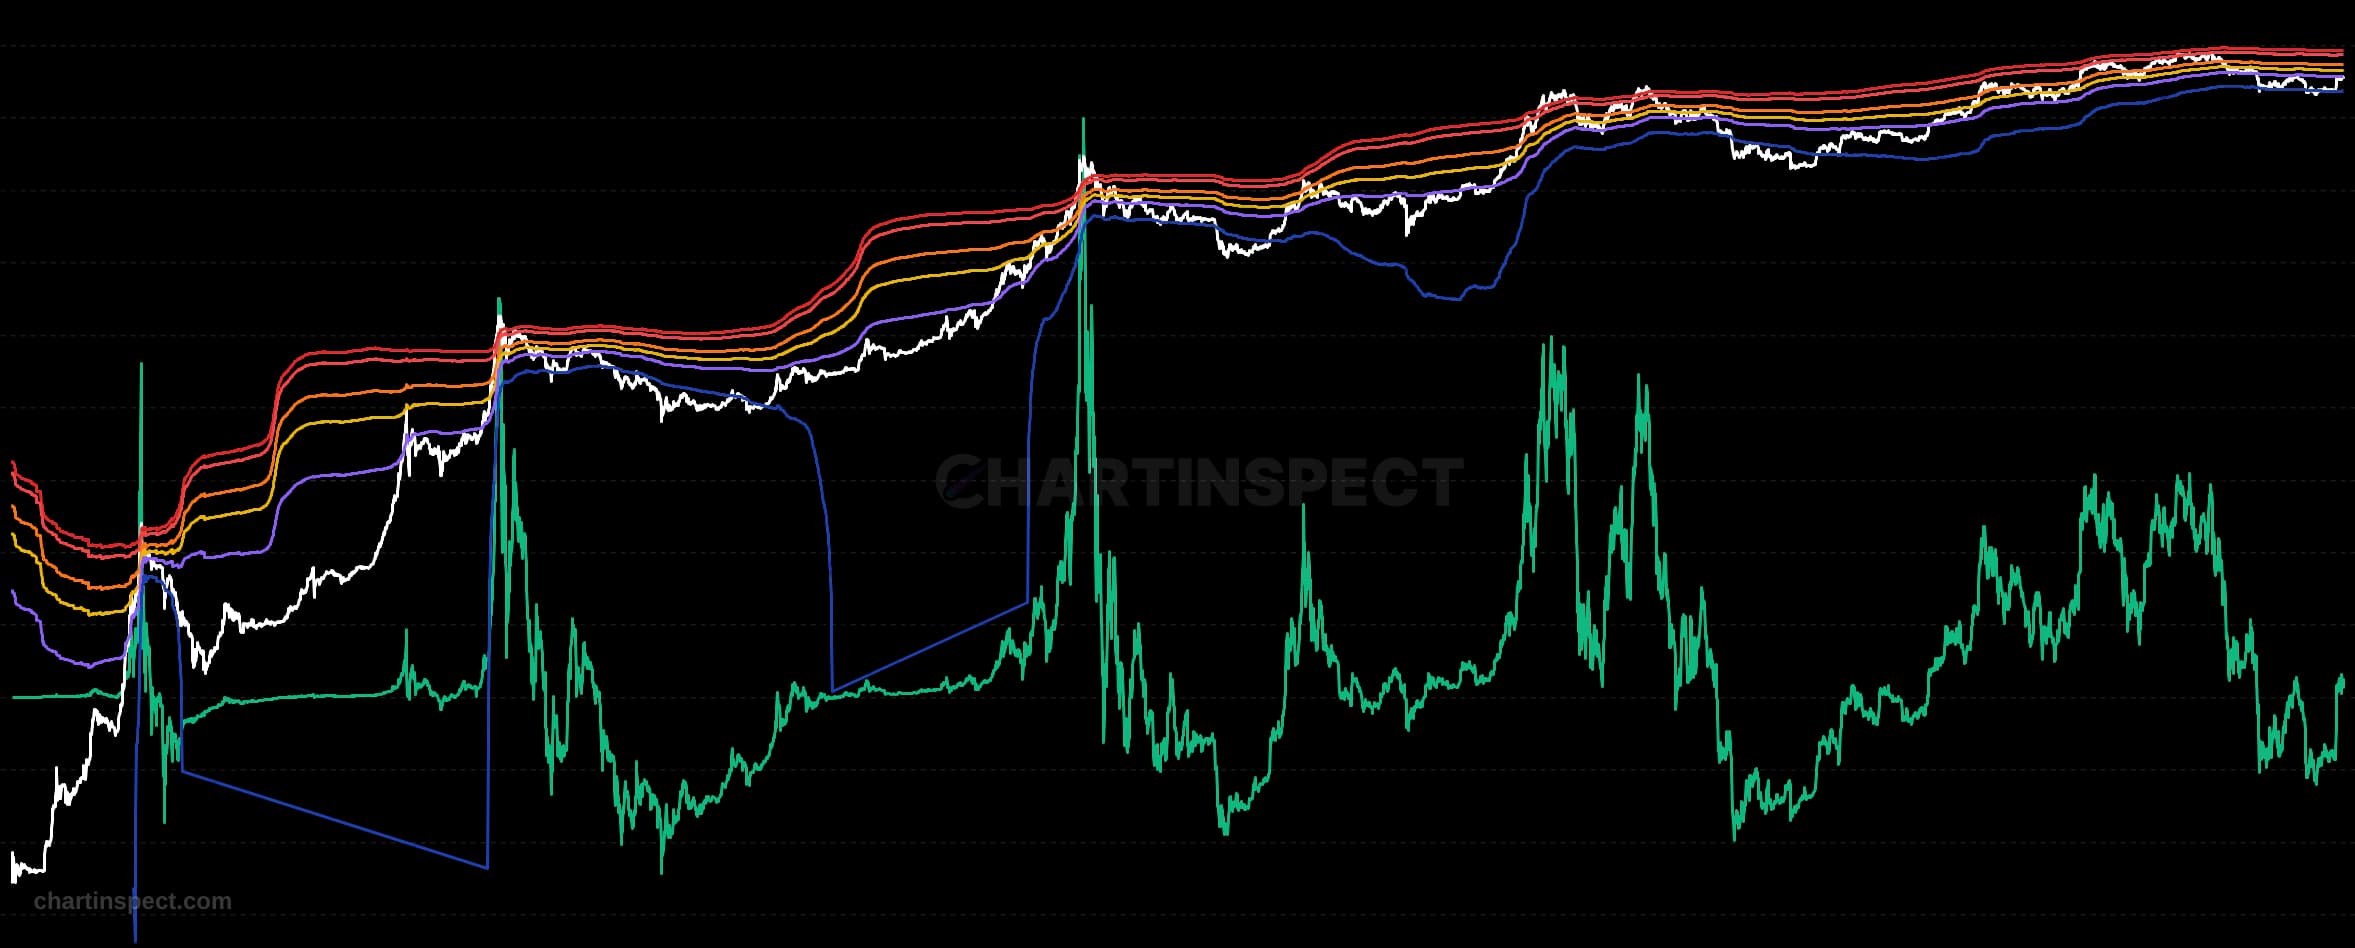
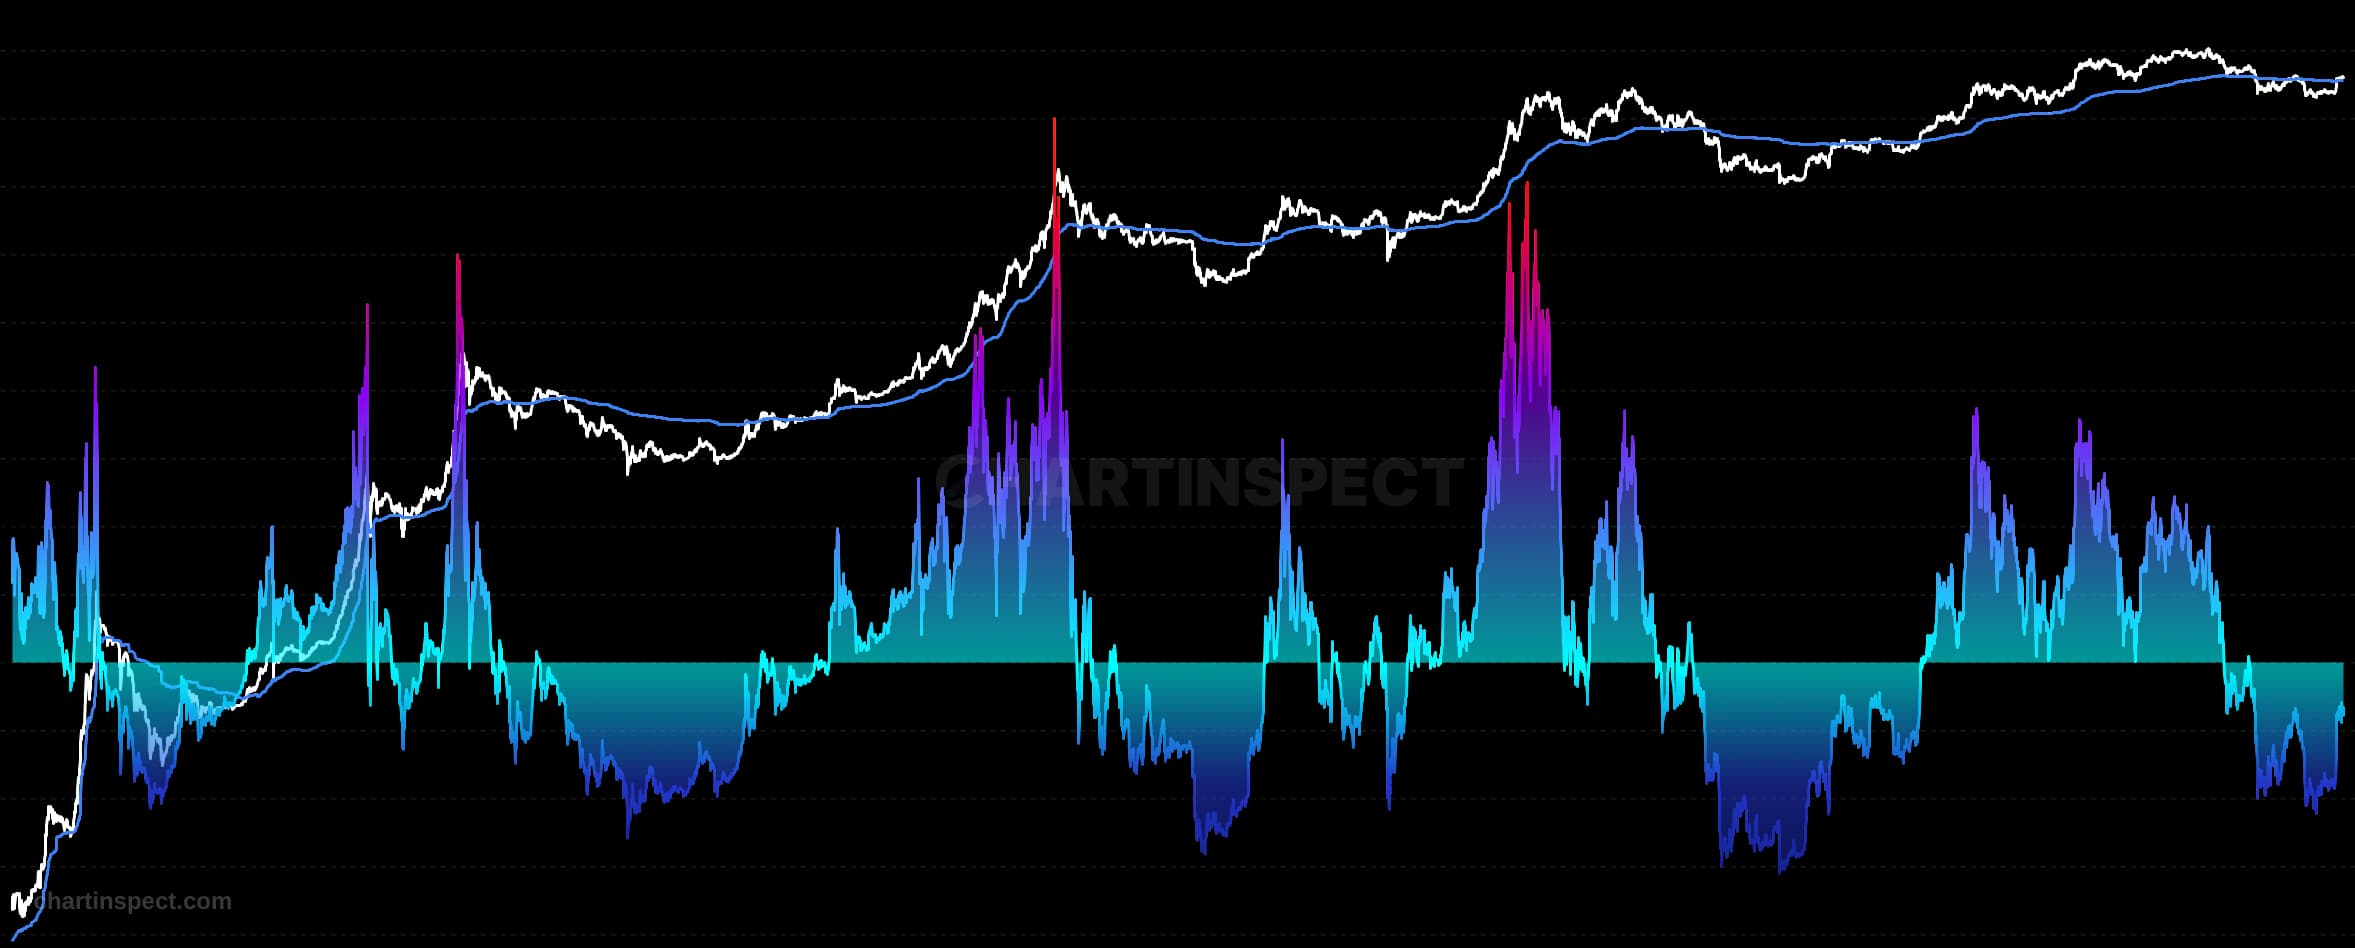
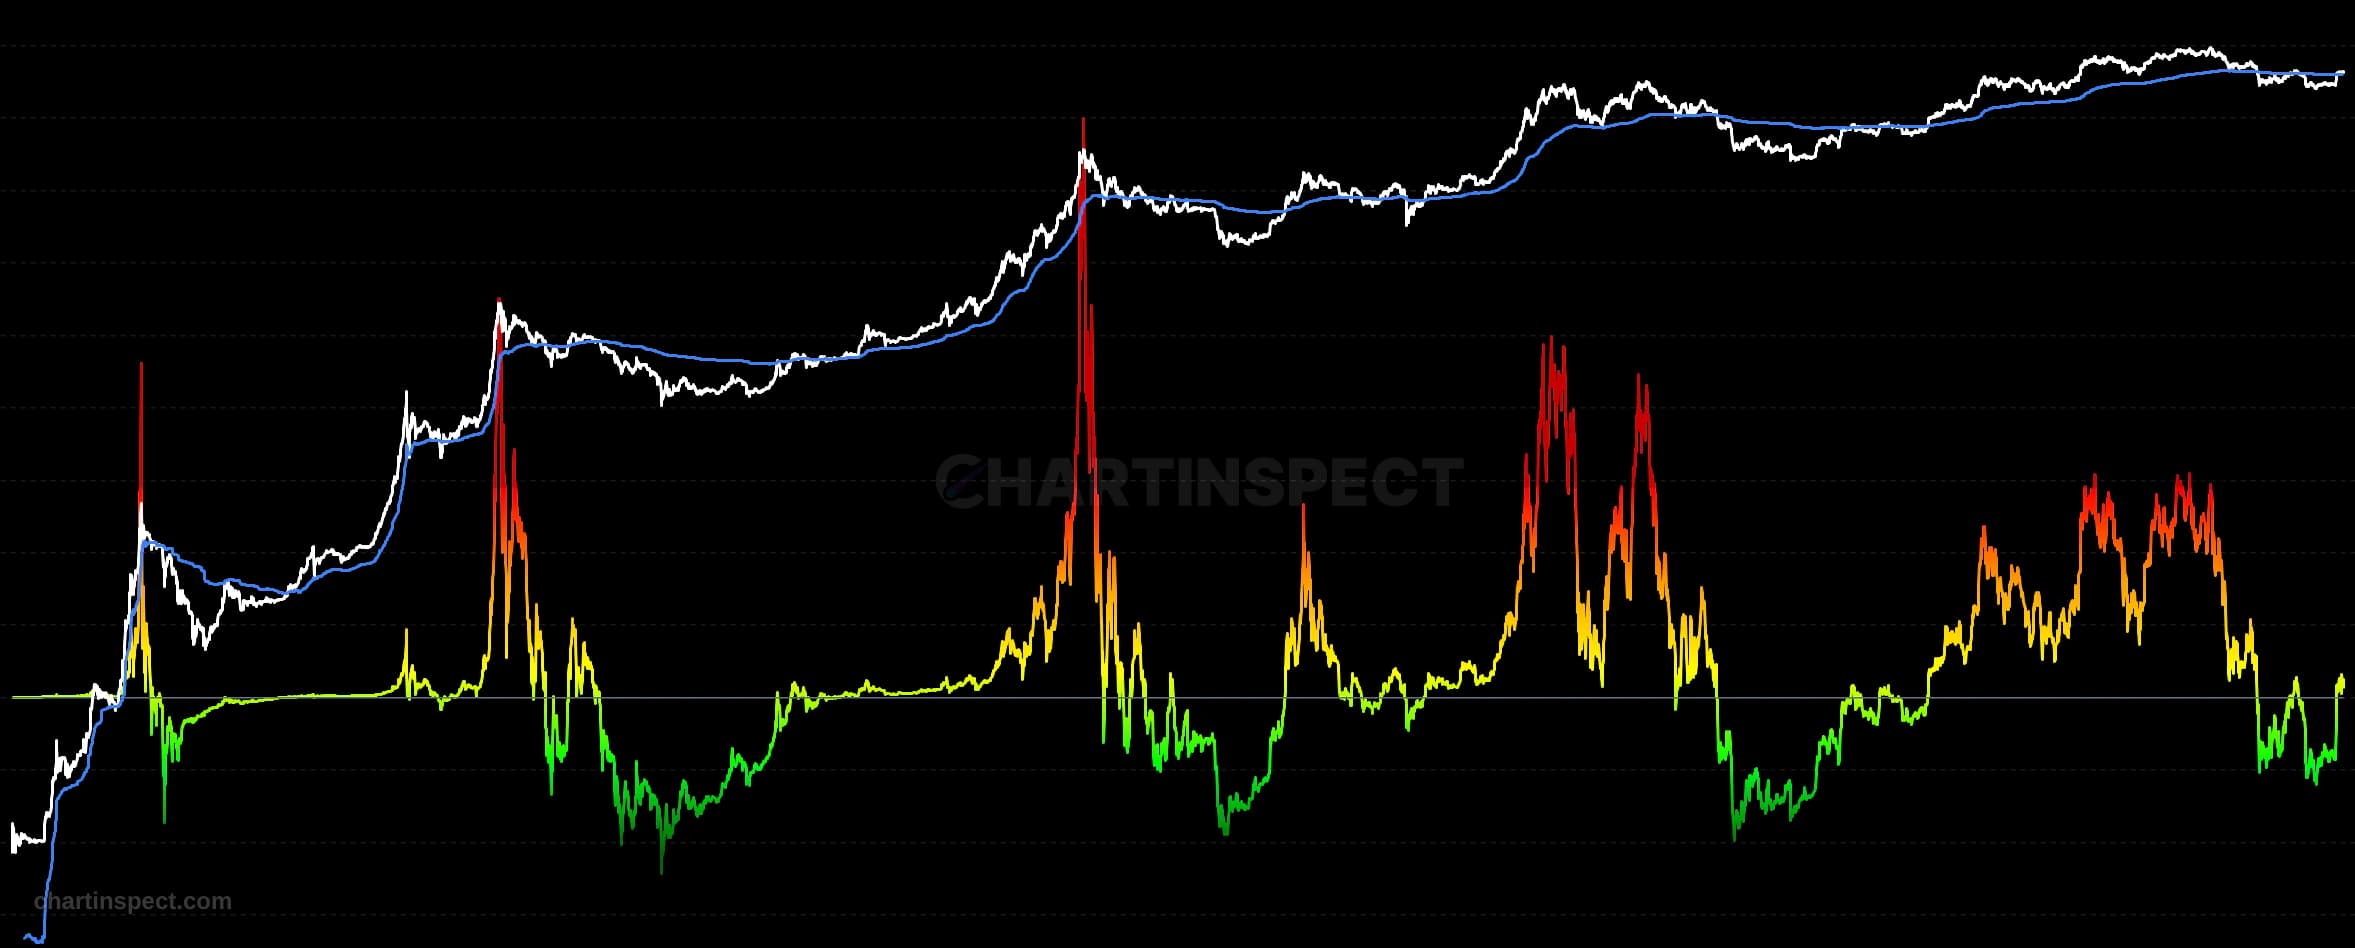
Visualize Bitcoin price overlaid with statistical bands derived from the MVRV (Market Value to Realized Value) ratio to identify extreme market conditions and potential reversal zones based on historical MVRV deviations
Check the selected asset, units, and cohort before comparing readings. Compare the metric over consistent dates and use related measures to understand what contributes to a change.
Addresses and on-chain cohorts do not identify individual people. Network designs and available histories differ, so a threshold observed on one asset may not transfer to another.
Visualize Bitcoin price overlaid with statistical bands derived from the MVRV (Market Value to Realized Value) ratio to identify extreme market conditions and potential reversal zones based on historical MVRV deviations
Freshness: Not yet verified
No community calls on MVRV Bands yet. Be the first to share a take.
Discover more insights with our comprehensive chart collection
Explore All 10240 Charts