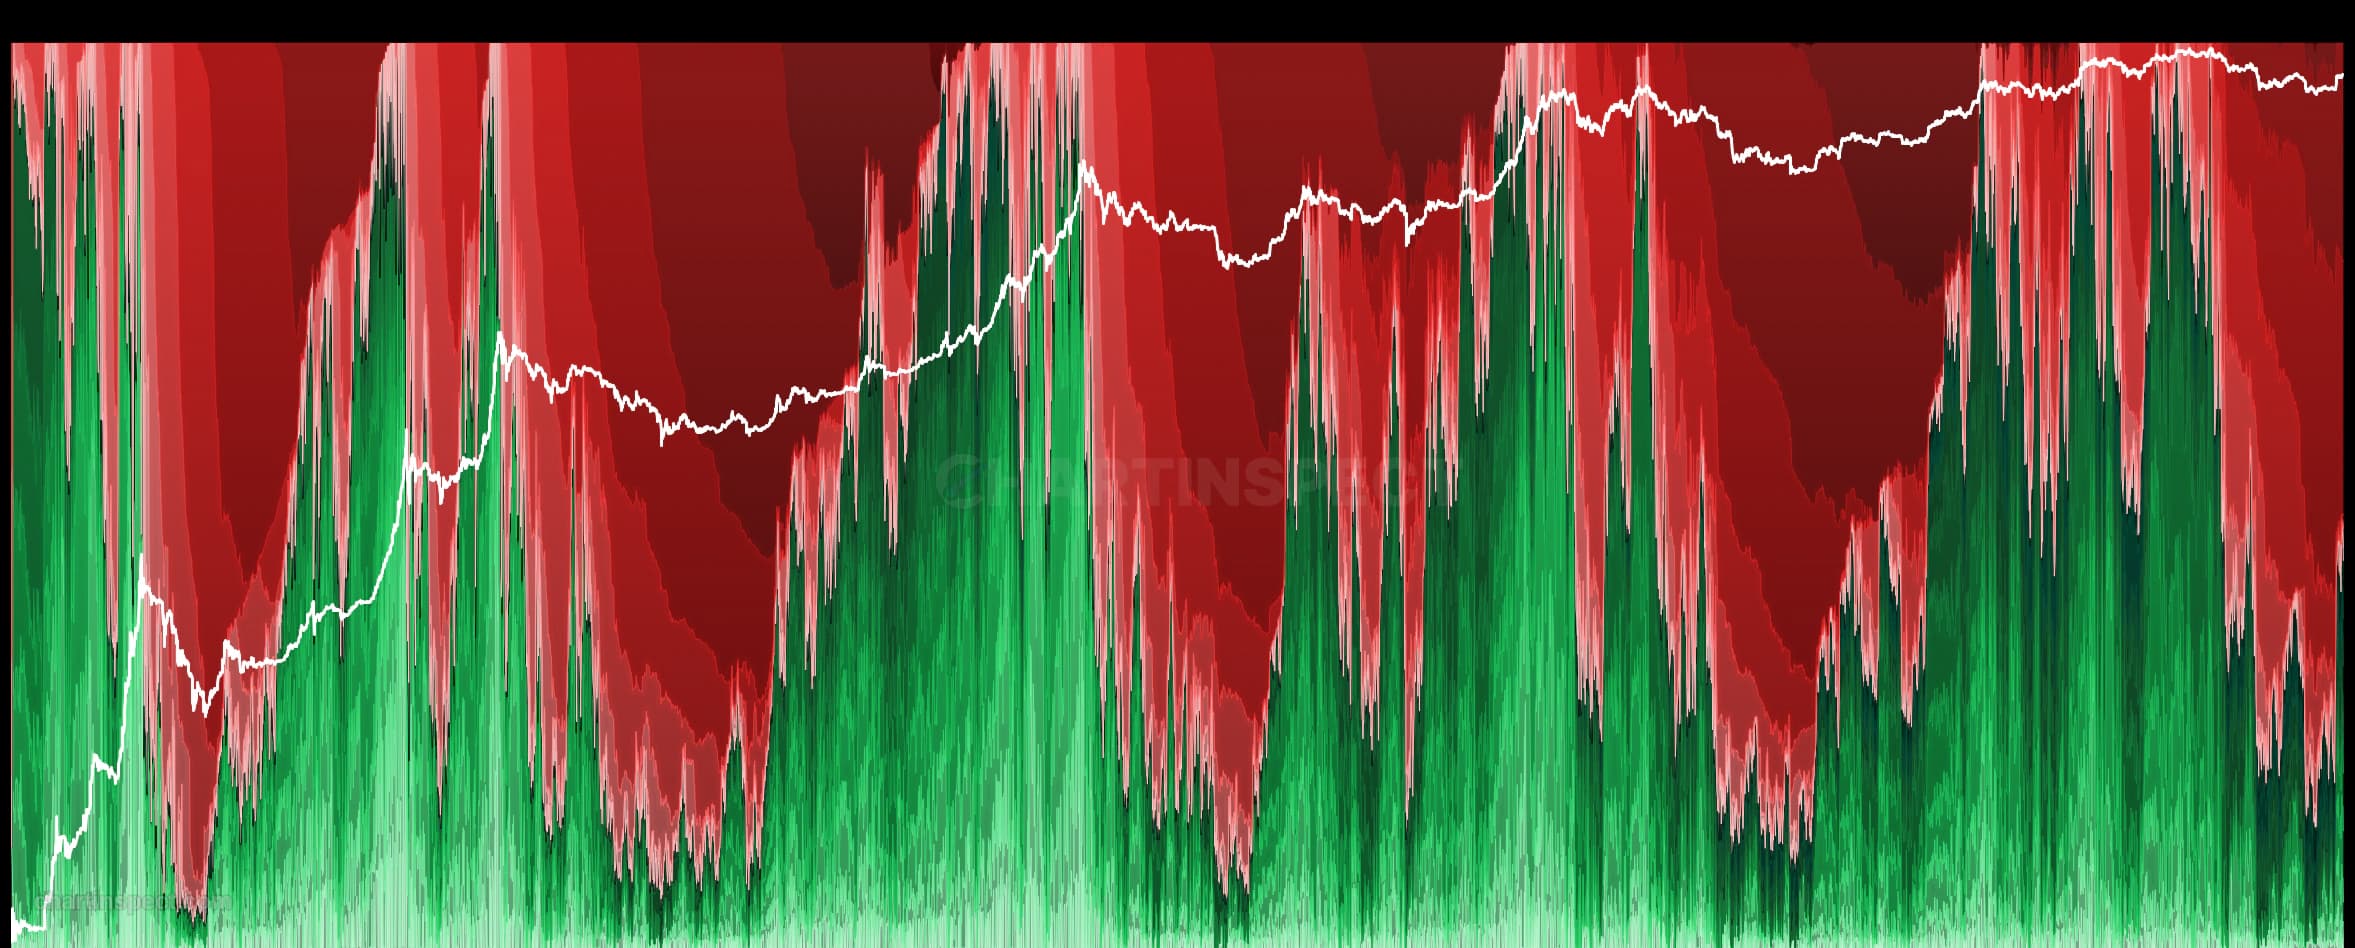
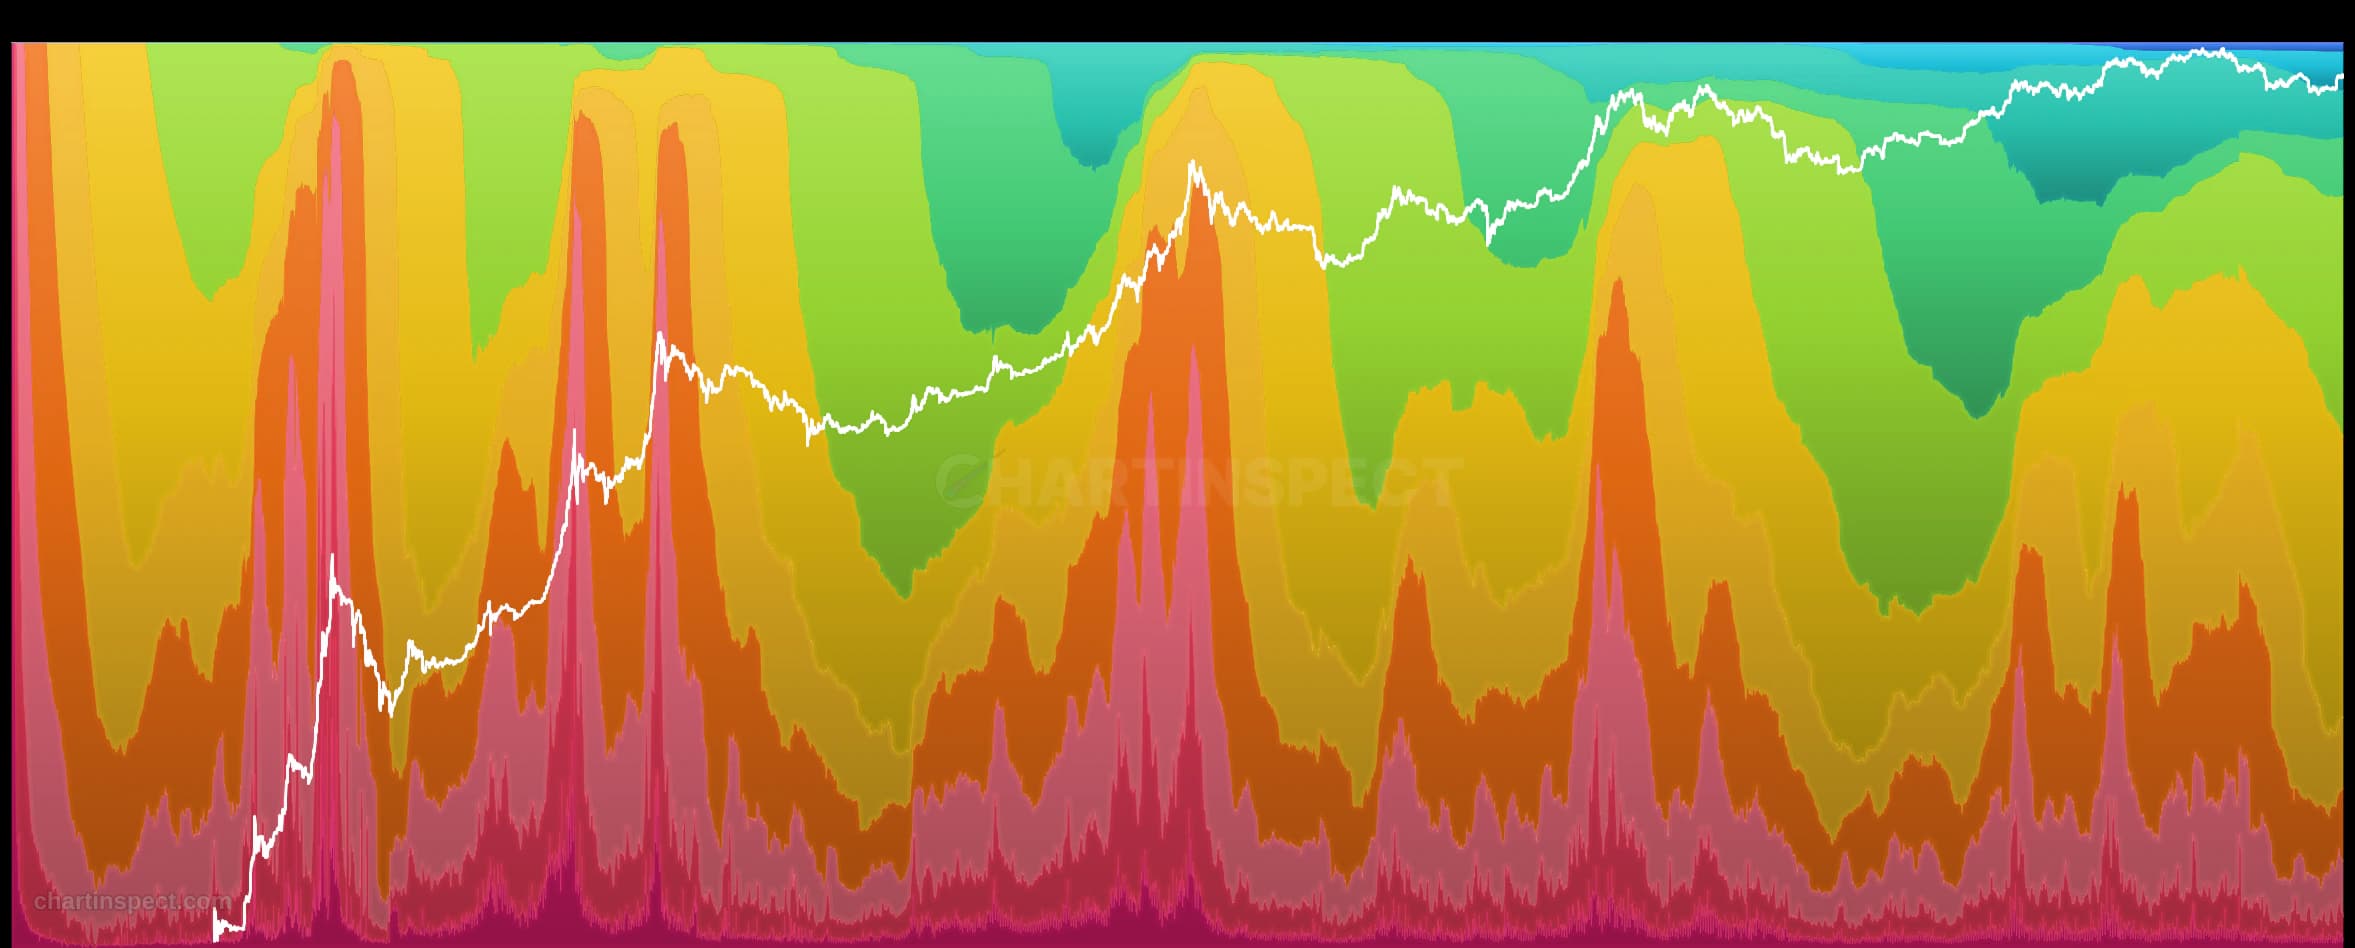
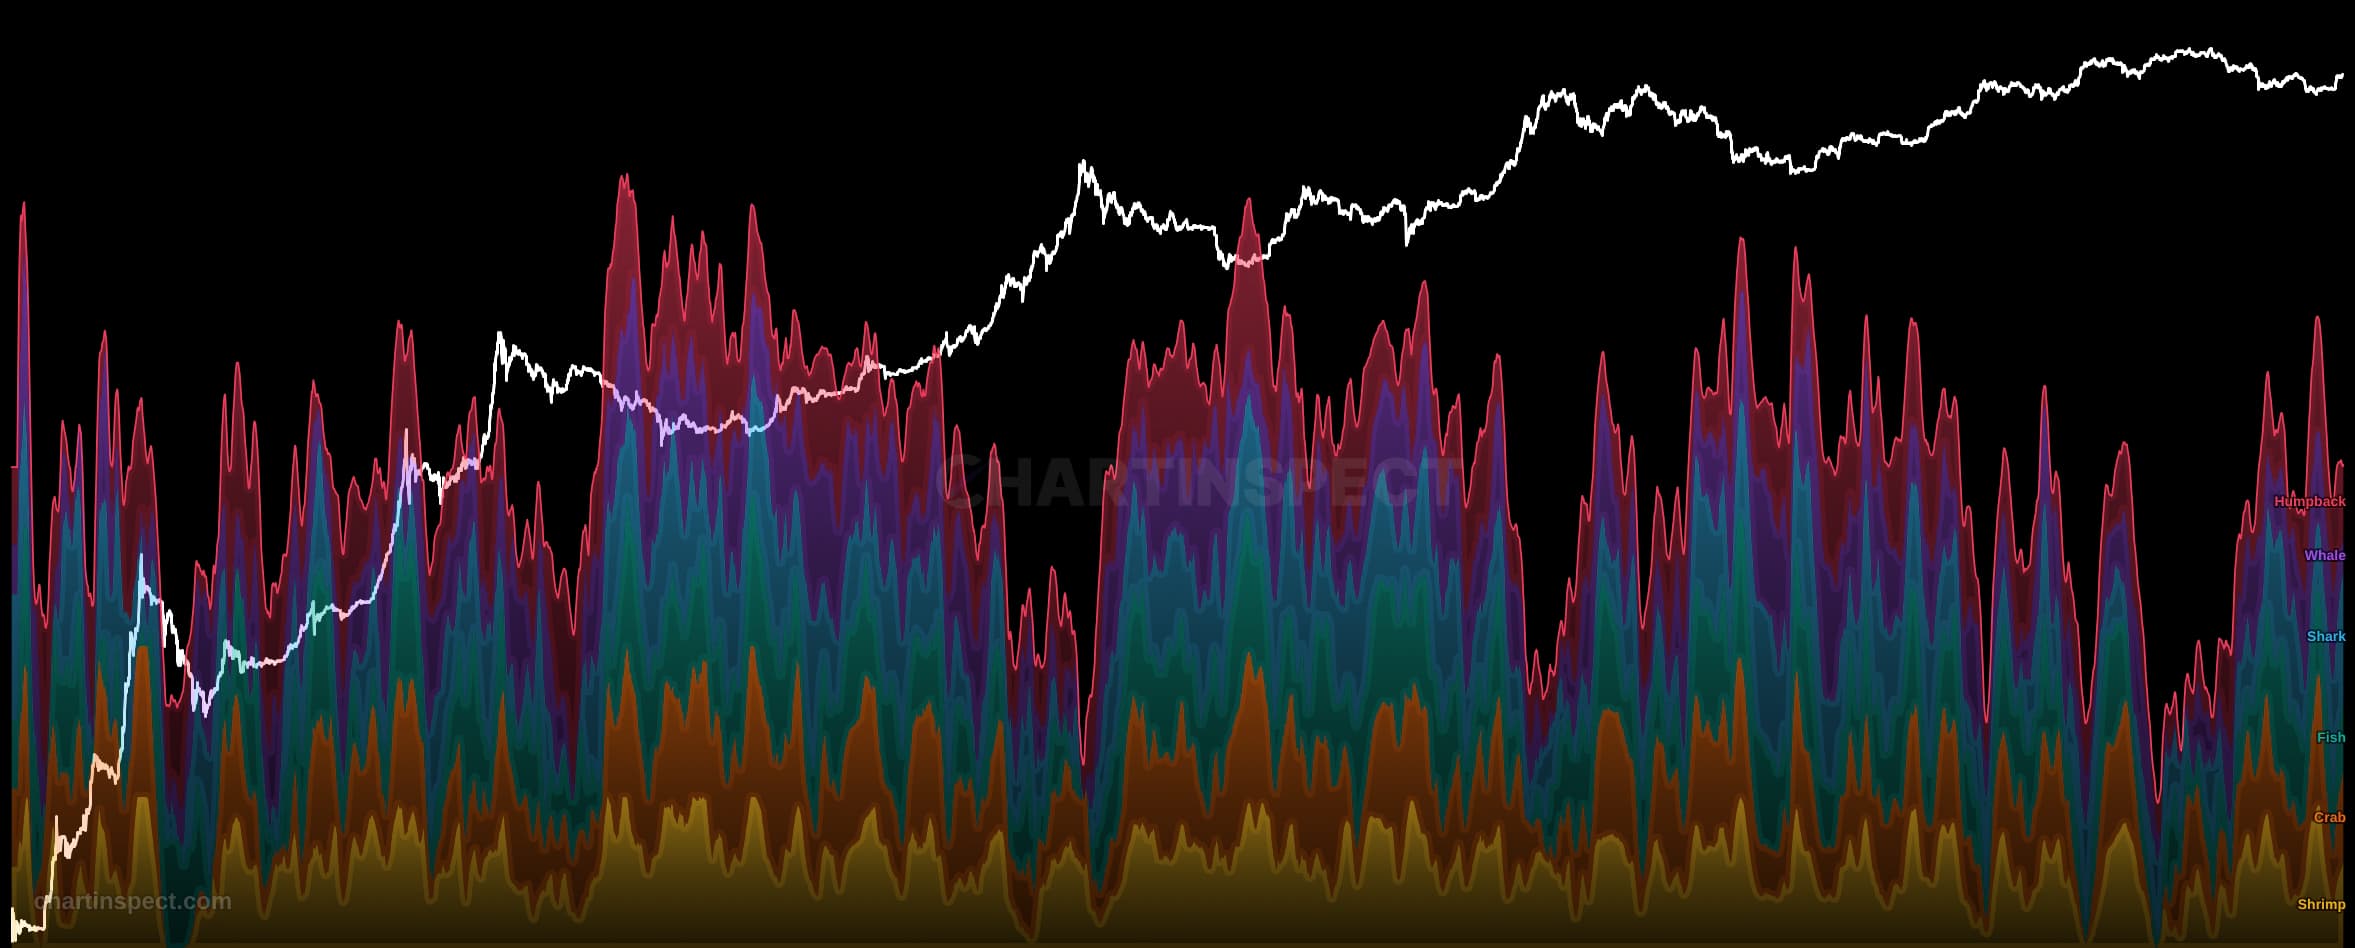
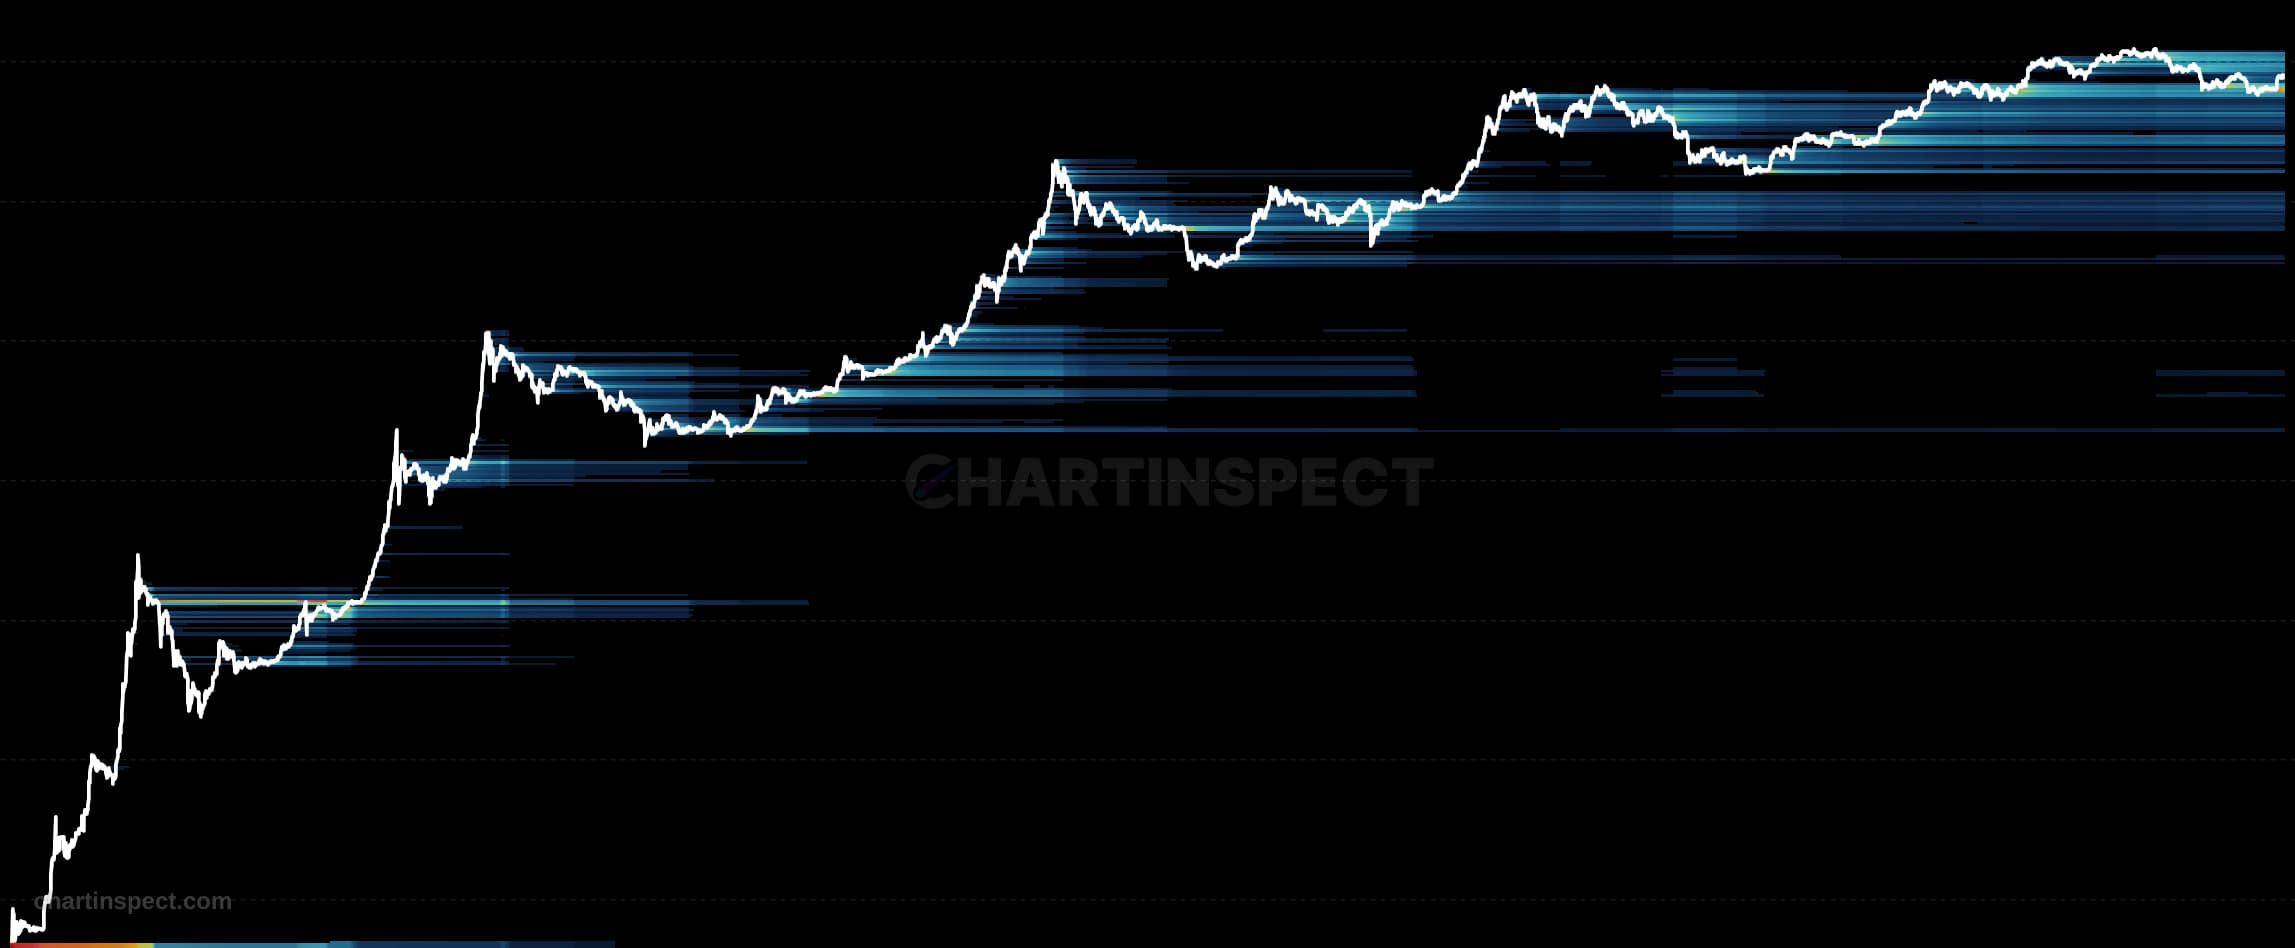
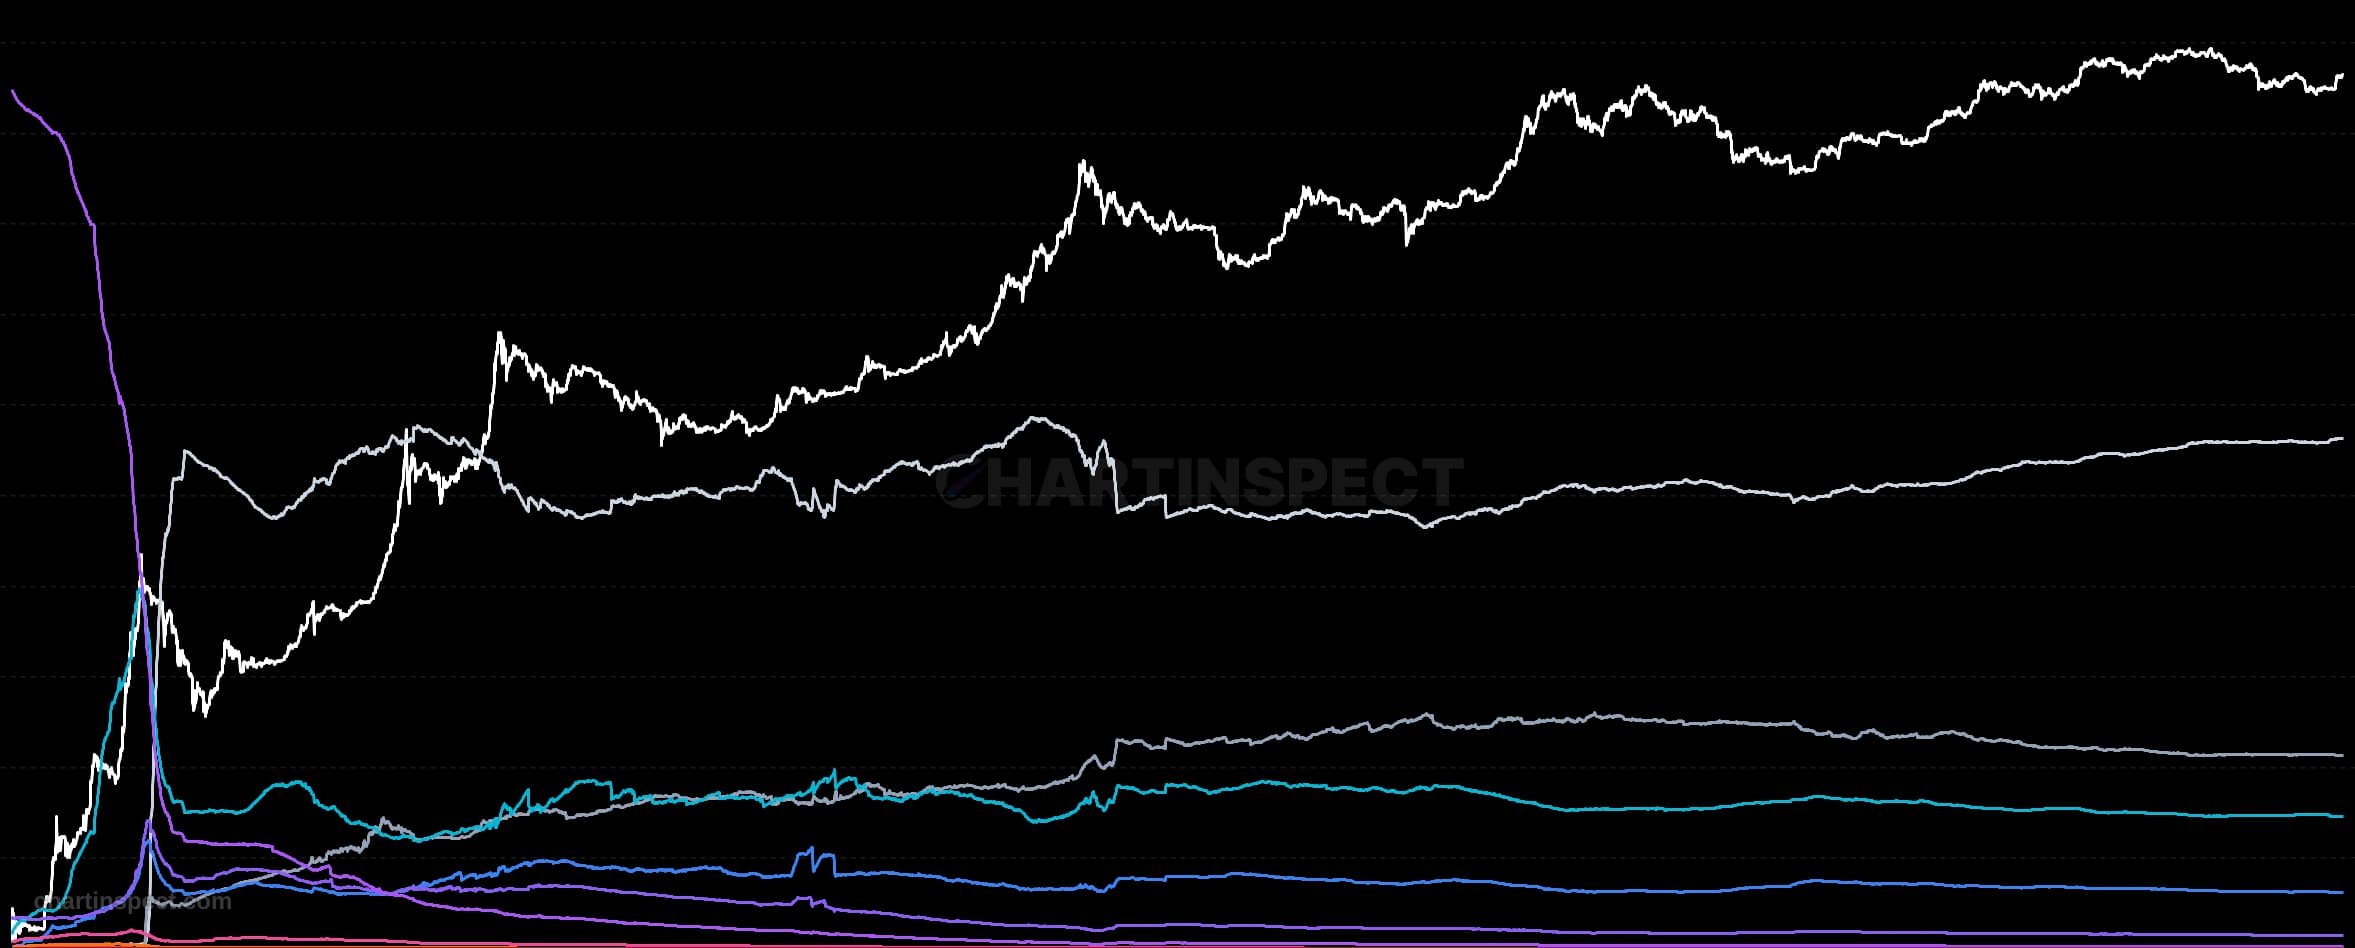
Bitcoin HODL Waves in Profit/Loss takes the standard HODL waves framework, which buckets the entire Bitcoin supply into age cohorts based on when each coin last moved on-chain, and splits every cohort by profitability. For each age band, the chart compares the price at which those coins last moved to the current Bitcoin price, then reports what percentage of that cohort is held in profit versus at a loss. The result decomposes supply not just by how long it has been dormant, but by whether that dormant supply is sitting on unrealized gains or trapped underwater.
Read the chart as a stack of age cohorts, each divided into a profit portion and a loss portion. When the older, long-dormant bands are overwhelmingly in profit, seasoned holders are sitting on gains and have little pressure to capitulate. When those same old bands tip into loss, it signals that even long-term holders who accumulated at higher prices are now underwater, a condition that typically only appears deep in bear markets.
Use it to gauge the conviction behind the supply. Broad profitability across old cohorts reflects a network sitting comfortably on gains, while a spread of long-held Bitcoin moving underwater flags stress among the holders least inclined to sell.
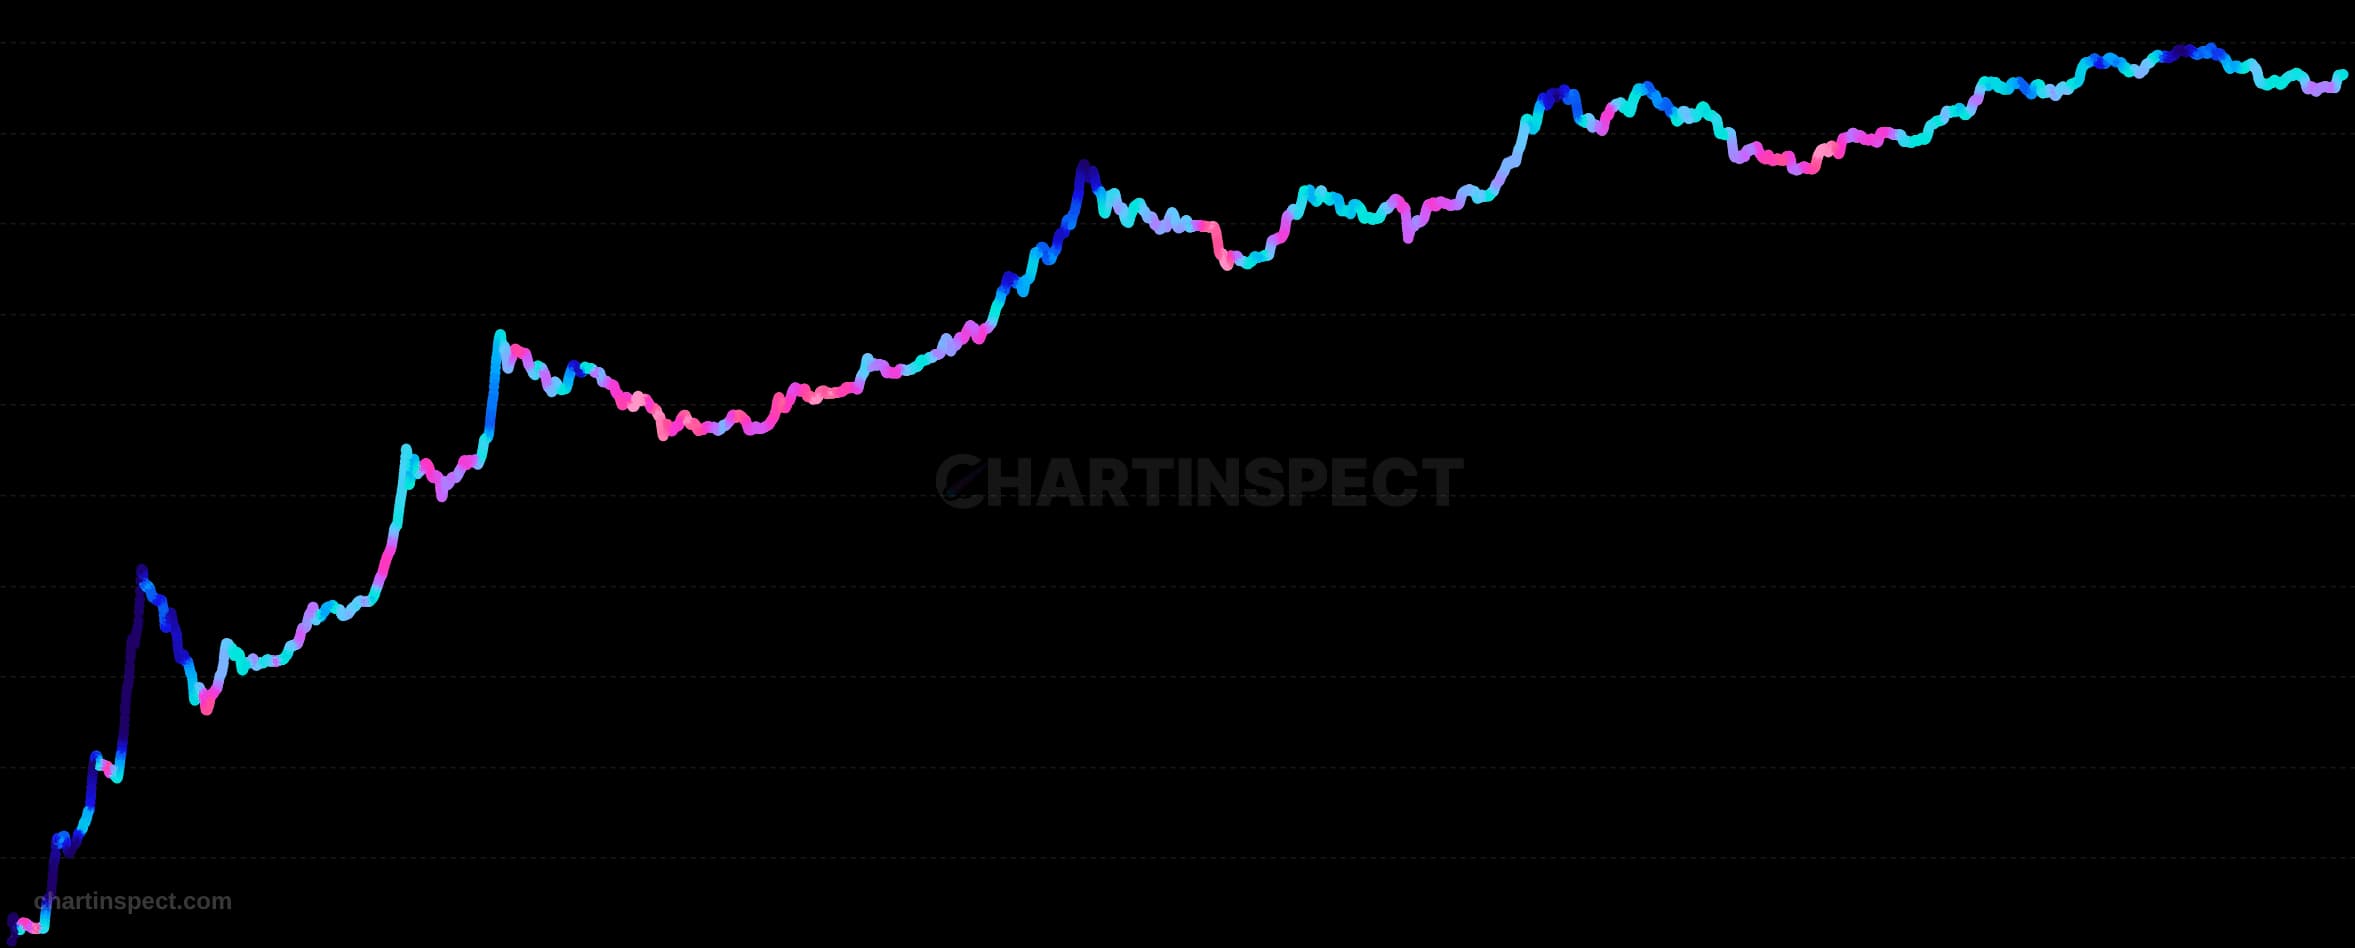
Check the selected asset, units, and cohort before comparing readings. Compare the metric over consistent dates and use related measures to understand what contributes to a change.