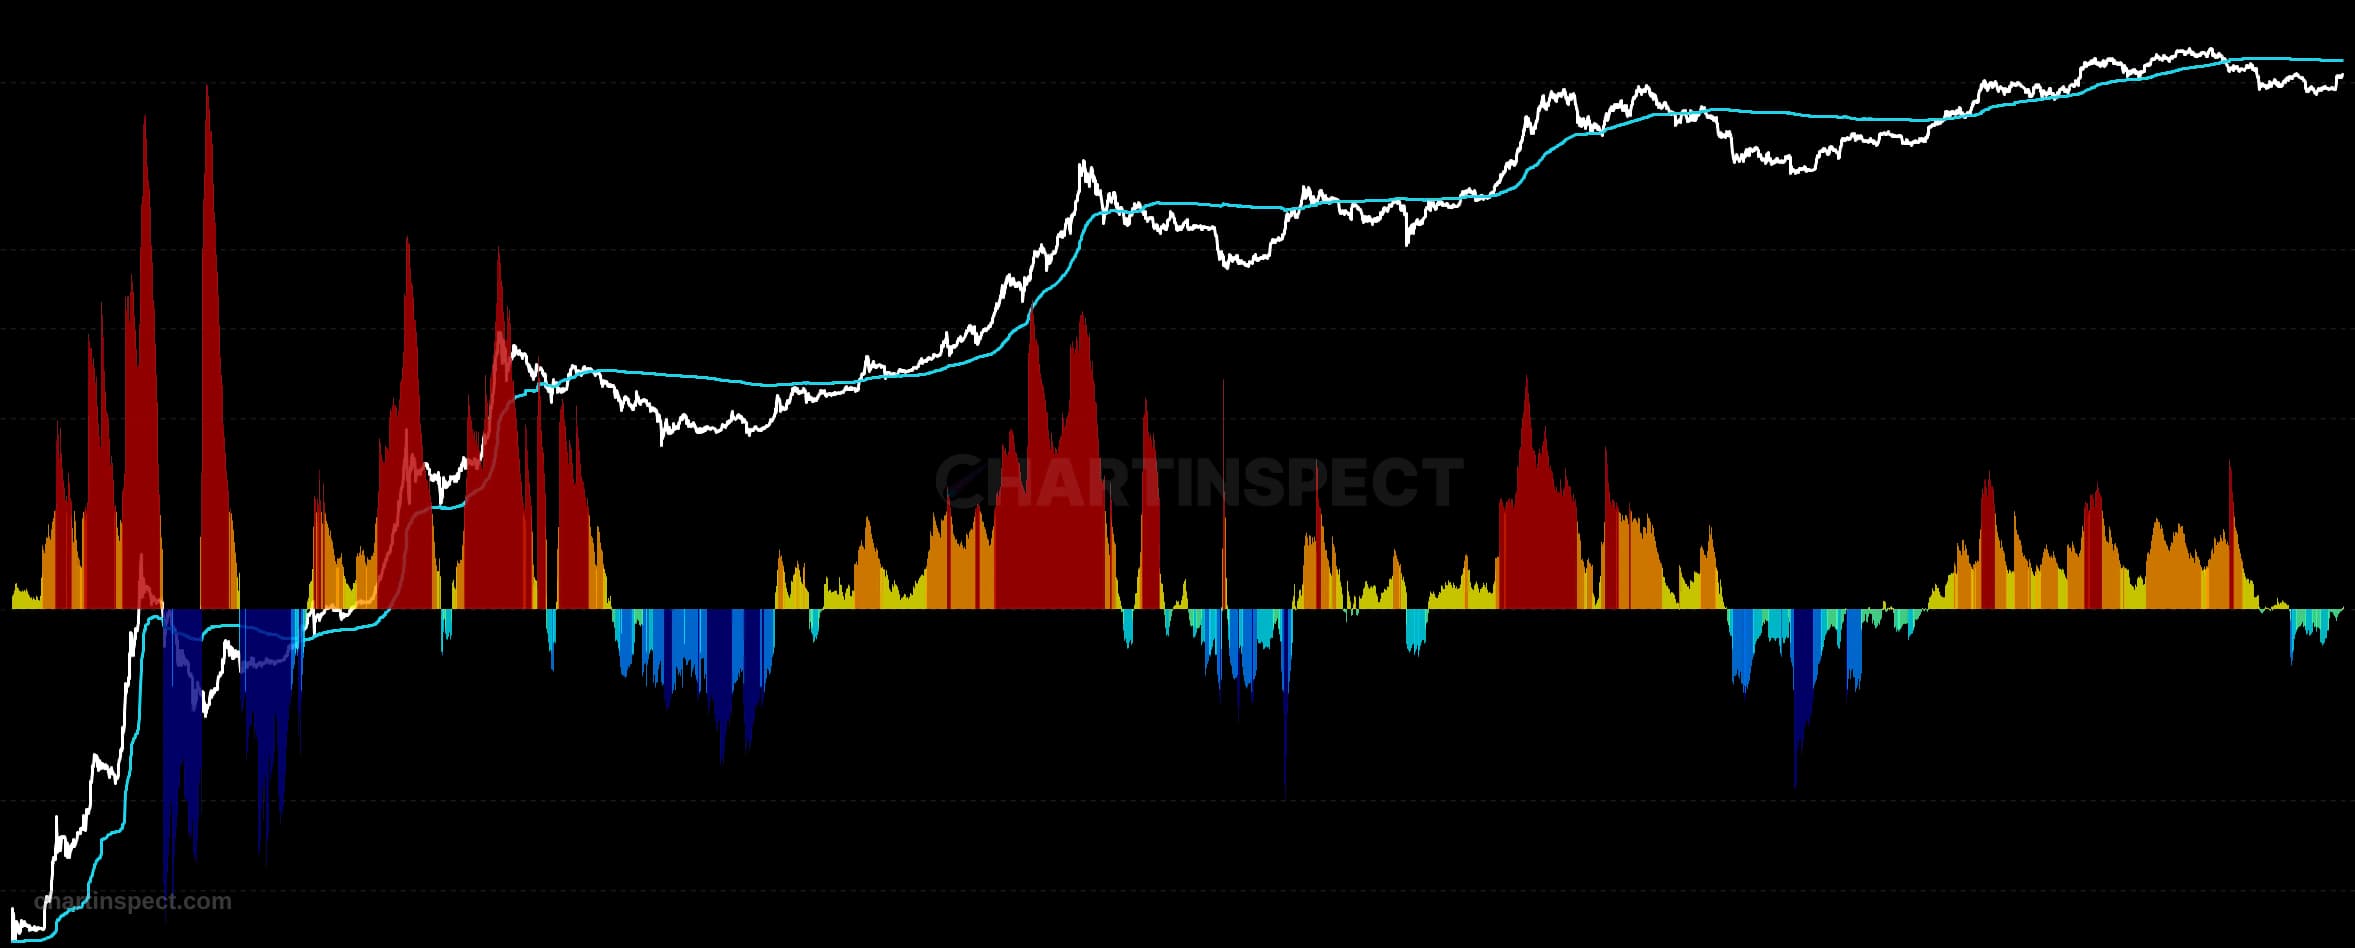
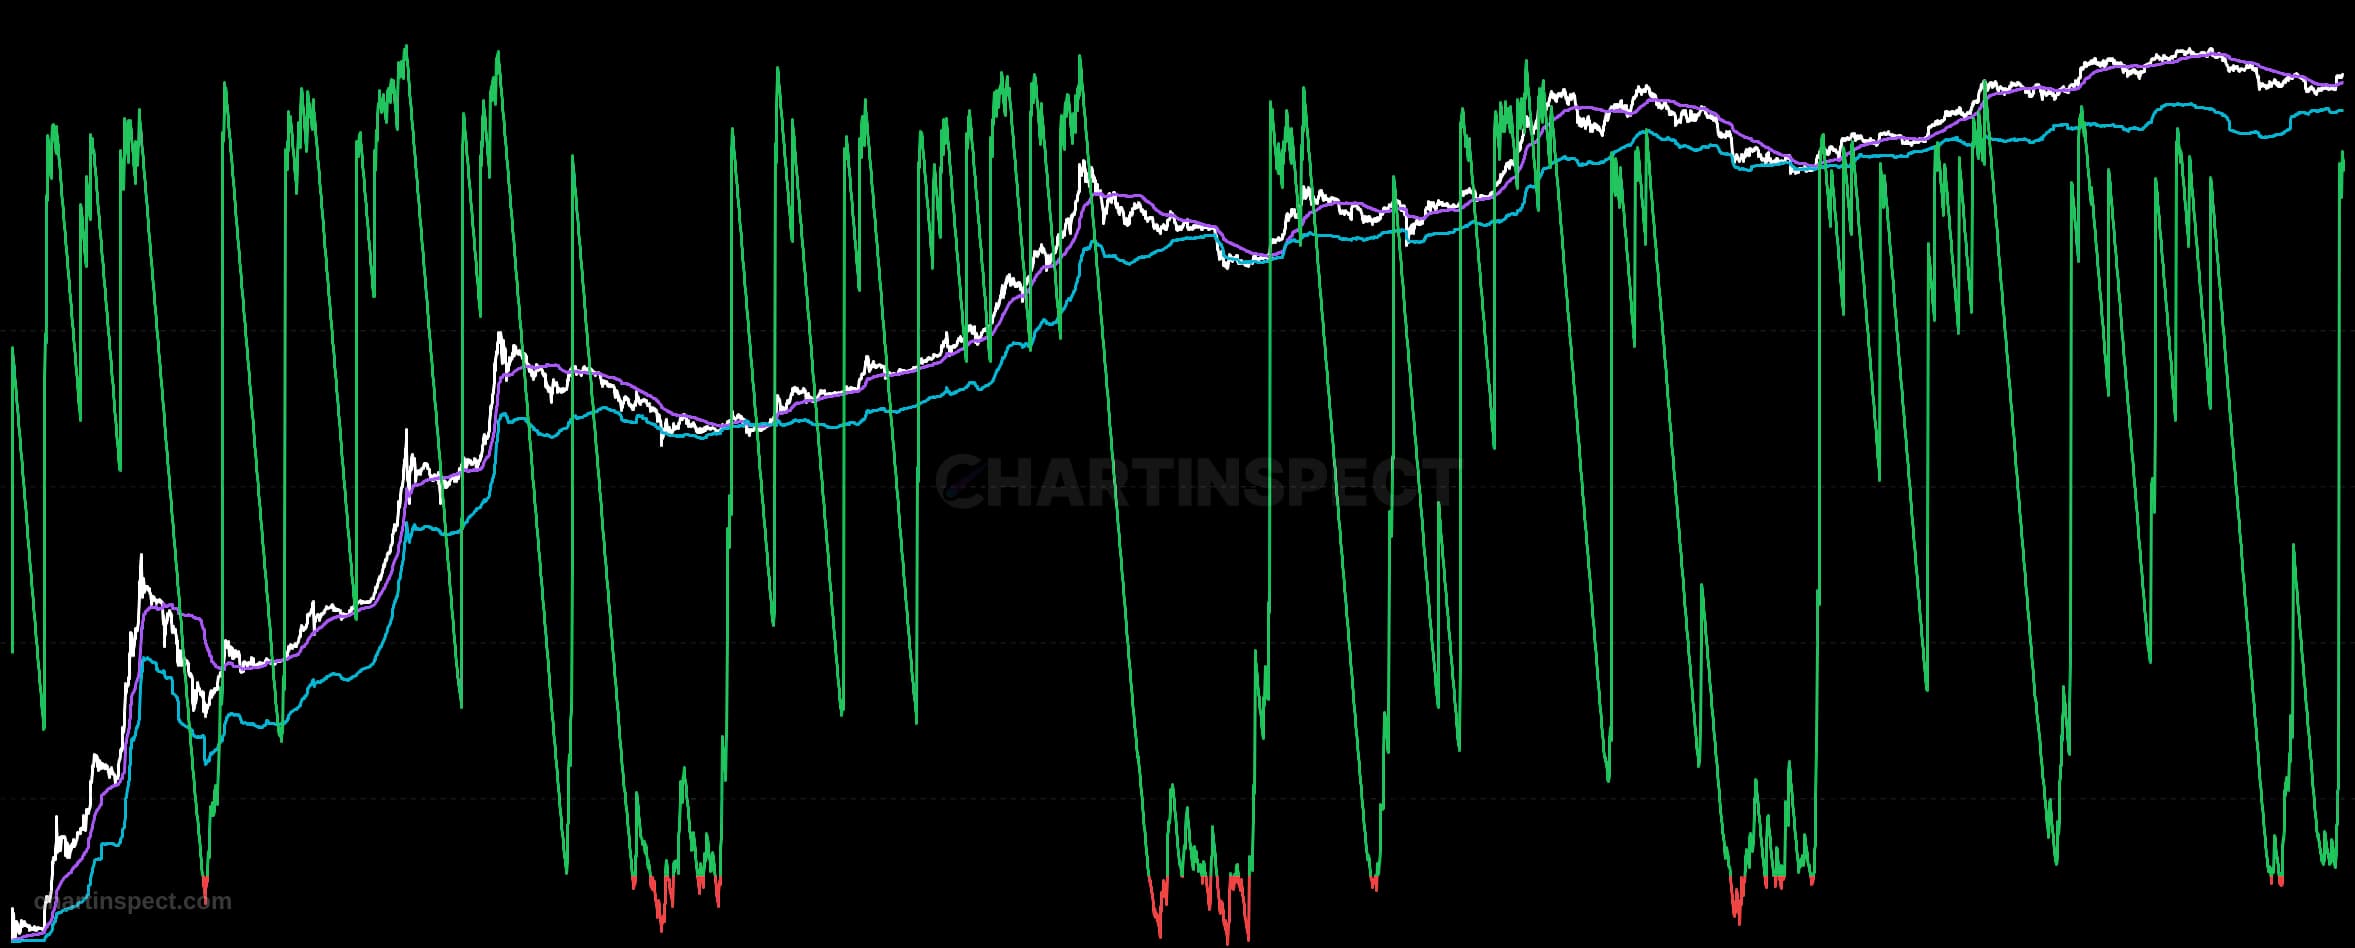
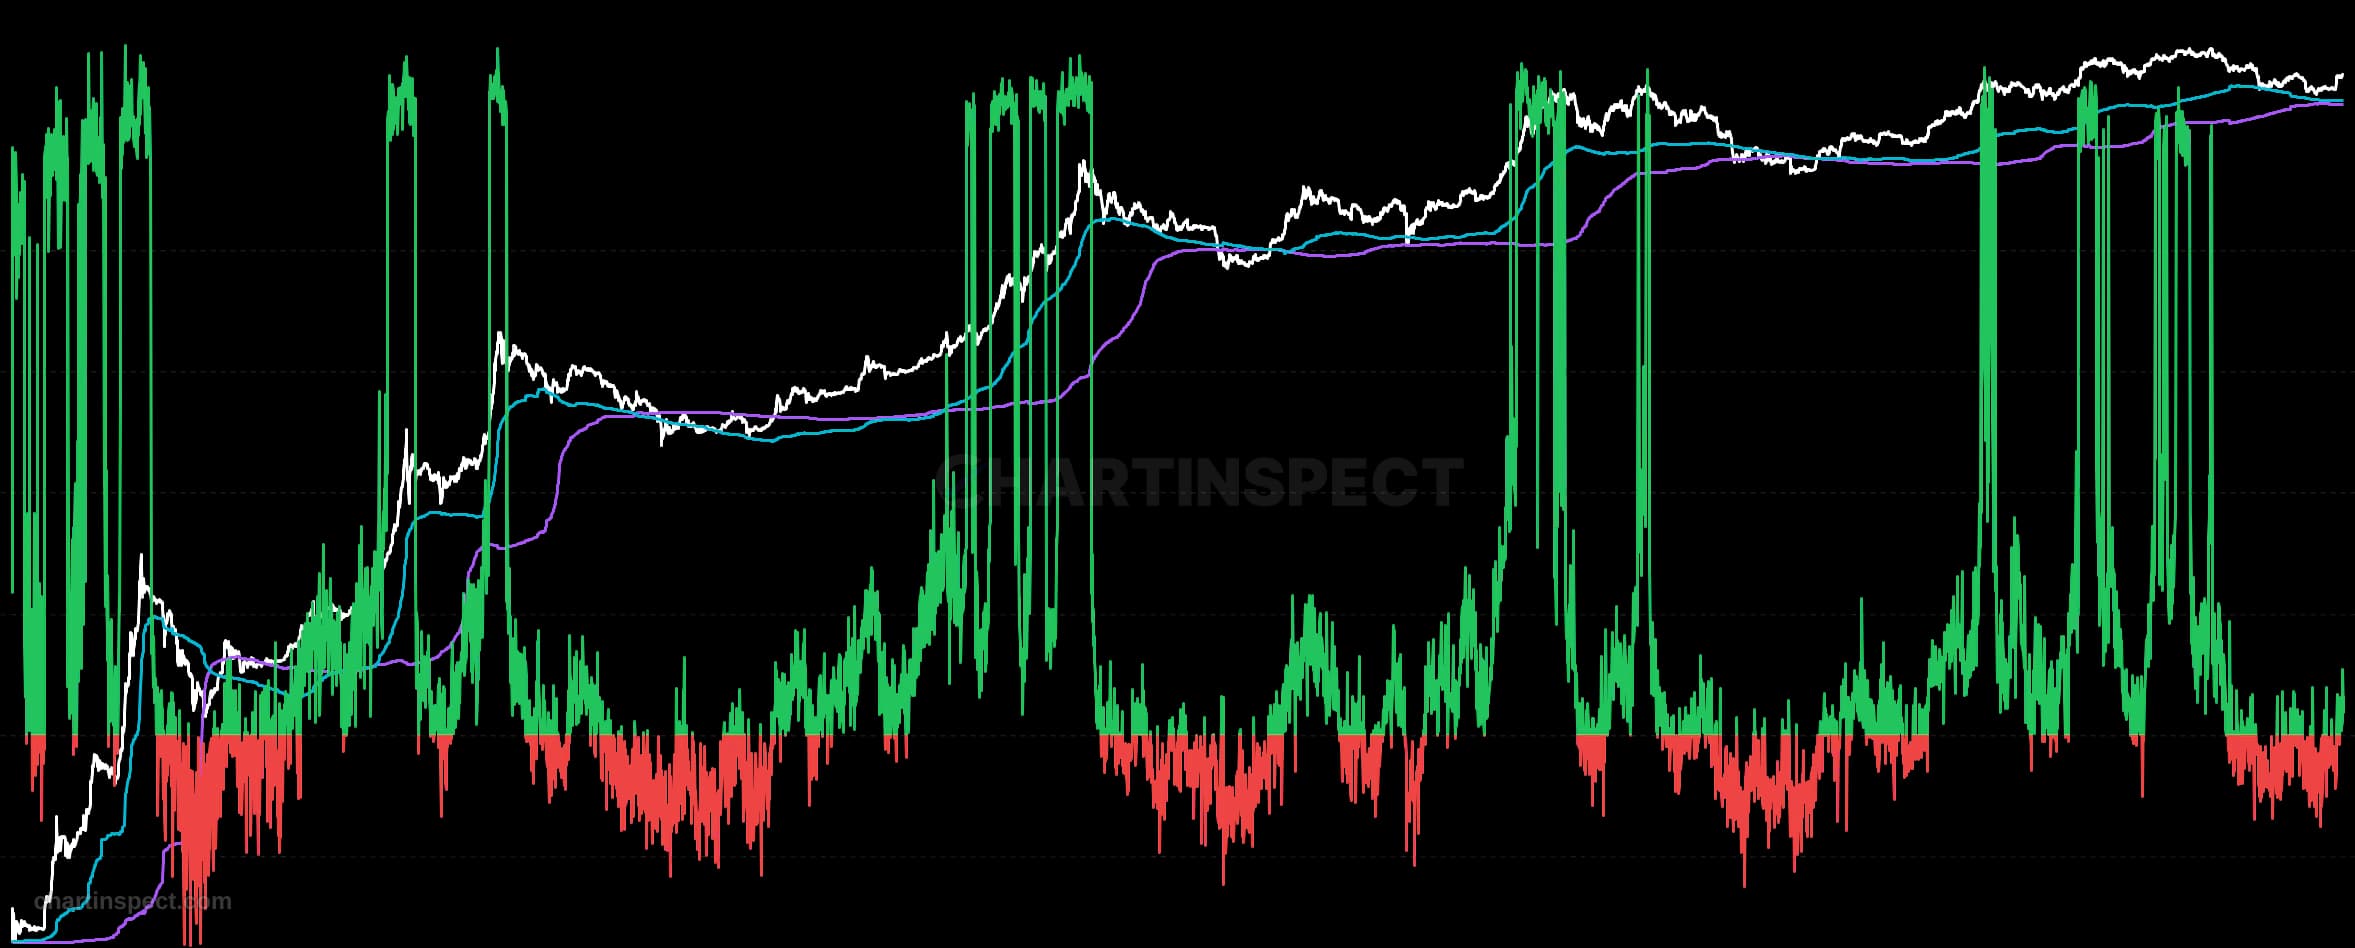
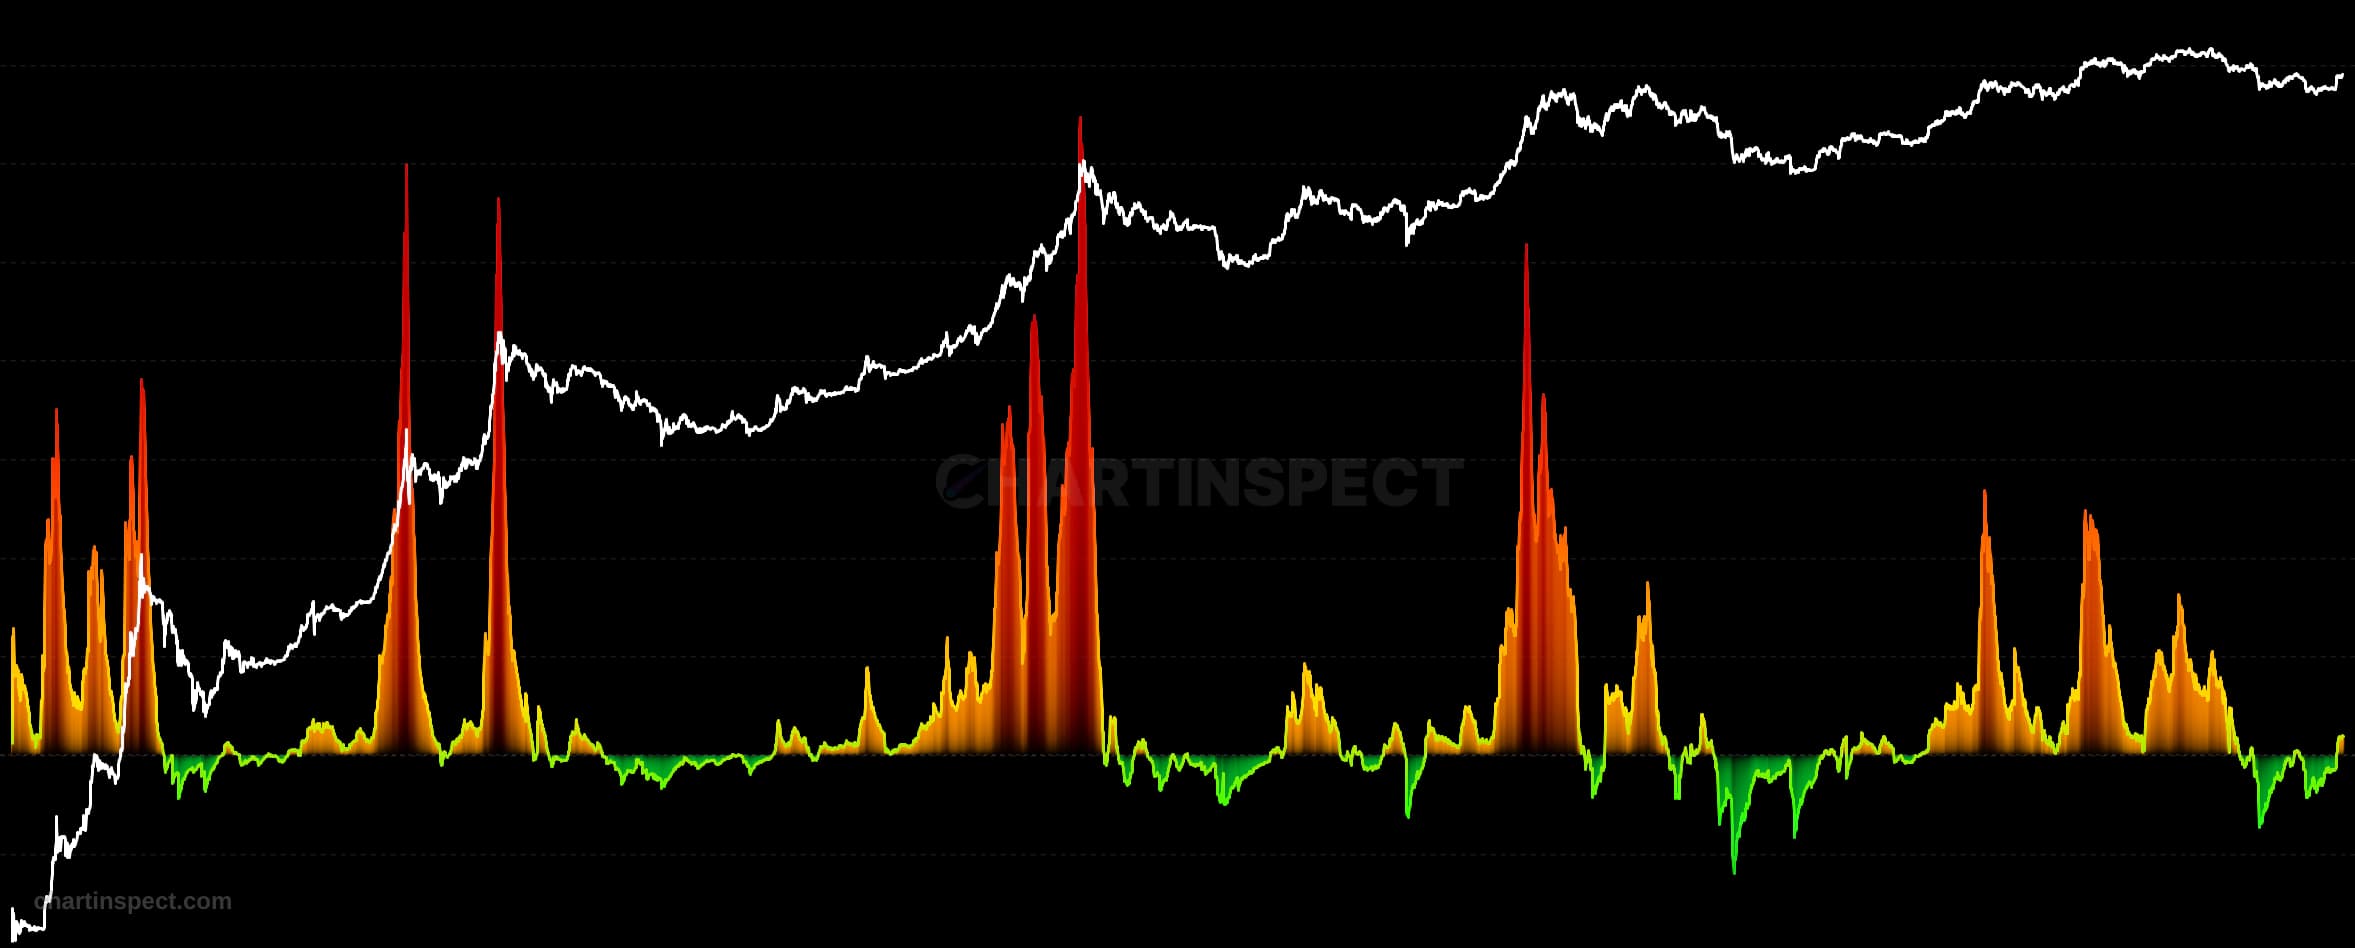
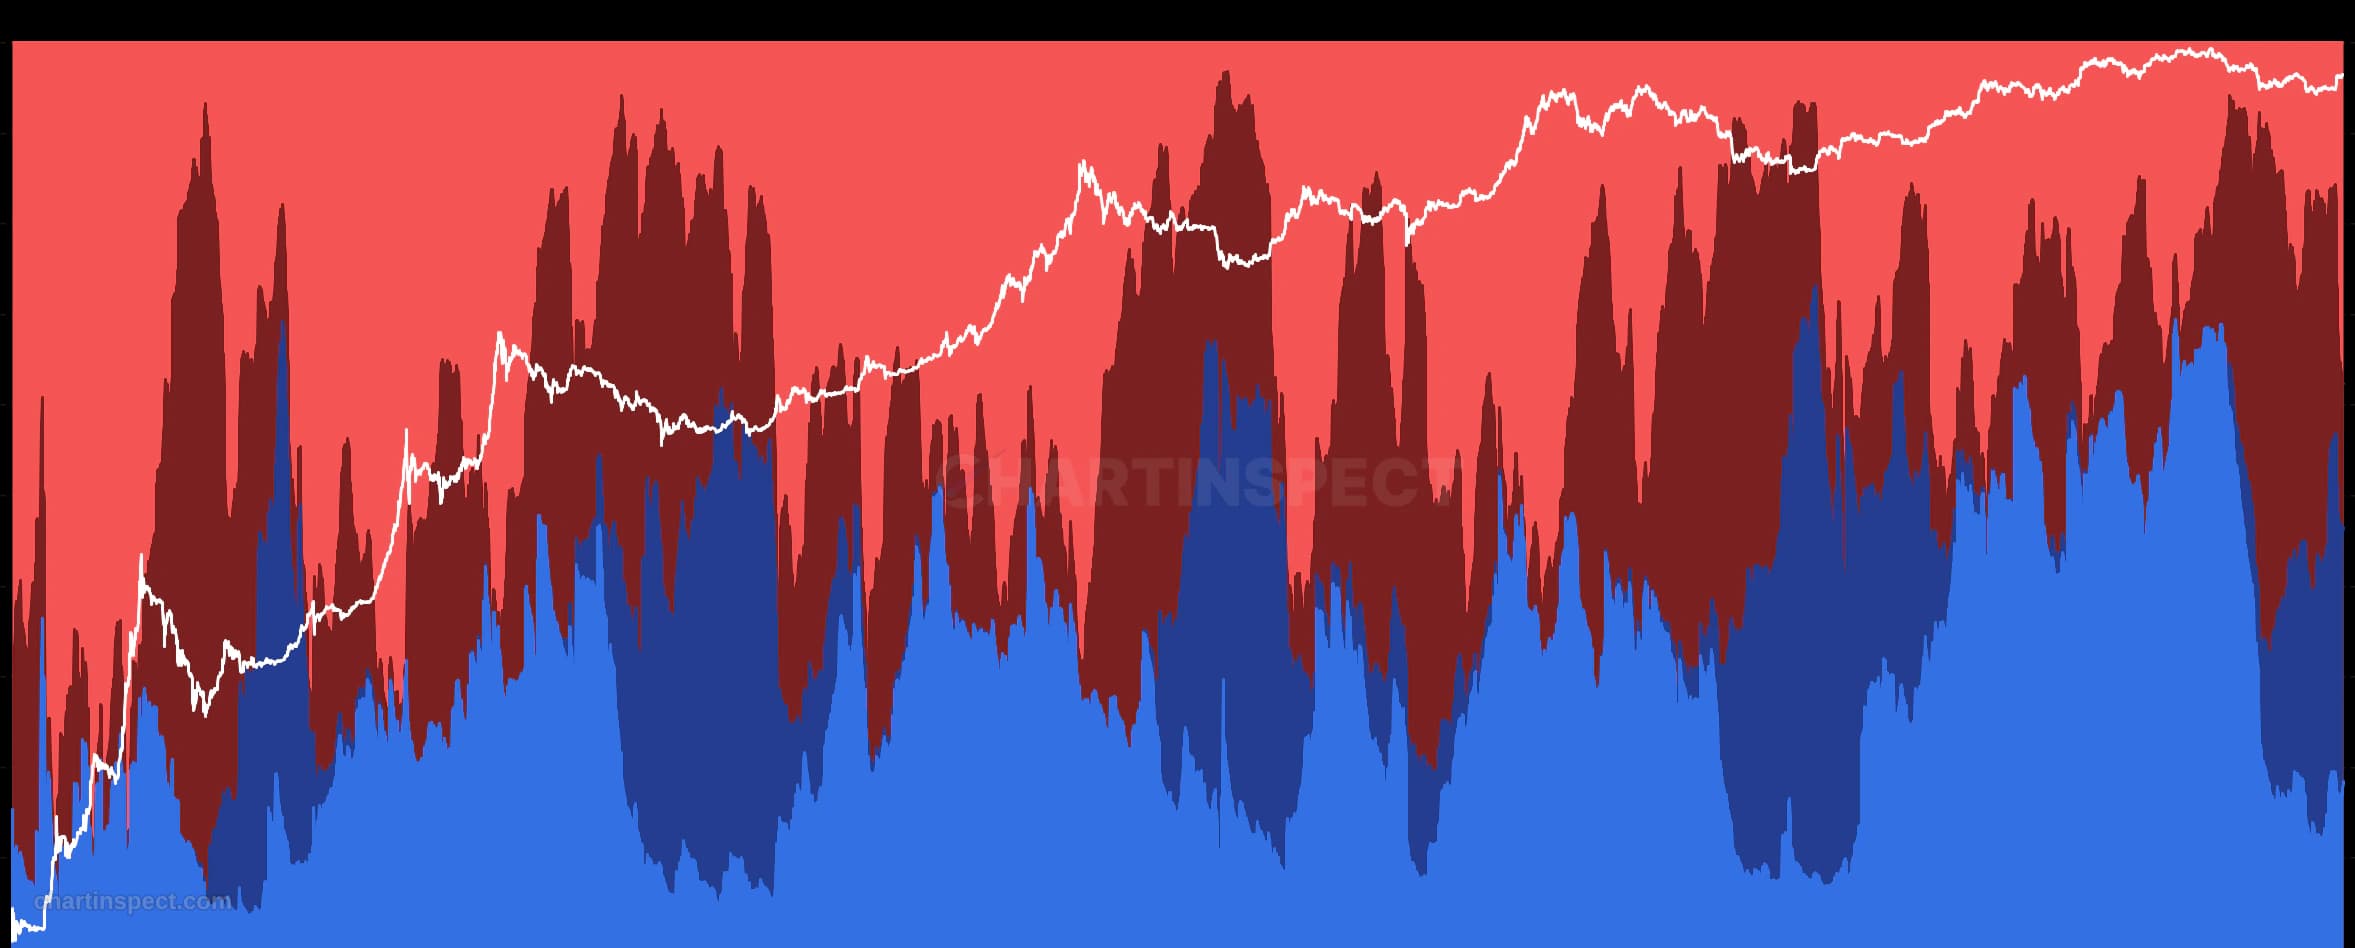
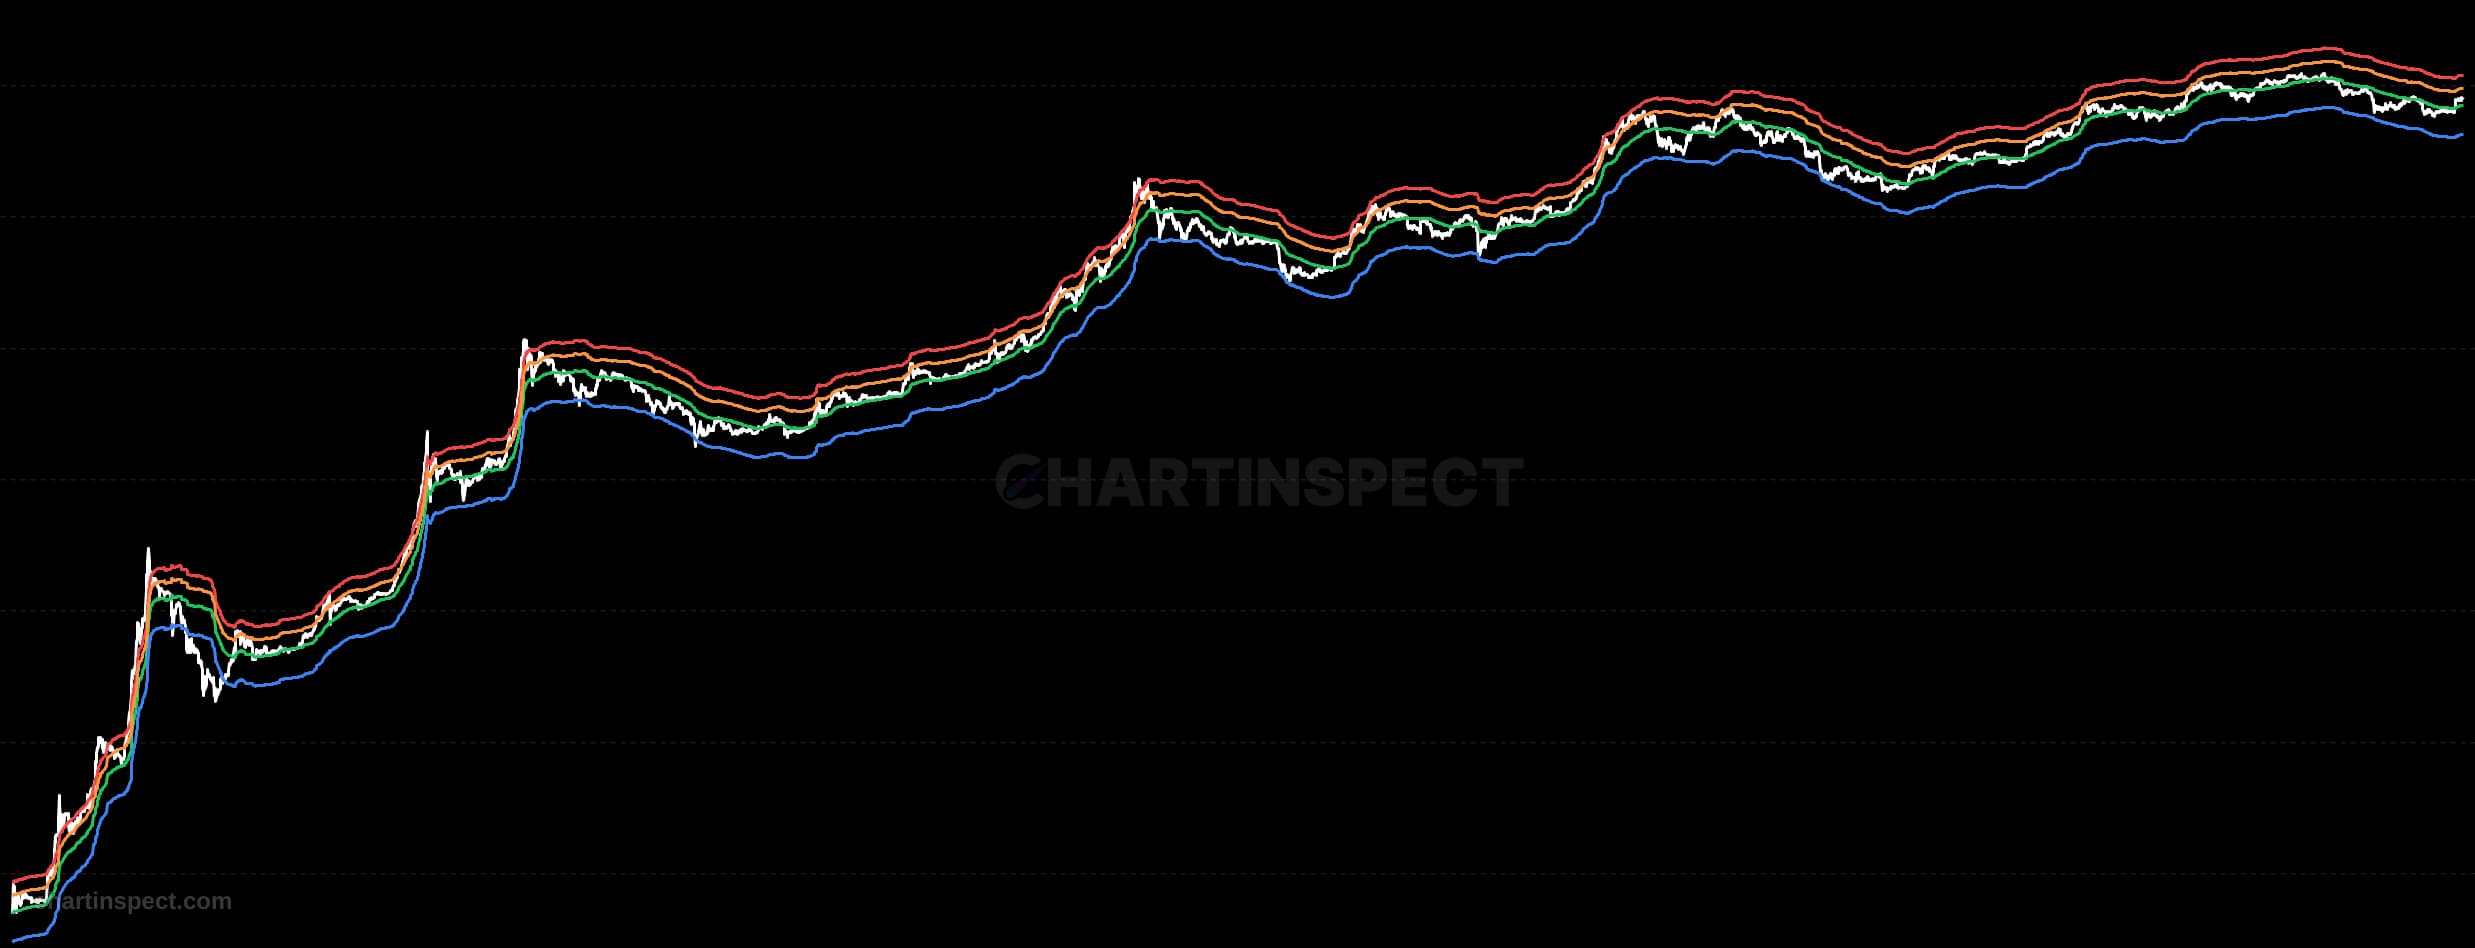
The Bitcoin STH P/L Price Flow chart tracks the net flow of short-term holder cumulative profit and loss price changes, denominated in BTC. Rather than plotting a static cost basis level, it measures the rate and magnitude at which the short-term holder cost basis shifts over time, isolating how quickly this cohort's aggregate profit and loss position is moving. Short-term holders are the segment of Bitcoin supply that has moved most recently, making their flow the most reactive gauge of near-term market pressure.
The chart uses jet colormap styling with percentile-based thresholds, so the color of each reading is set relative to the historical distribution of flow magnitudes rather than a fixed scale. Cooler colors mark the low end of the range and hotter colors mark the extremes, letting you see when the current shift in short-term holder P/L price is unusually large. Sharp positive flows tend to coincide with rapid profit-taking, while sharp negative flows highlight capitulation as recent buyers realize losses.
Use the price flow to time short-term inflection points in Bitcoin. Extreme readings in the upper percentiles often accompany local tops driven by short-term holder profit-taking, while extreme readings at the capitulation end can mark exhaustion after recent buyers have been flushed out. Because the metric reflects the fastest-moving cohort, treat it as a momentum overlay on longer-horizon valuation tools rather than a standalone signal.
Check the selected asset, units, and cohort before comparing readings. Compare the metric over consistent dates and use related measures to understand what contributes to a change.