Loading chart data
Chain
Scale
Smoothing
Loading chart data
About CB Supply Shift
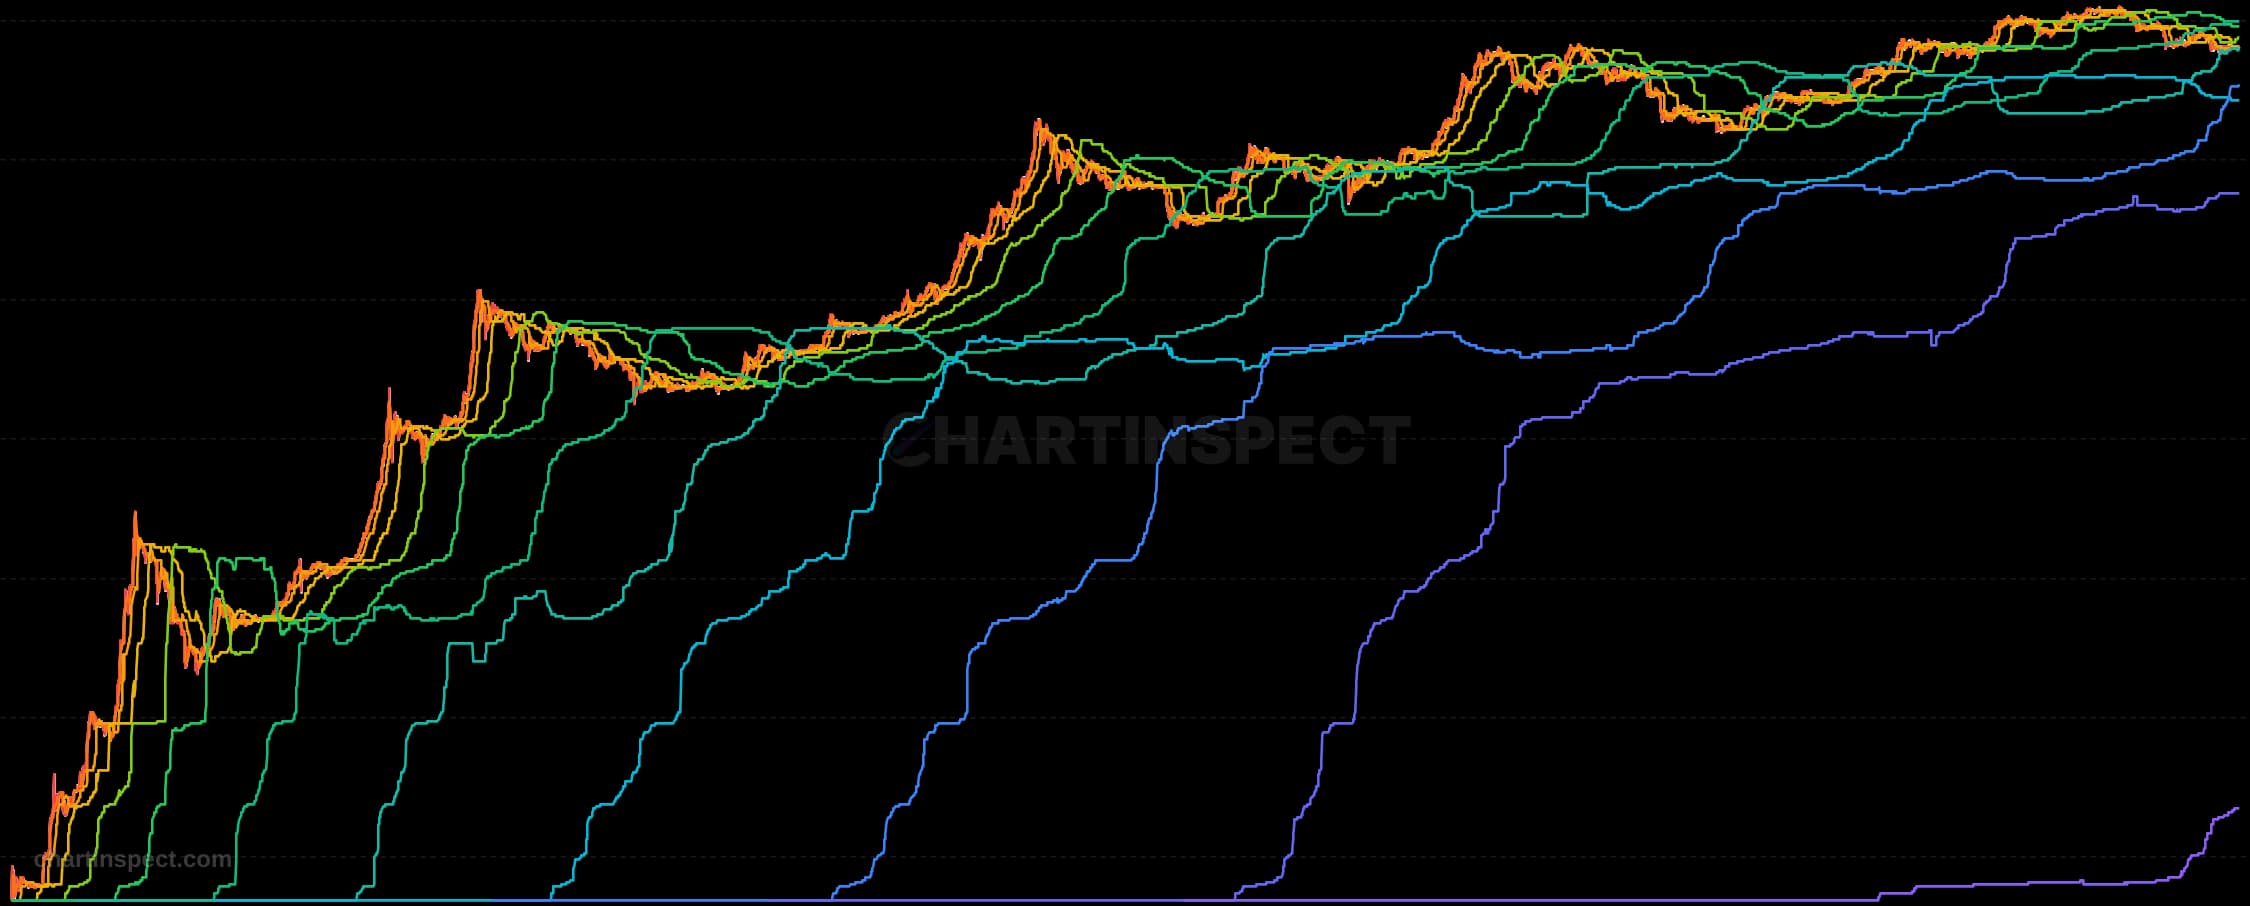
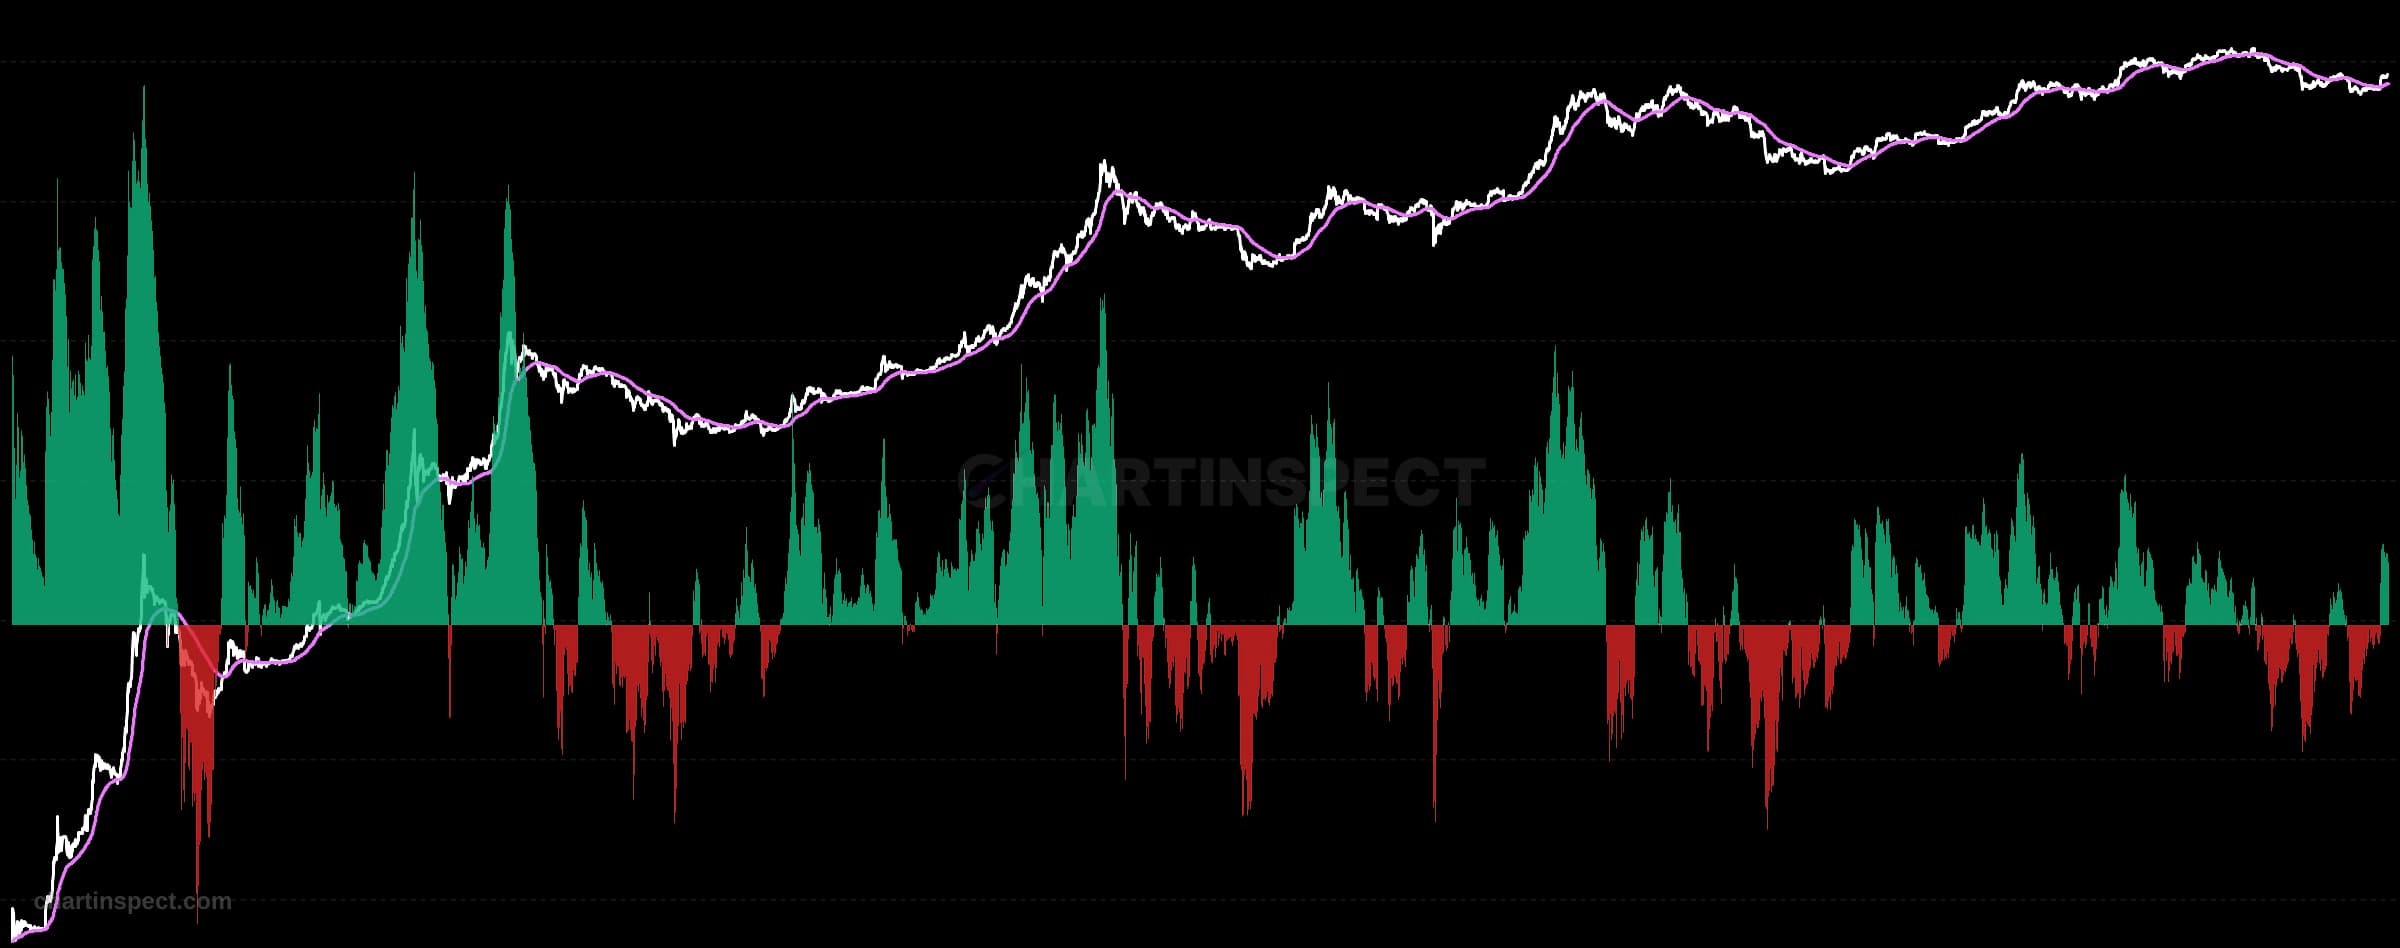
Measures how much the cost basis distribution has changed over 30, 90, and 365-day windows by comparing the current 500-bucket histogram to the one N days ago. High values indicate major redistribution where significant supply has moved between price levels through buying and selling activity. Low values across all timeframes indicate a stable holder base in consolidation. A 30-day spike while the 90-day stays low suggests a short-term event that has not changed the longer-term market structure.
Freshness: Not yet verified
Community snapshot
No community calls on CB Supply Shift yet. Be the first to share a take.
Also available for

Related Analytics
Discover more insights with our comprehensive chart collection
Explore All 8012 Charts