Loading chart data
Chain
Scale
Smoothing
Loading chart data
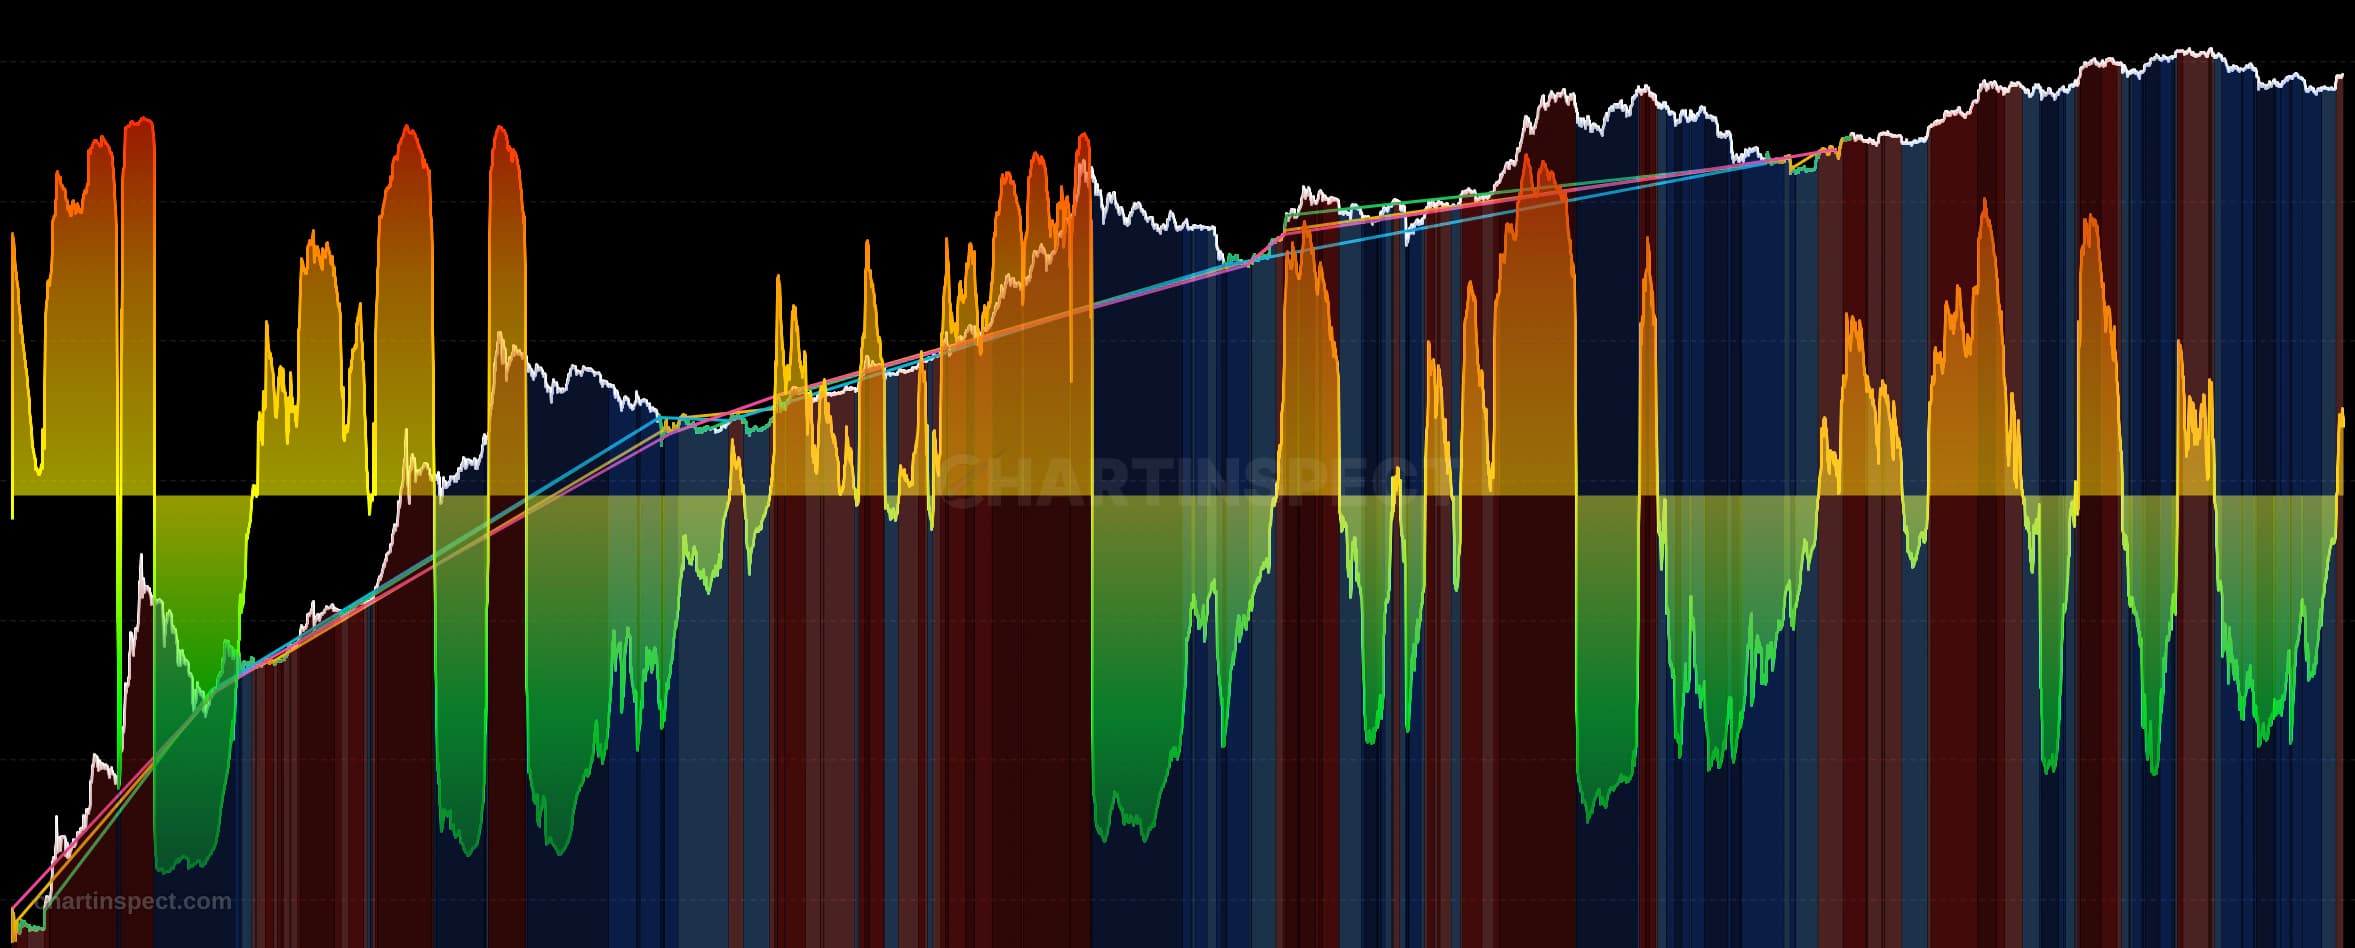
About CB Profit/Loss Ratio
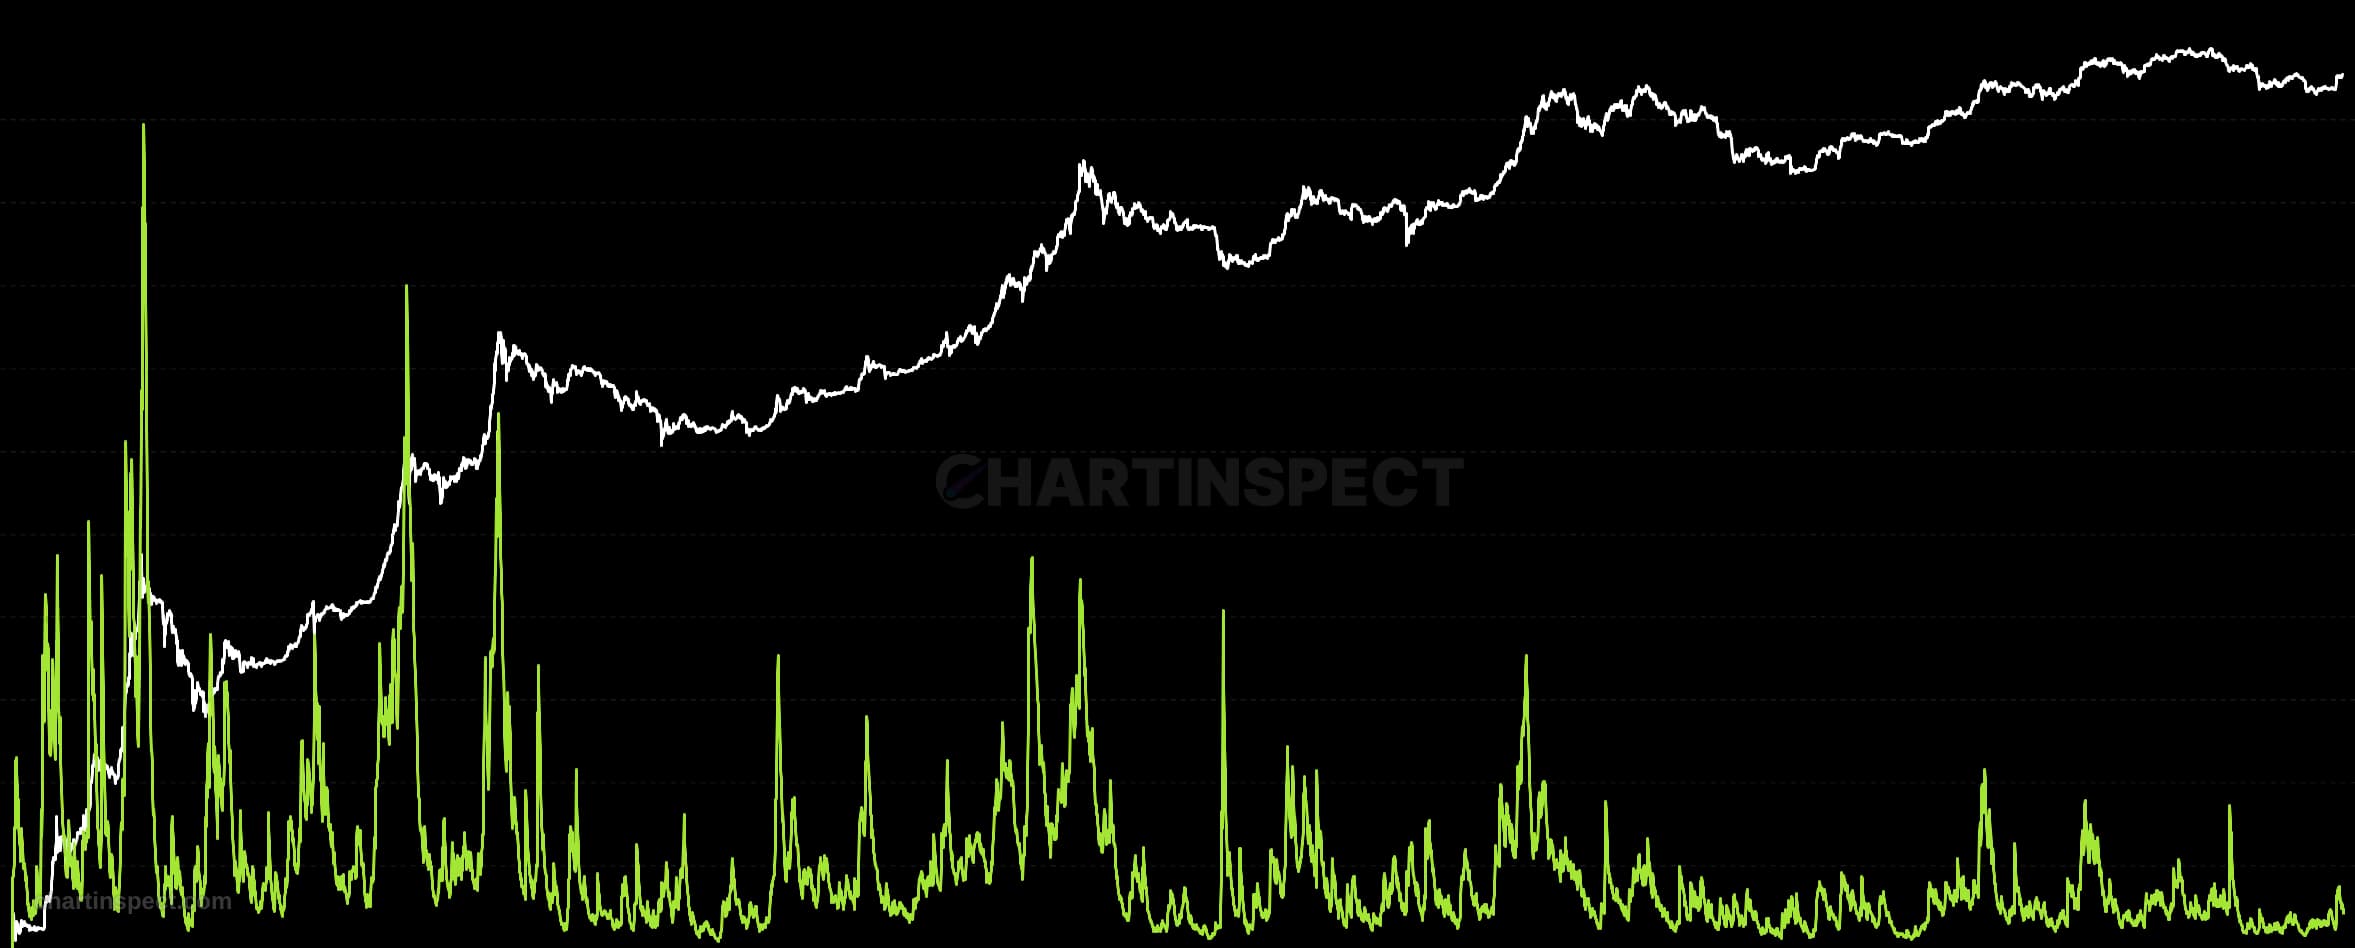
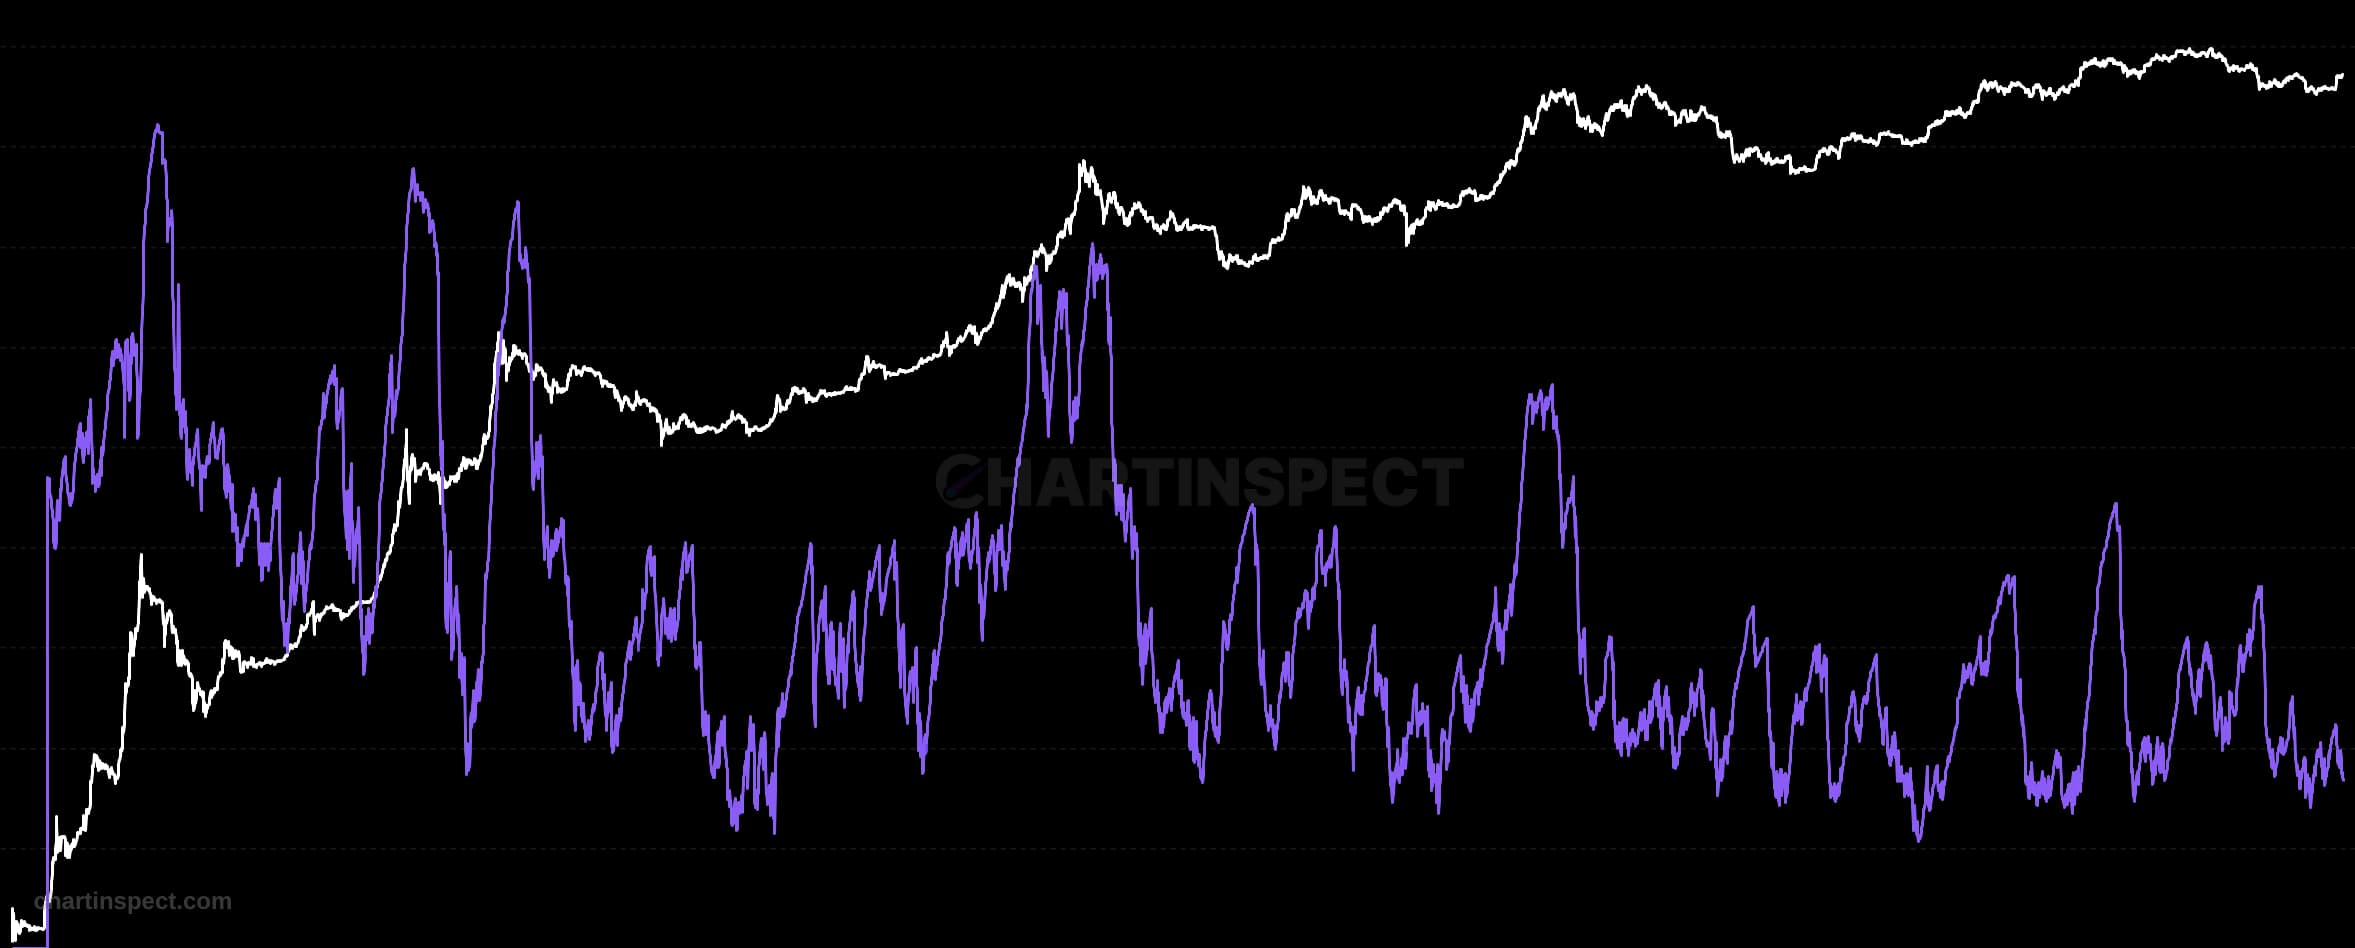
Computes the ratio of total unrealized profit to total unrealized loss across all 100 price buckets in the cost basis histogram. Unlike NUPL which uses aggregate market cap, this measures P&L at each cost basis level for higher granularity. Ratio above 1 indicates a bullish structure where more supply is in profit than loss. Extreme highs (5x+) signal euphoria and distribution risk, while values near zero mark generational buying opportunities where nearly everyone is underwater.
Freshness: Not yet verified
Community snapshot
No community calls on CB Profit/Loss Ratio yet. Be the first to share a take.
Also available for

Related Analytics
Discover more insights with our comprehensive chart collection
Explore All 8012 Charts