On-Chain Metrics
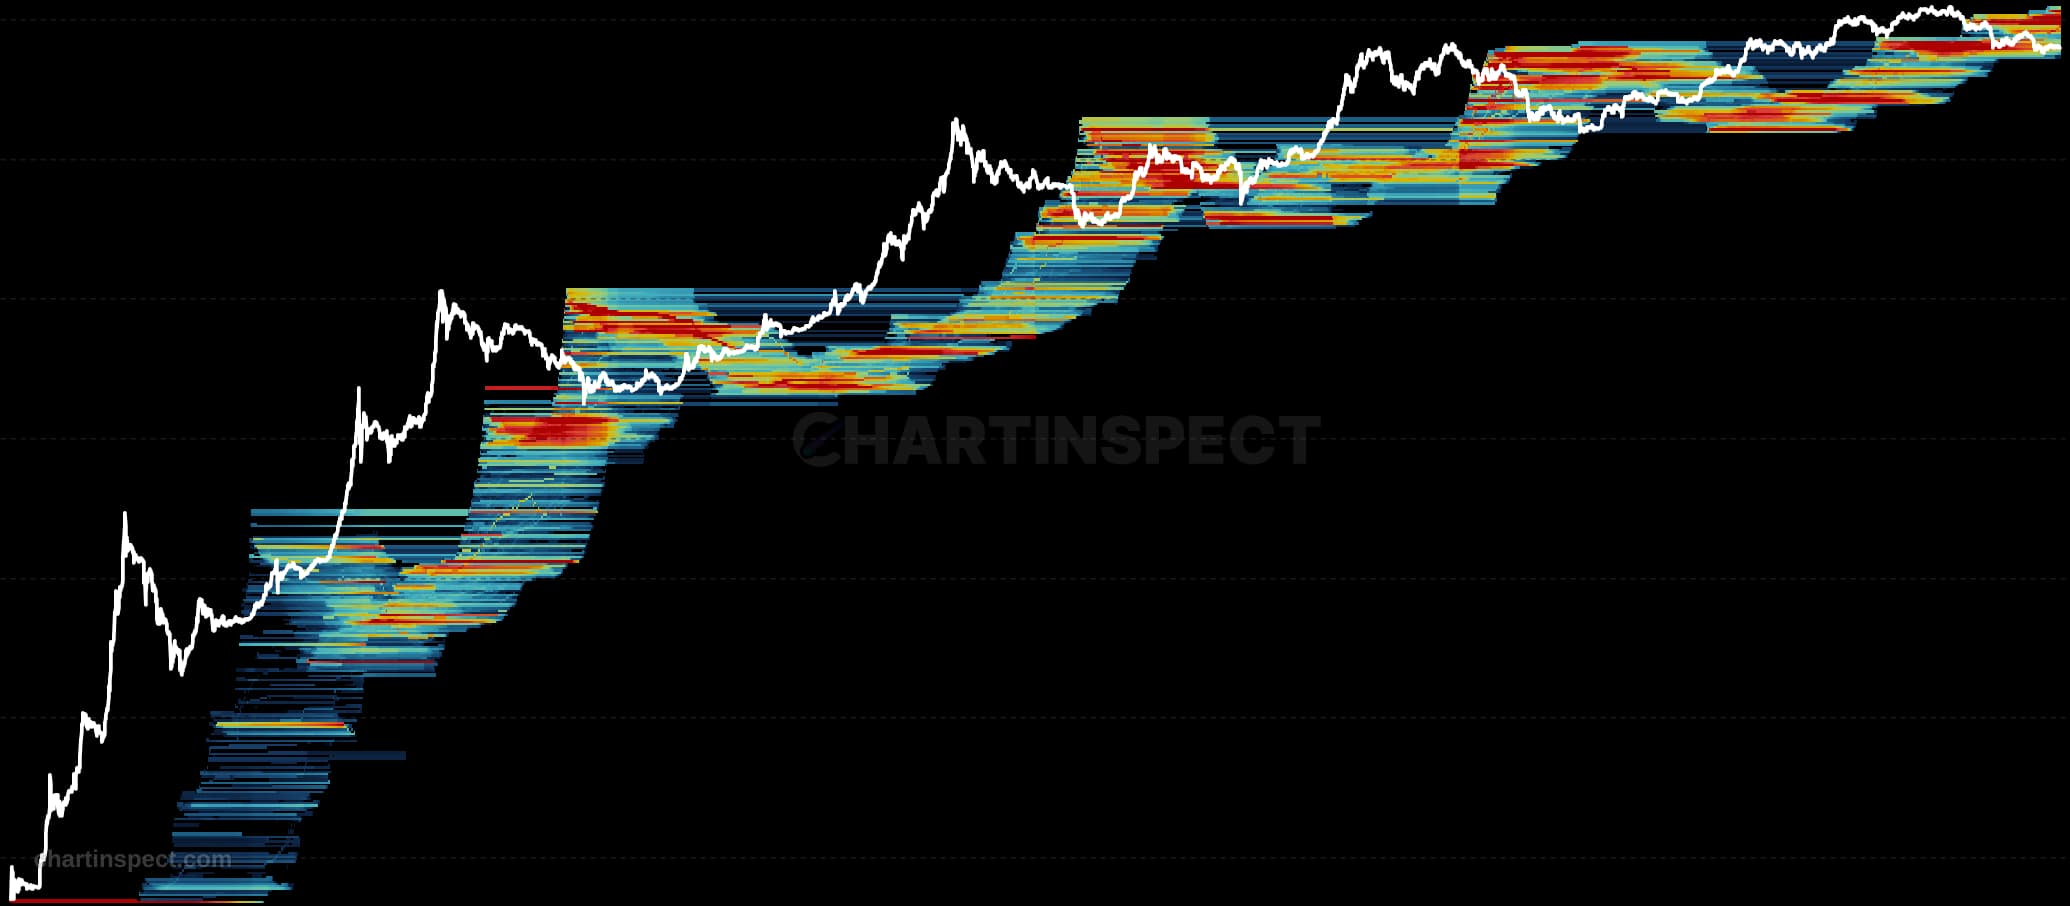
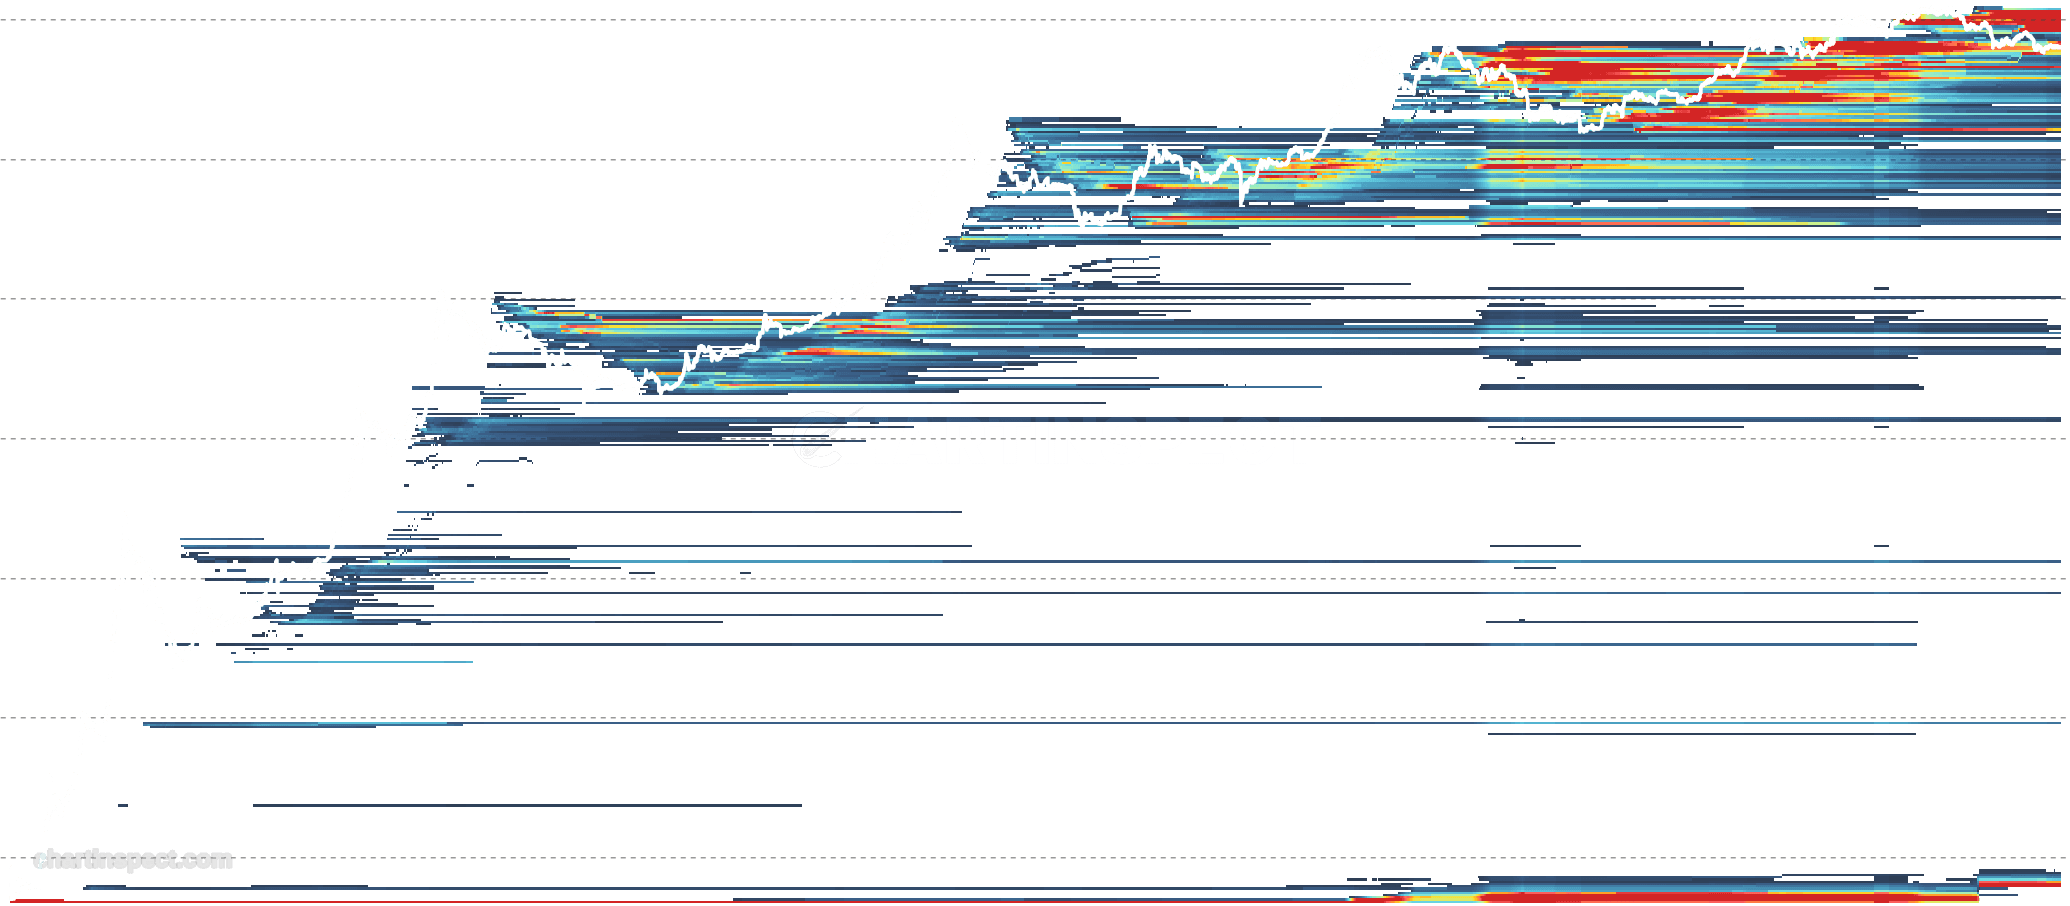
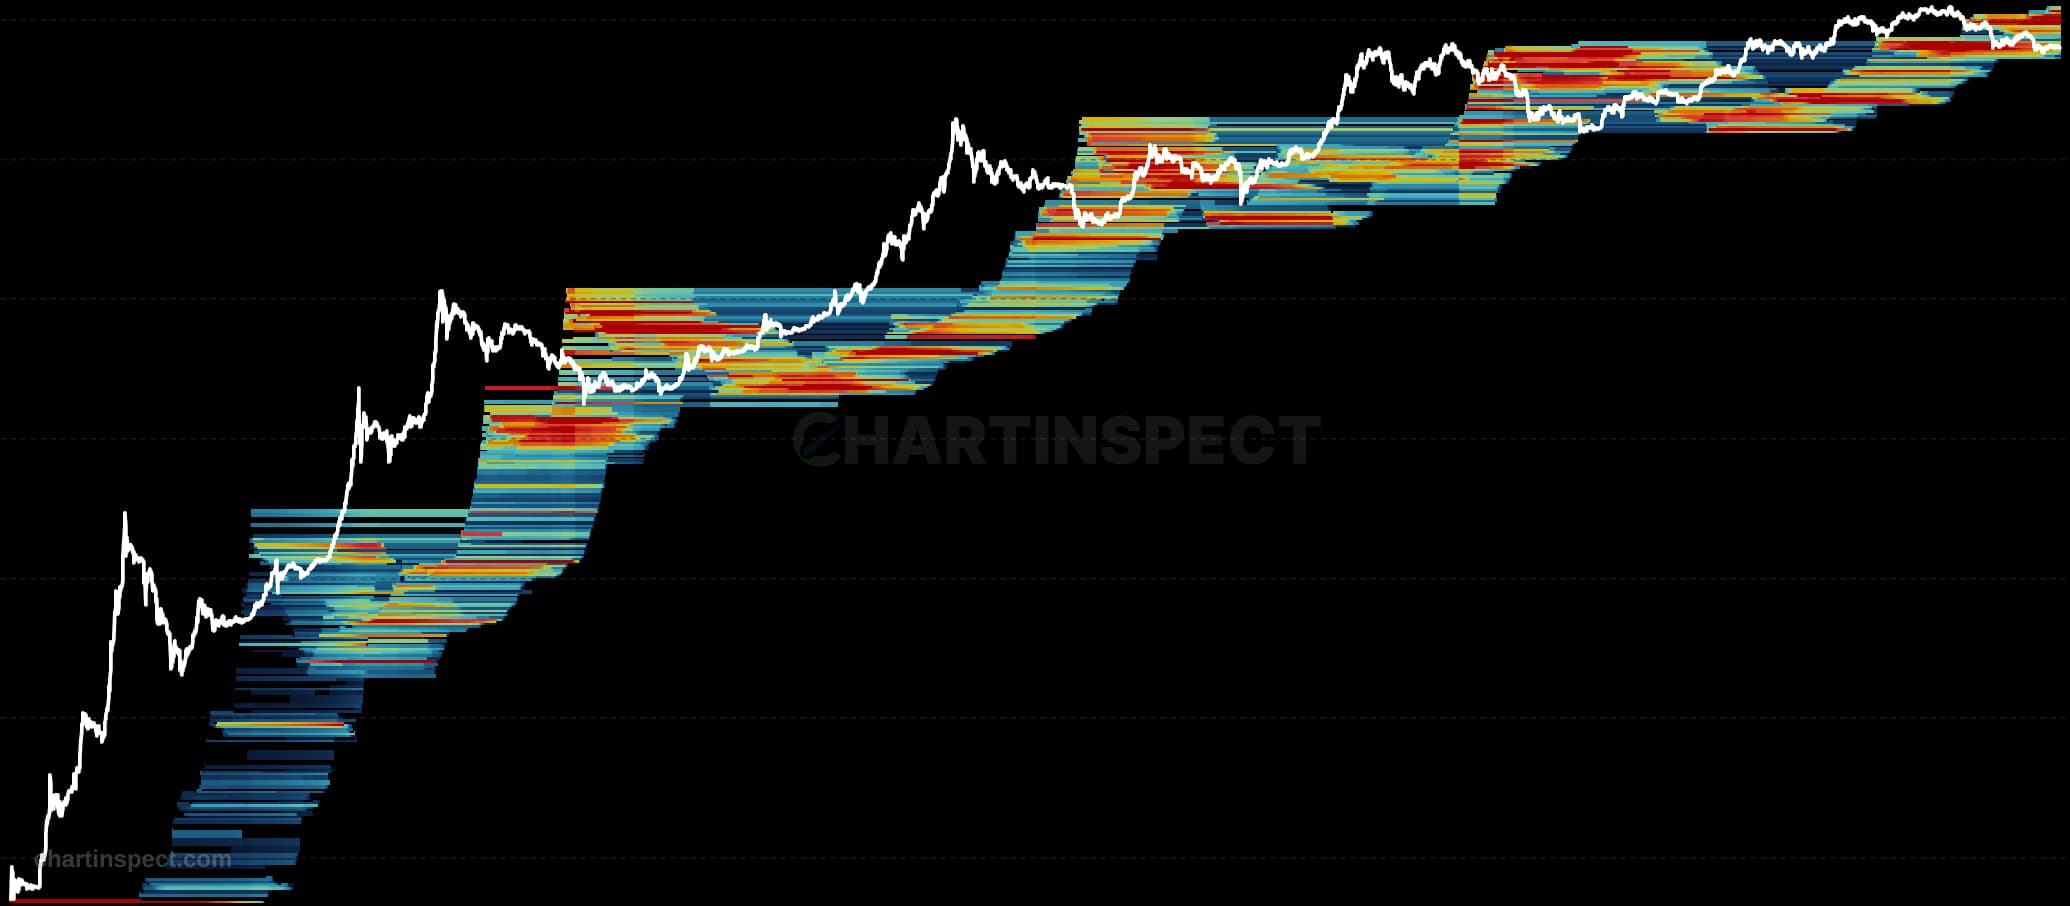
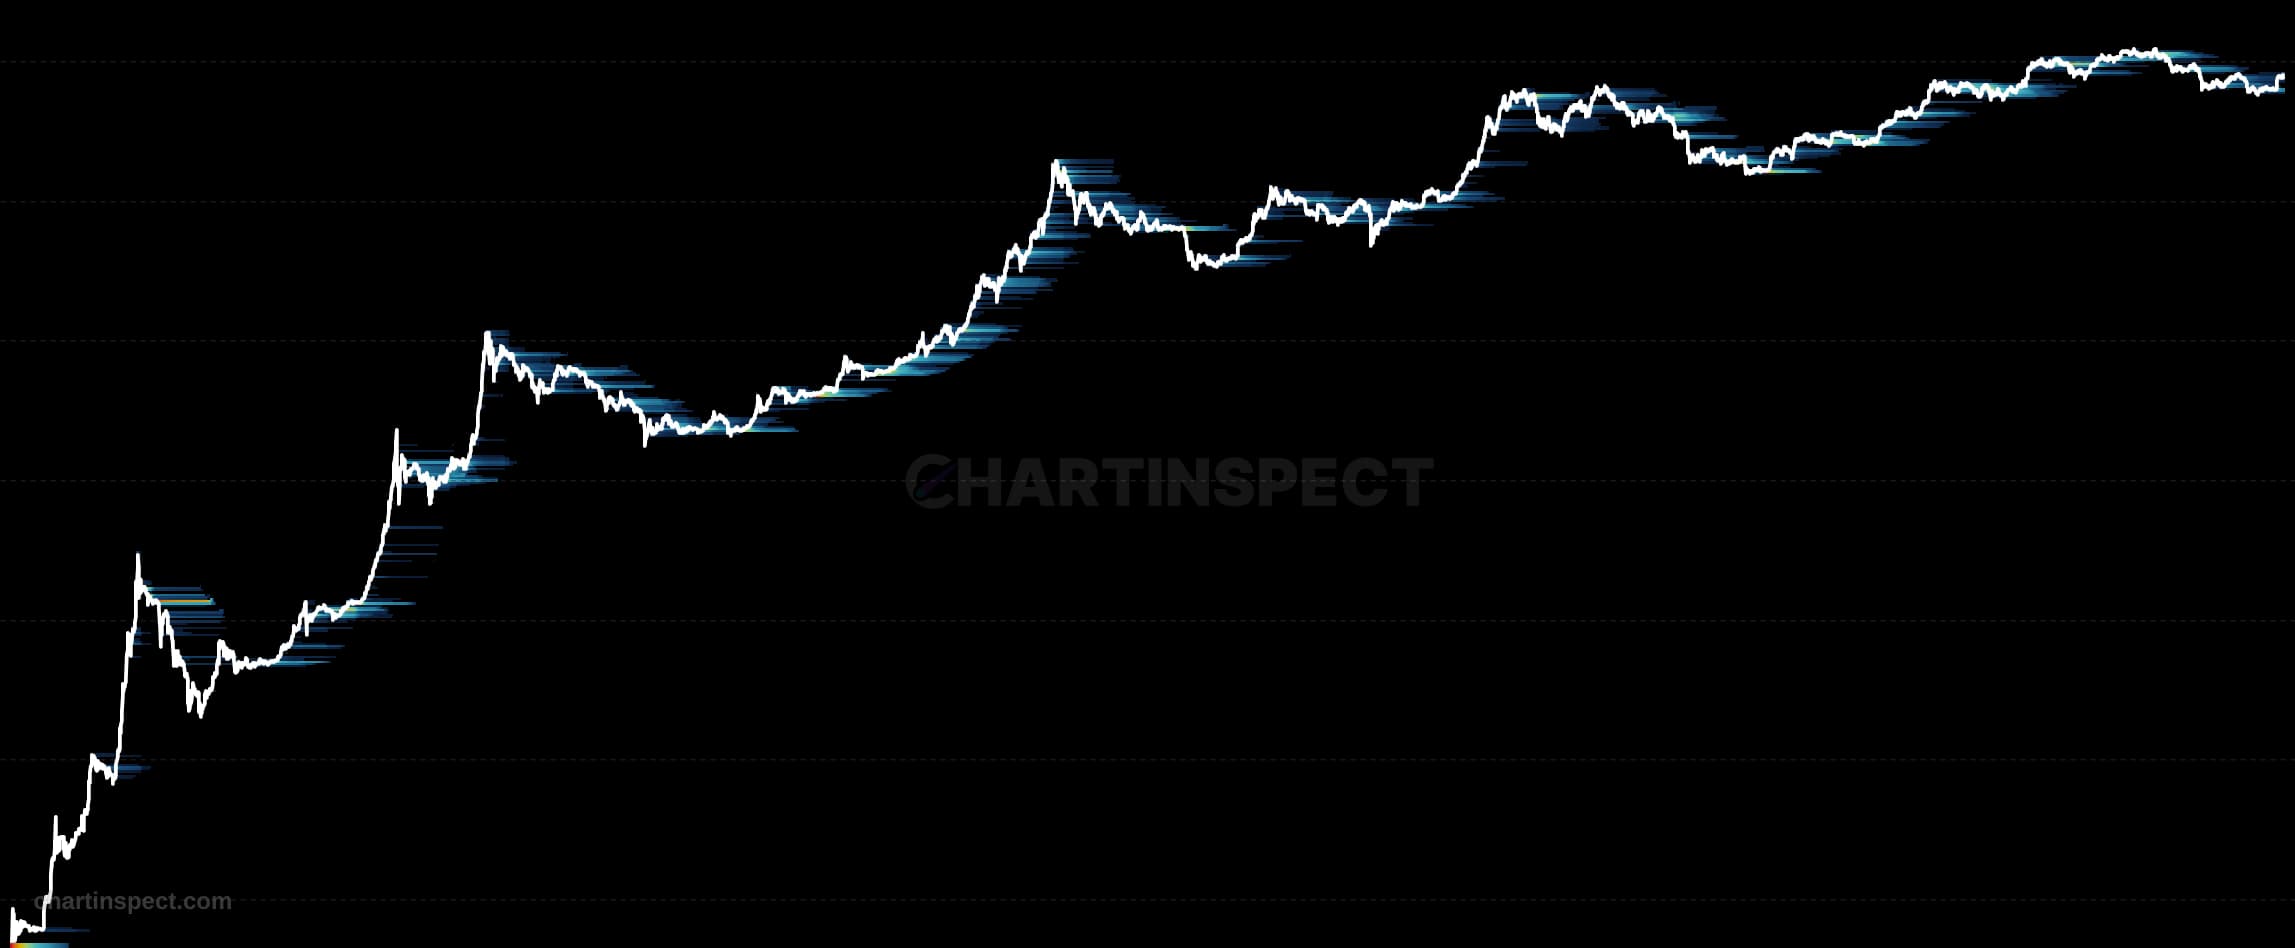
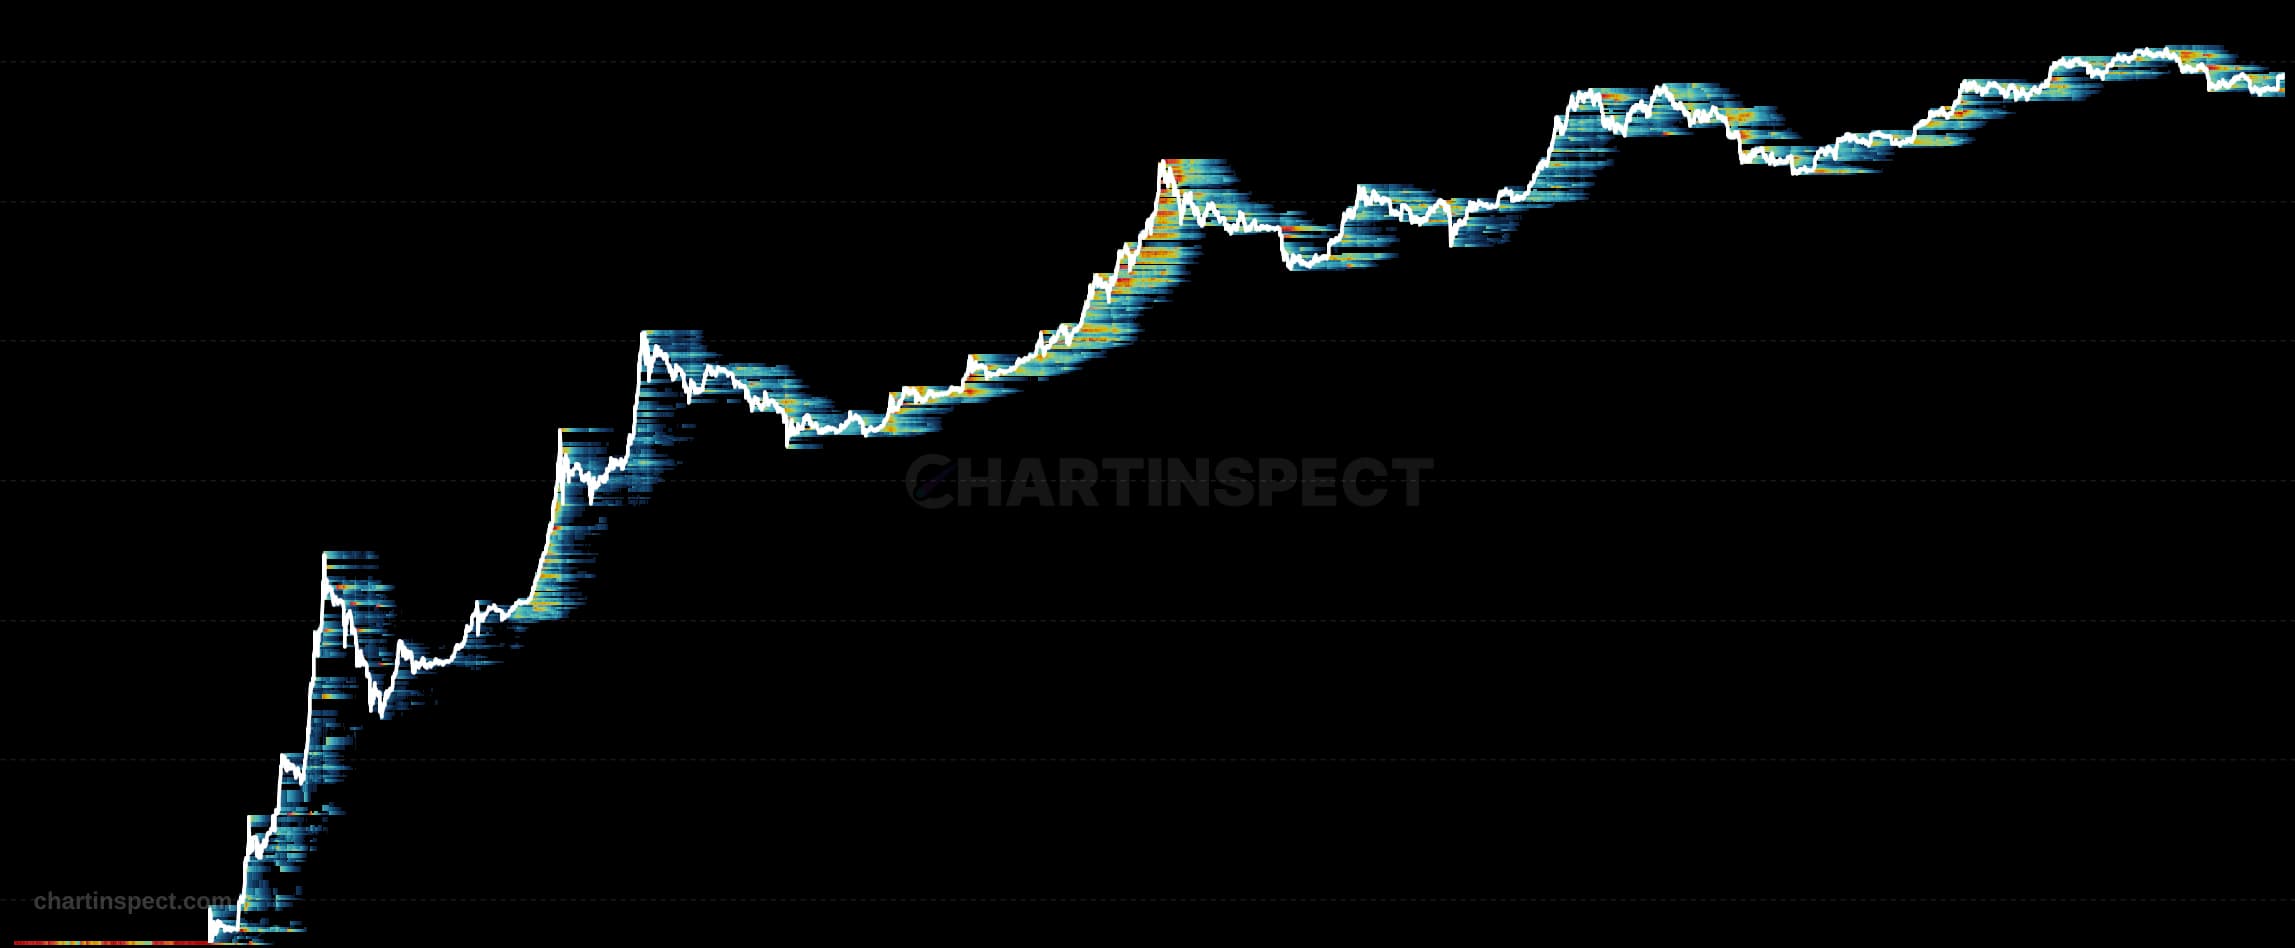
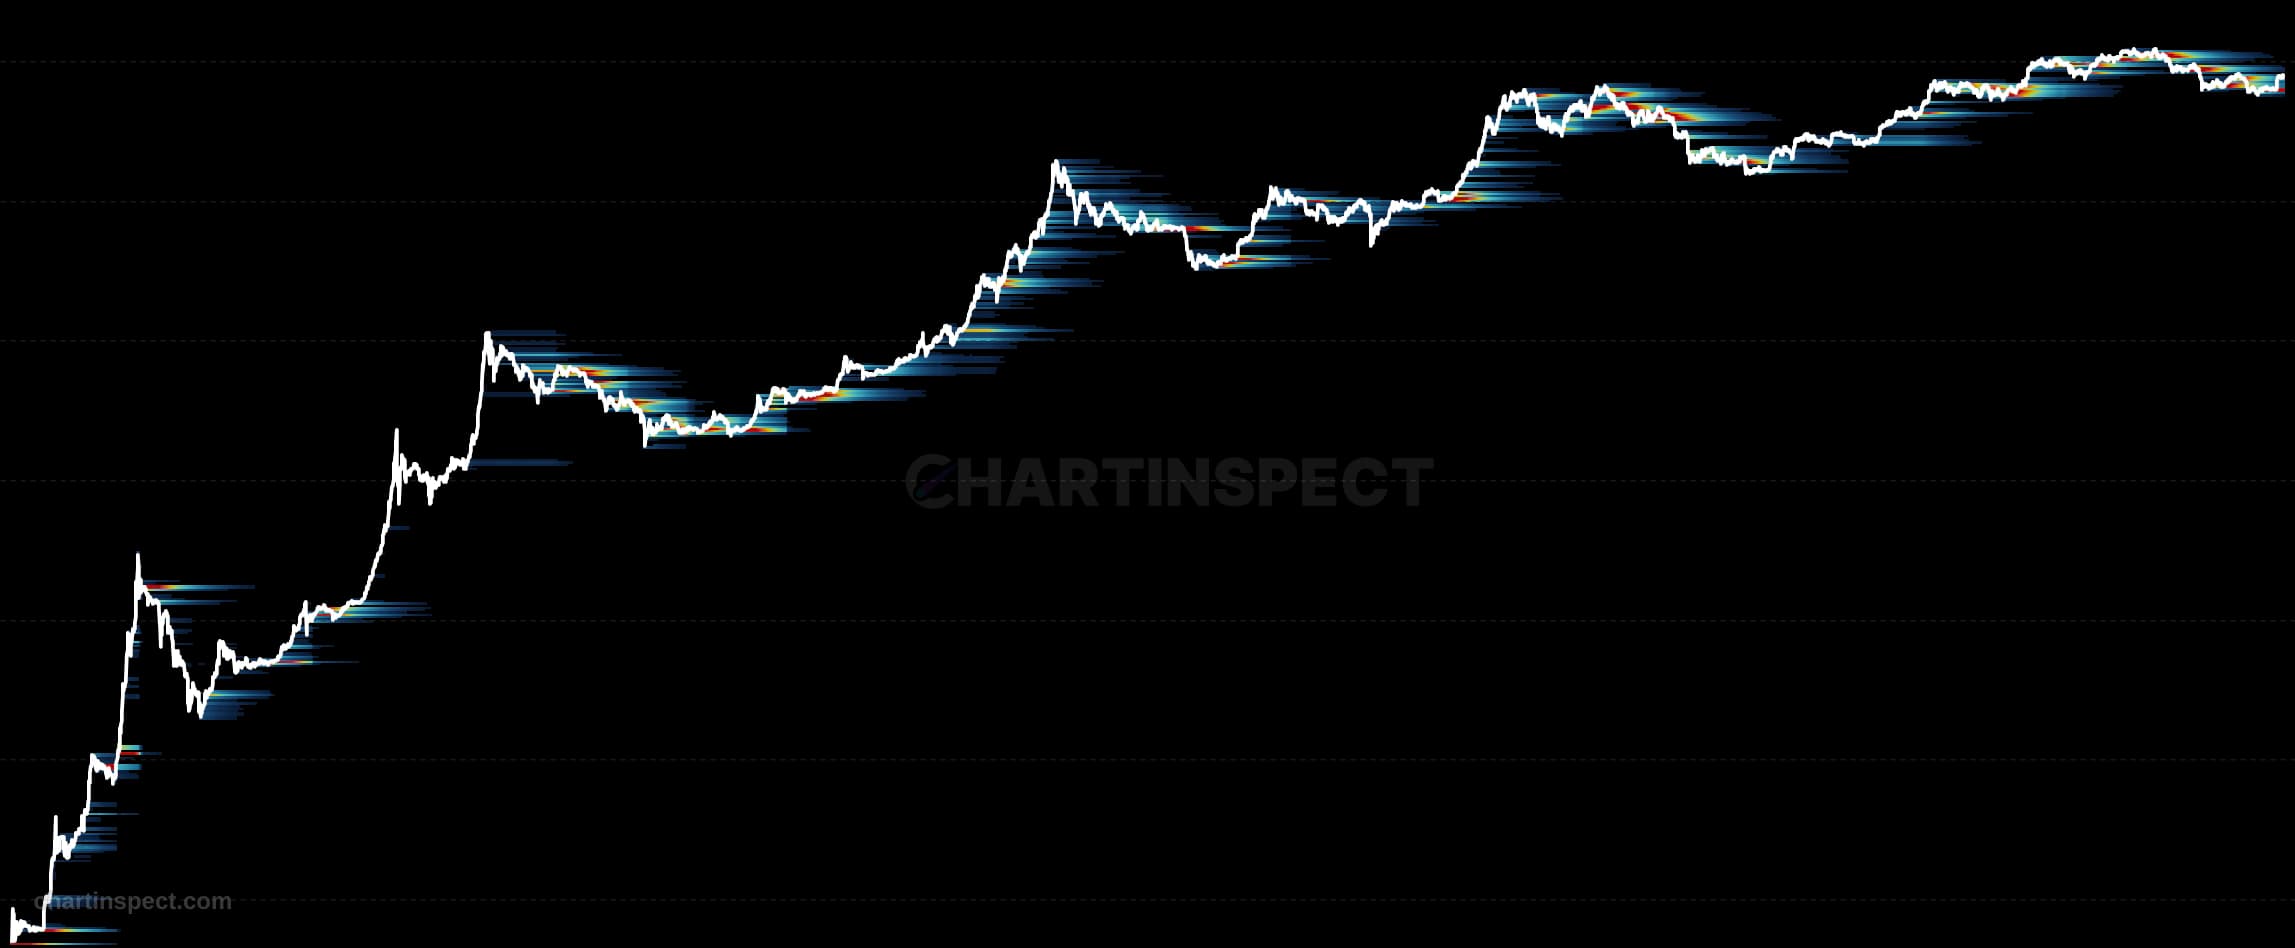
Address-weighted Cost Basis Distribution restricted to Short-Term Holder supply (coins <155 days old). Each address bucketed by its weighted-average cost basis across its STH UTXOs, reveals where fresh demand has its average buy-in and is likely to defend or capitulate.
The Bitcoin STH Cost Basis Distribution charts the concentration of short-term holder supply by acquisition price. It restricts the address-weighted Cost Basis Distribution to coins younger than 155 days, the standard threshold separating short-term from long-term holders. Each address is bucketed by its weighted-average cost basis across its short-term-holder UTXOs, so the heatmap shows where recent buyers established their average entry rather than where any single coin last moved.
Read the map by intensity: brighter bands mark price levels where a large share of short-term holder Bitcoin was acquired, and thinner bands mark levels with little fresh demand. Because these are the newest, weakest hands, the clusters double as behavioral levels. Coins bought just below the current price sit in profit and their owners tend to defend that basis, while coins bought above it sit underwater and become likely capitulation supply.
Use the distribution to locate where new demand is concentrated and how much of it is in profit or loss. A price approaching a dense short-term holder cluster from above often finds support as those buyers protect their cost basis, whereas a break below a heavy band exposes that cohort to unrealized losses and raises the odds of forced selling.
Check the selected asset, units, and cohort before comparing readings. Compare the metric over consistent dates and use related measures to understand what contributes to a change.
Addresses and on-chain cohorts do not identify individual people. Network designs and available histories differ, so a threshold observed on one asset may not transfer to another.
Address-weighted Cost Basis Distribution restricted to Short-Term Holder supply (coins <155 days old). Each address bucketed by its weighted-average cost basis across its STH UTXOs, reveals where fresh demand has its average buy-in and is likely to defend or capitulate.
Freshness: Not yet verified
No community calls on STH Cost Basis Distribution yet. Be the first to share a take.
Discover more insights with our comprehensive chart collection
Explore All 8012 Charts