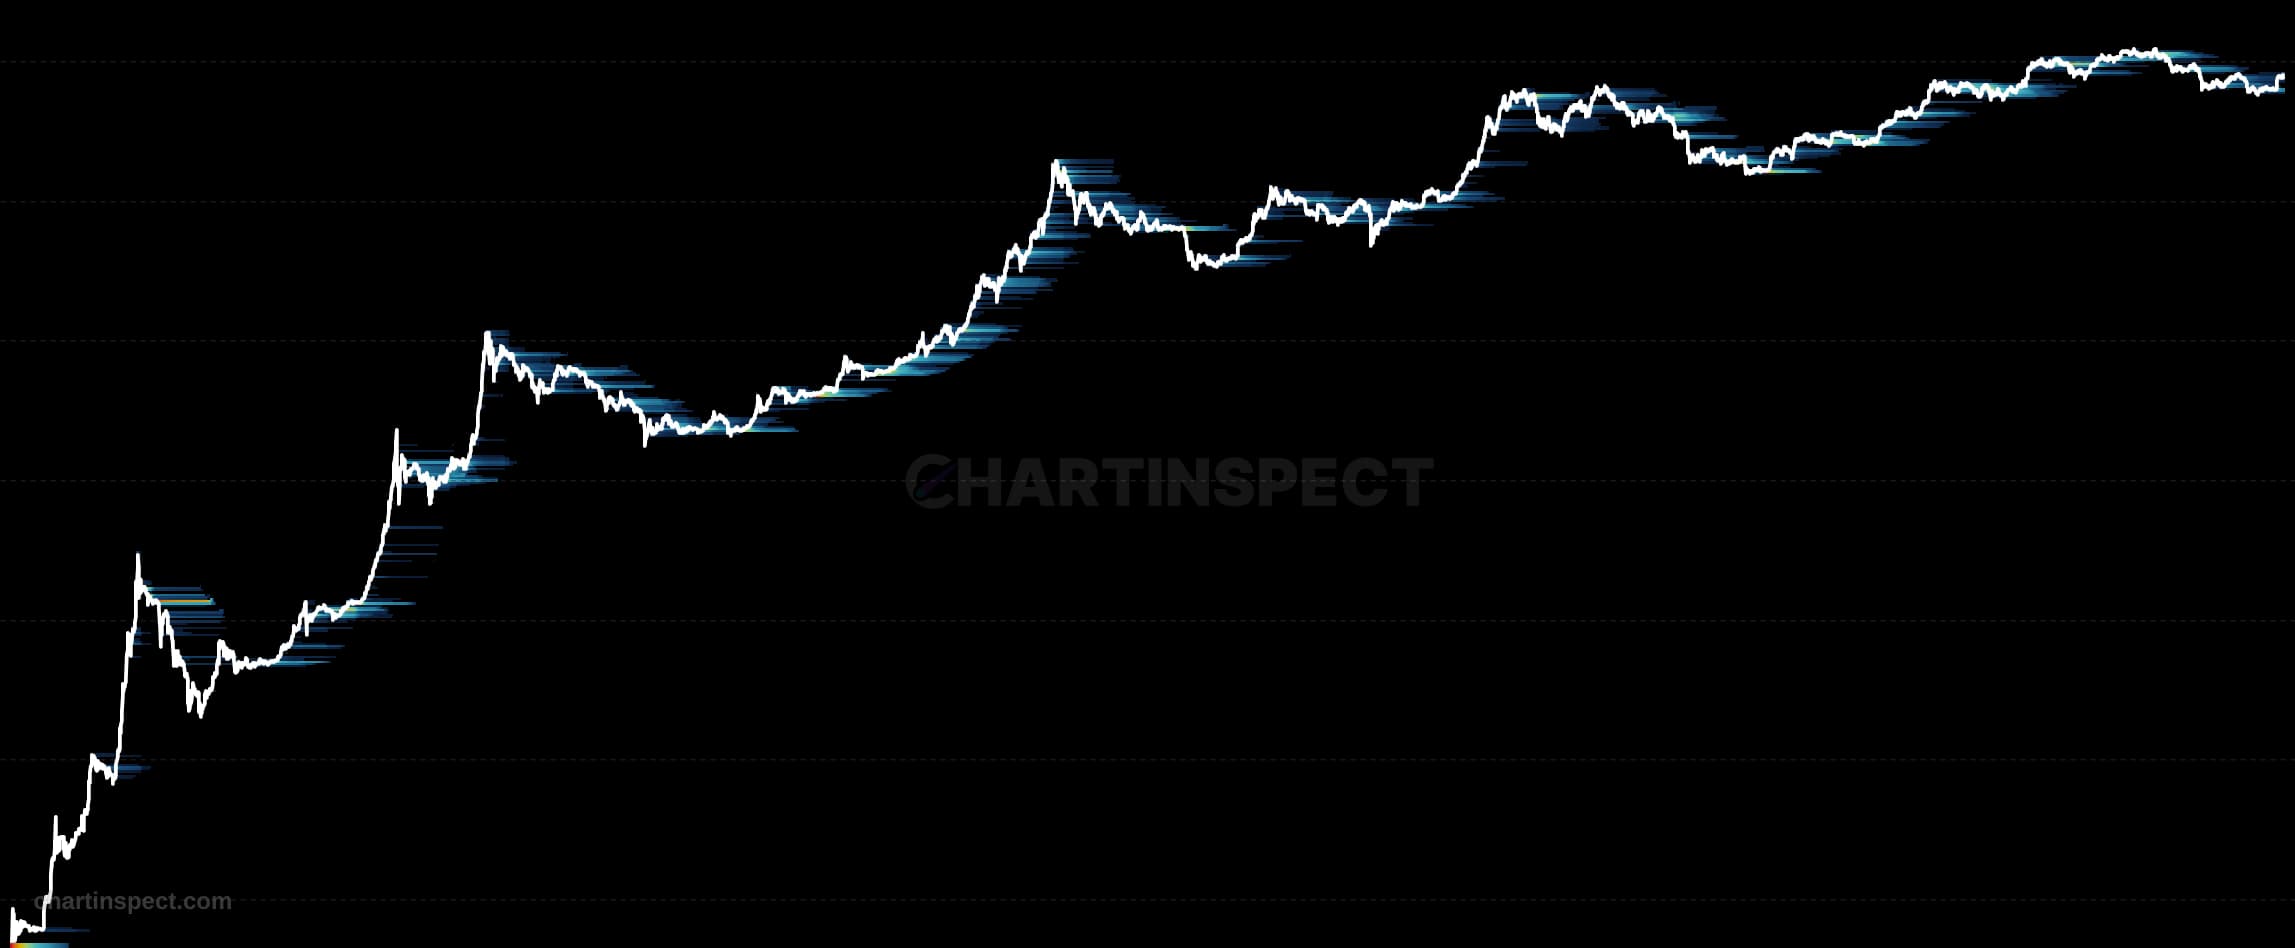
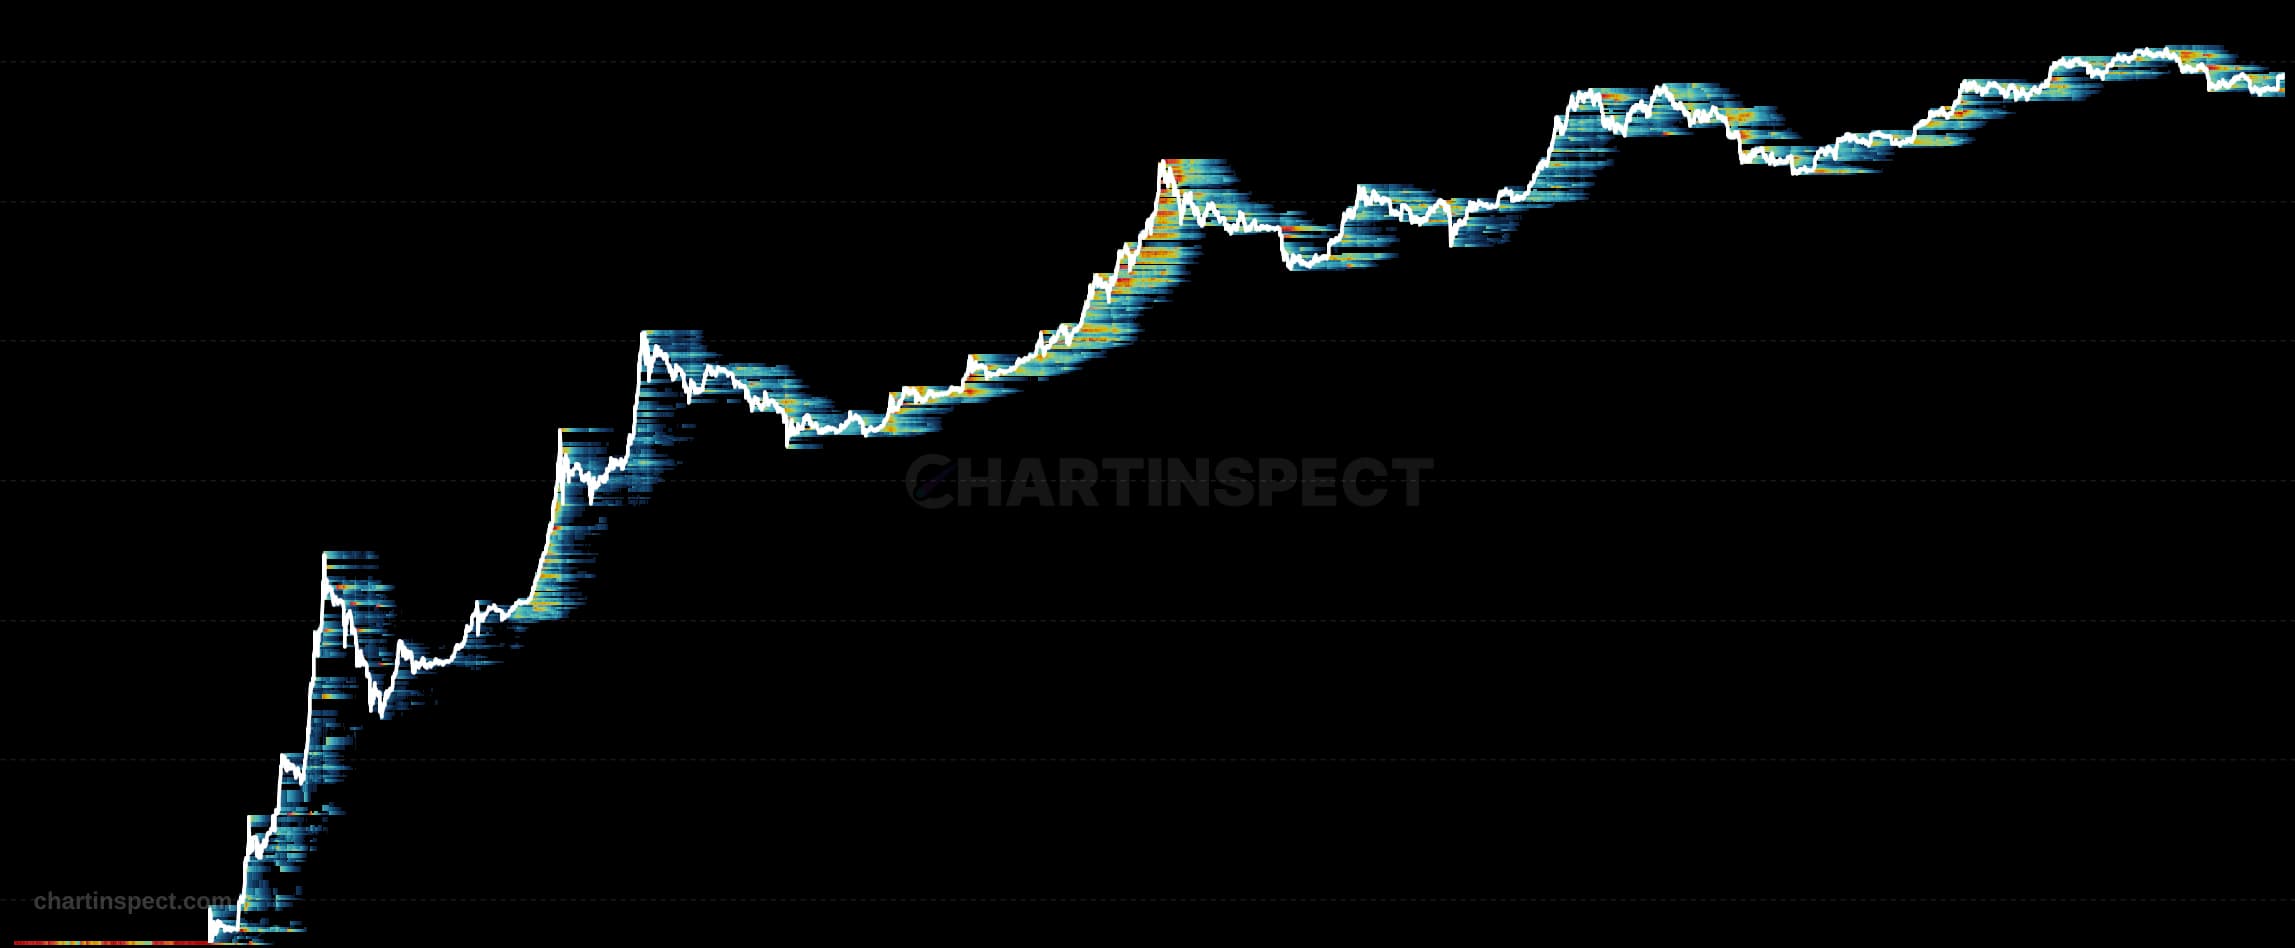
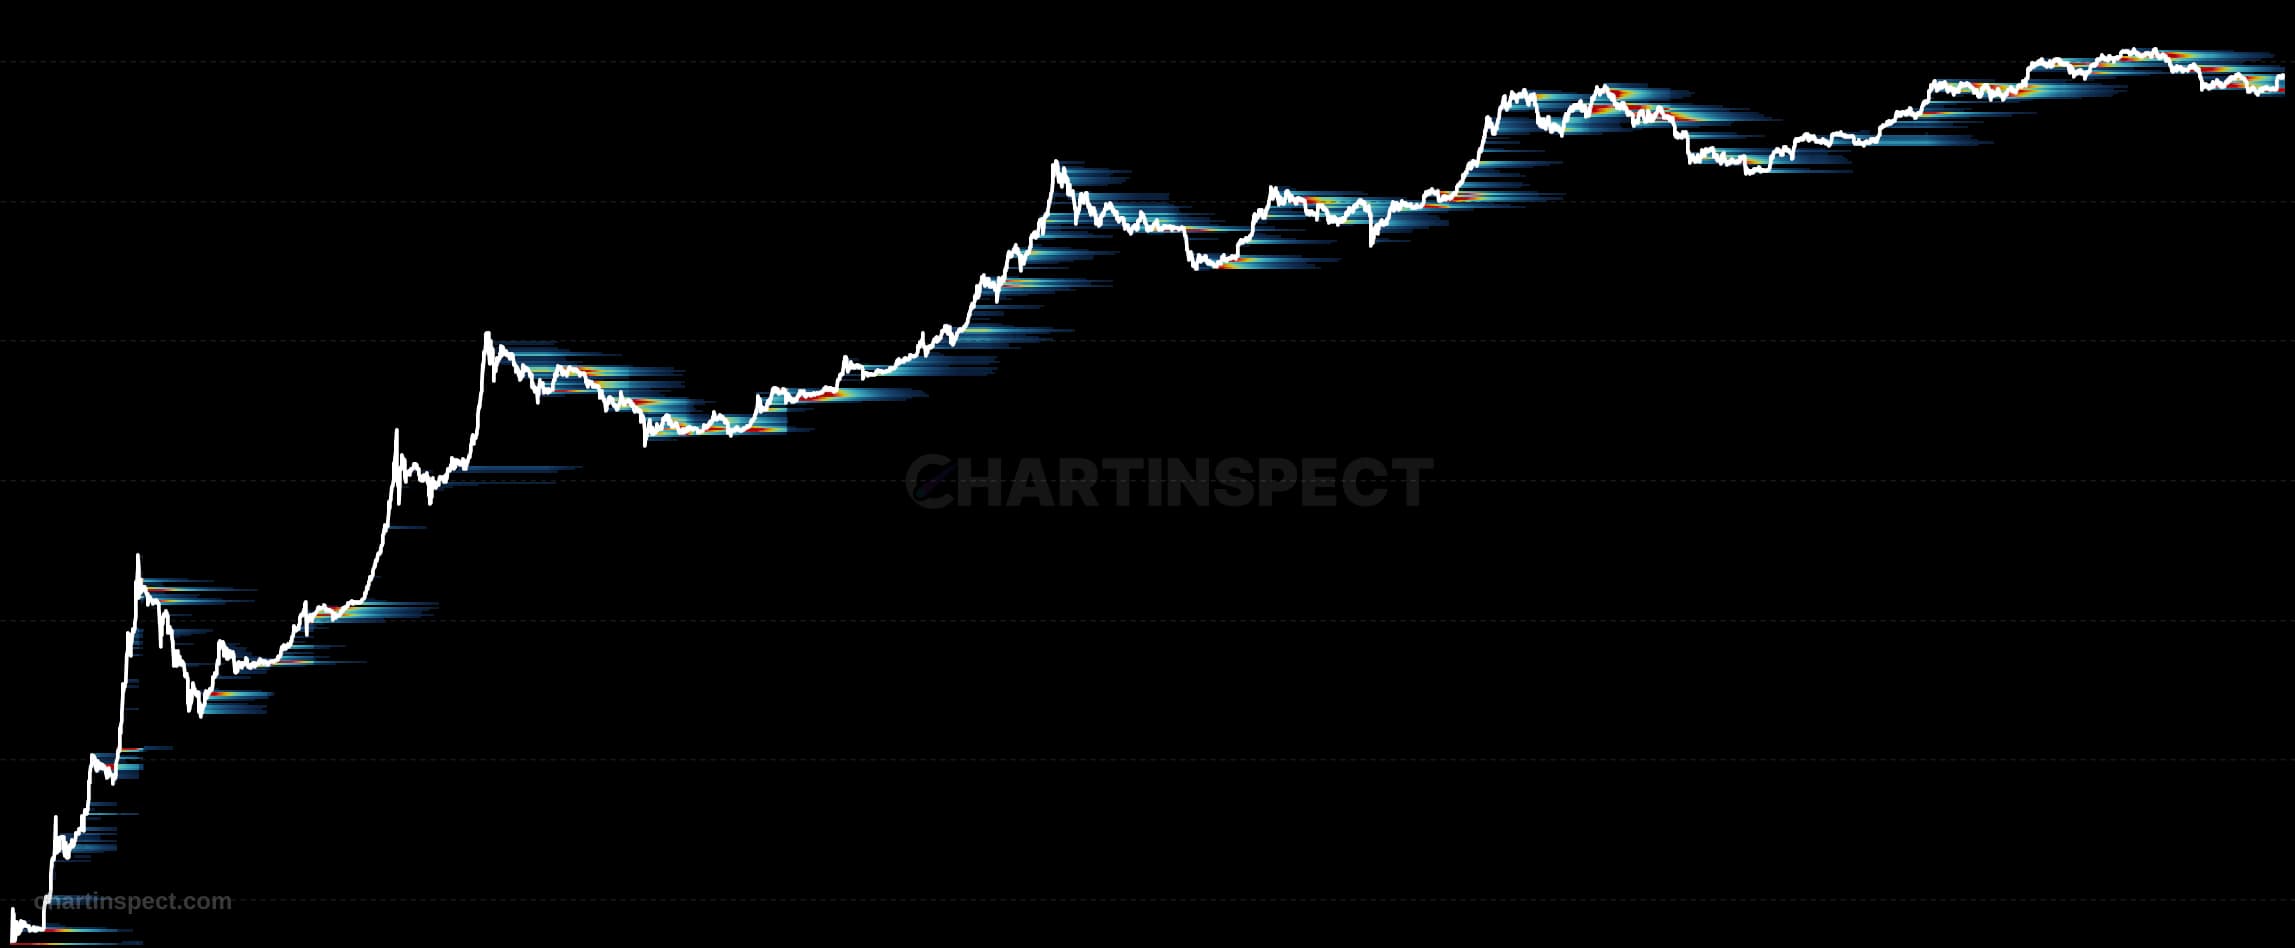
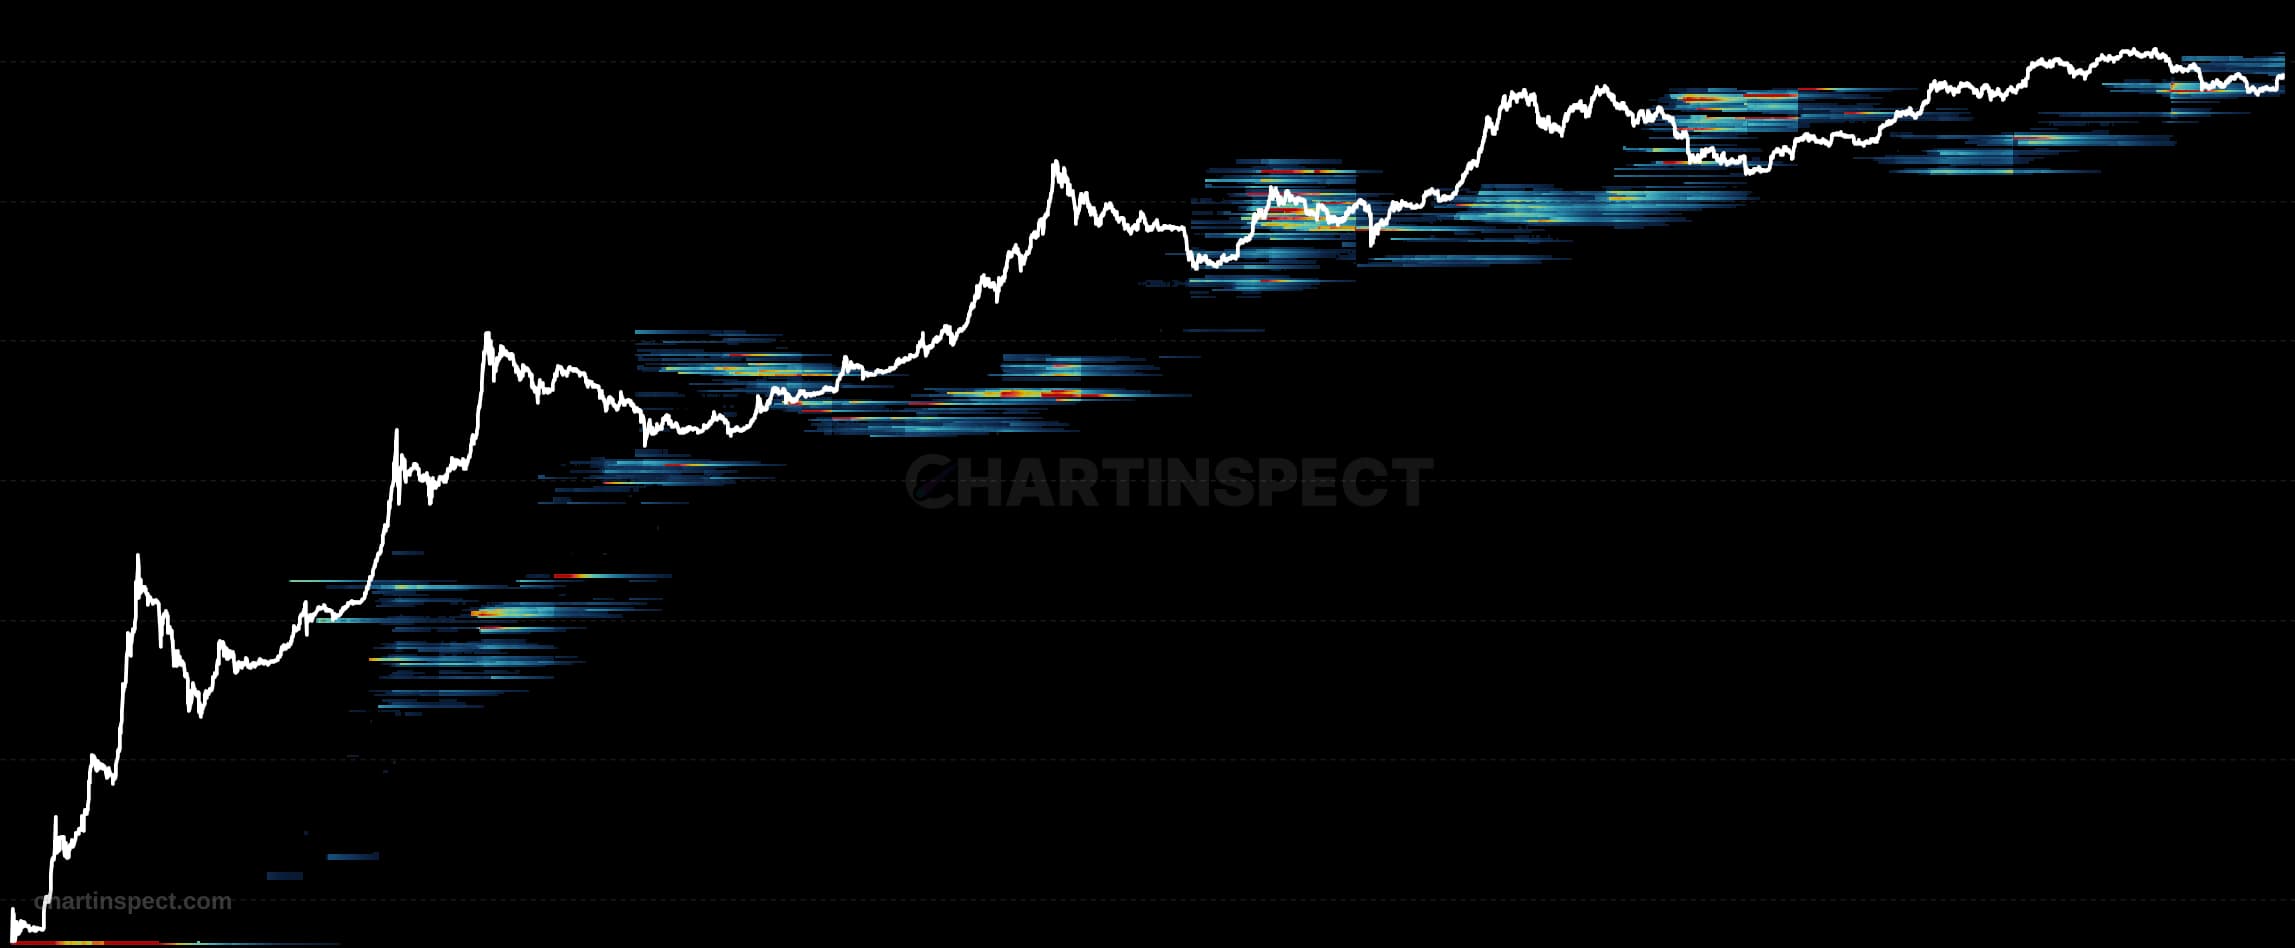
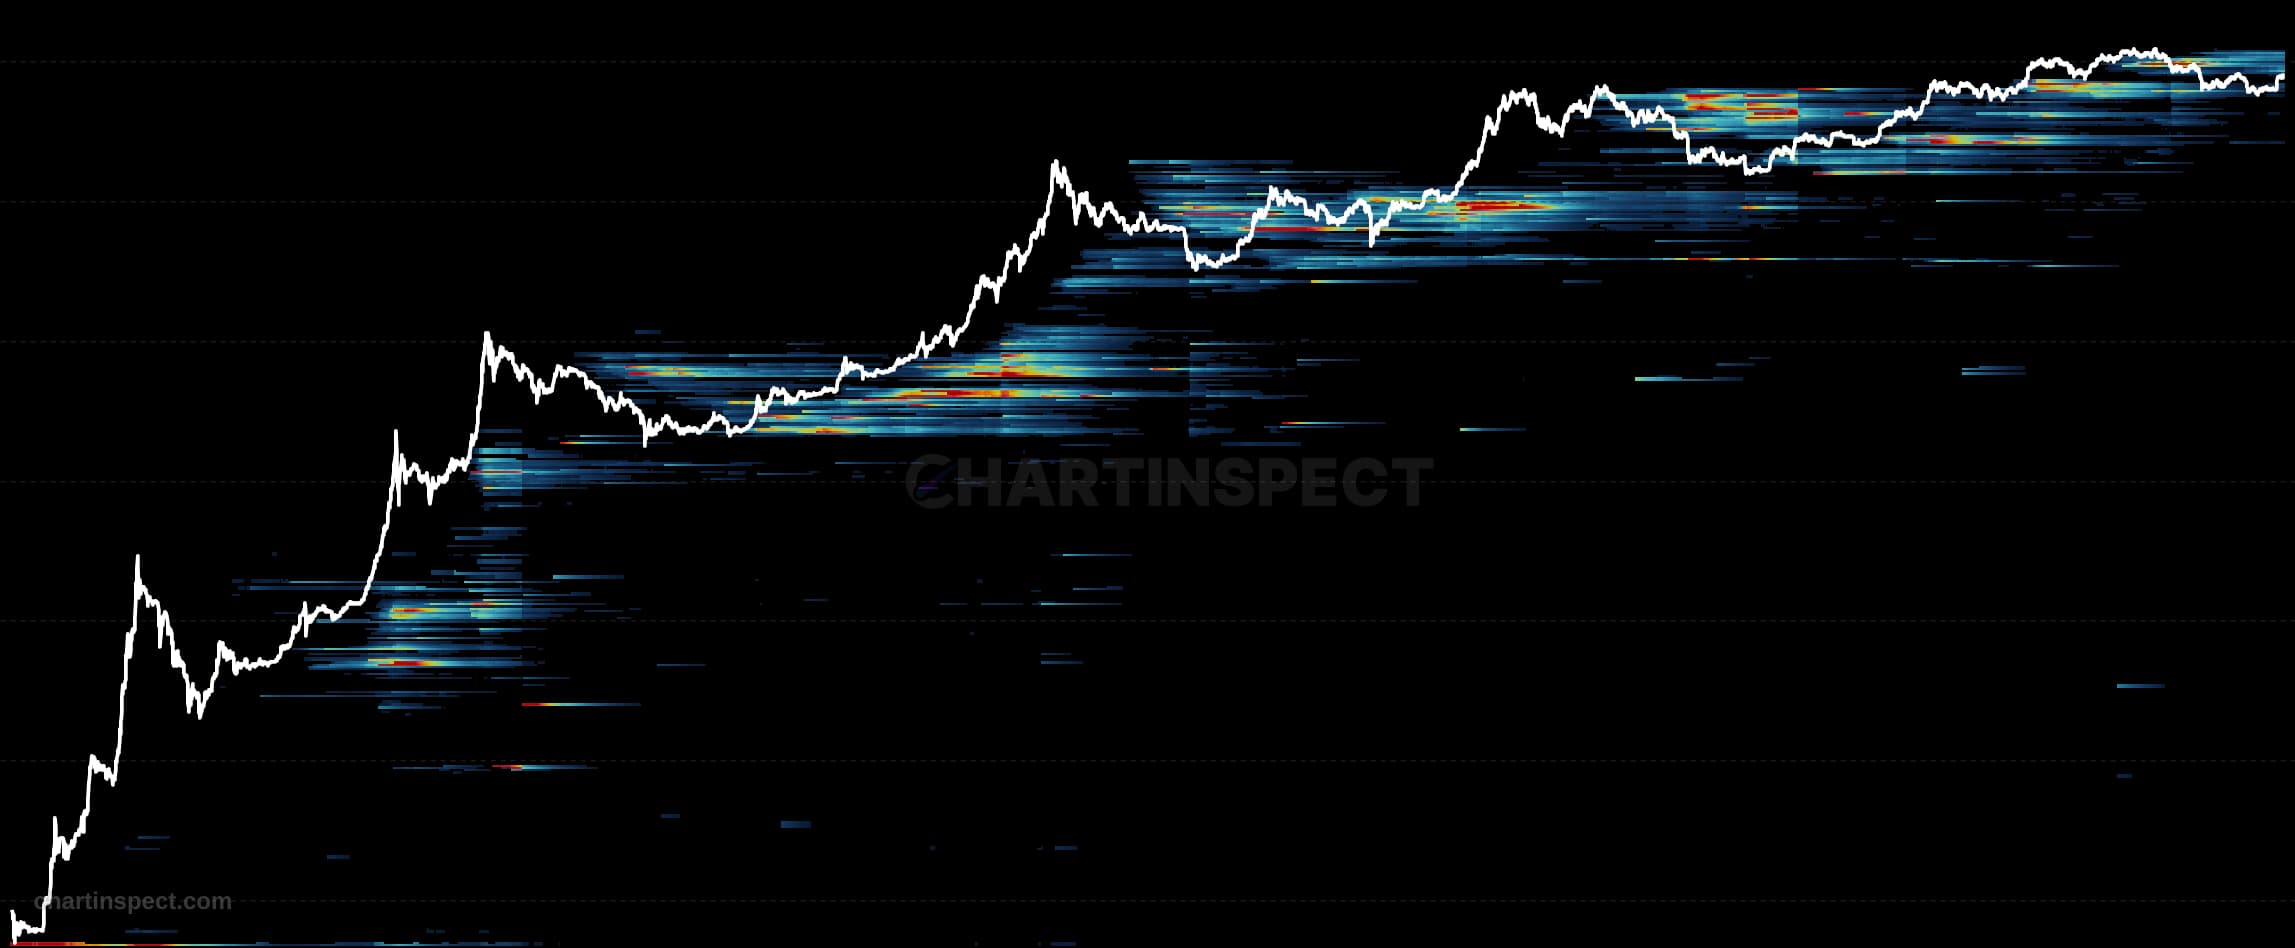
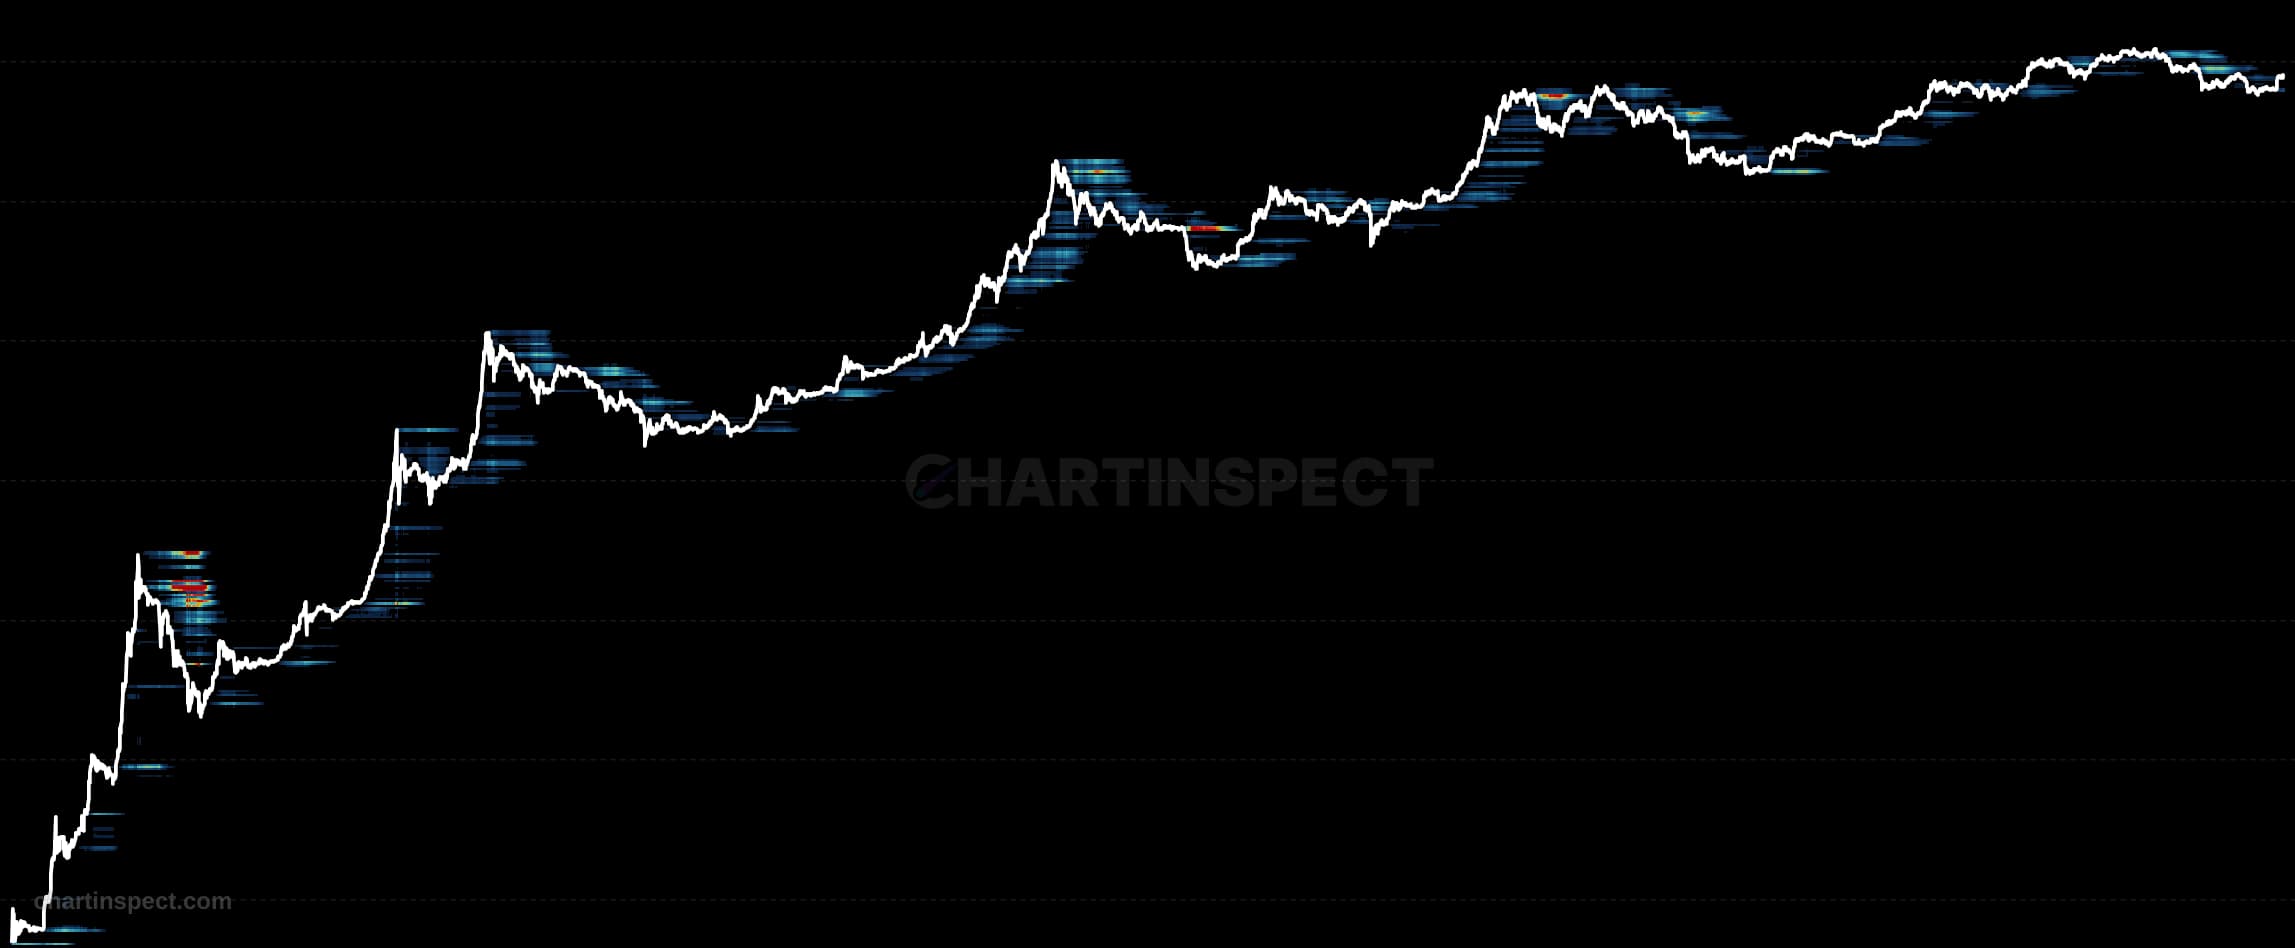
The Bitcoin STH SOPD Heatmap plots the daily Spent Output Price Distribution restricted to Short-Term Holder spends. For every day, ChartInspect takes the coins that moved on-chain that day, keeps only those held by Short-Term Holders, and buckets each spent output by the price at which it originally last moved. The result is a two-dimensional heatmap: time runs along the horizontal axis, the acquisition-price band of the spent coins runs along the vertical axis, and color intensity encodes how much Short-Term Holder supply was spent from each price band on each day.
Read the map by where the hot clusters sit relative to the live Bitcoin price. Hot clusters near recent prices indicate panic-selling by the network's most recent buyers, coins that were acquired close to the current level and are being spent almost immediately. Clusters that form below the market price instead reflect profit-taking on rebounds, where Short-Term Holders who bought lower are realizing gains. Cool, empty regions mean little Short-Term Holder supply is moving from those price bands.
Use the heatmap to gauge short-term conviction and capitulation. Bright bands hugging the price line during a drawdown mark fresh holders capitulating at a loss, often a sign of local exhaustion, while persistent below-market clusters on strength show recent buyers steadily taking profit into the move. Because it isolates only Short-Term Holder behavior, this chart is best read alongside its Long-Term Holder counterpart to separate reactive selling from vintage-coin distribution.
Check the selected asset, units, and cohort before comparing readings. Compare the metric over consistent dates and use related measures to understand what contributes to a change.