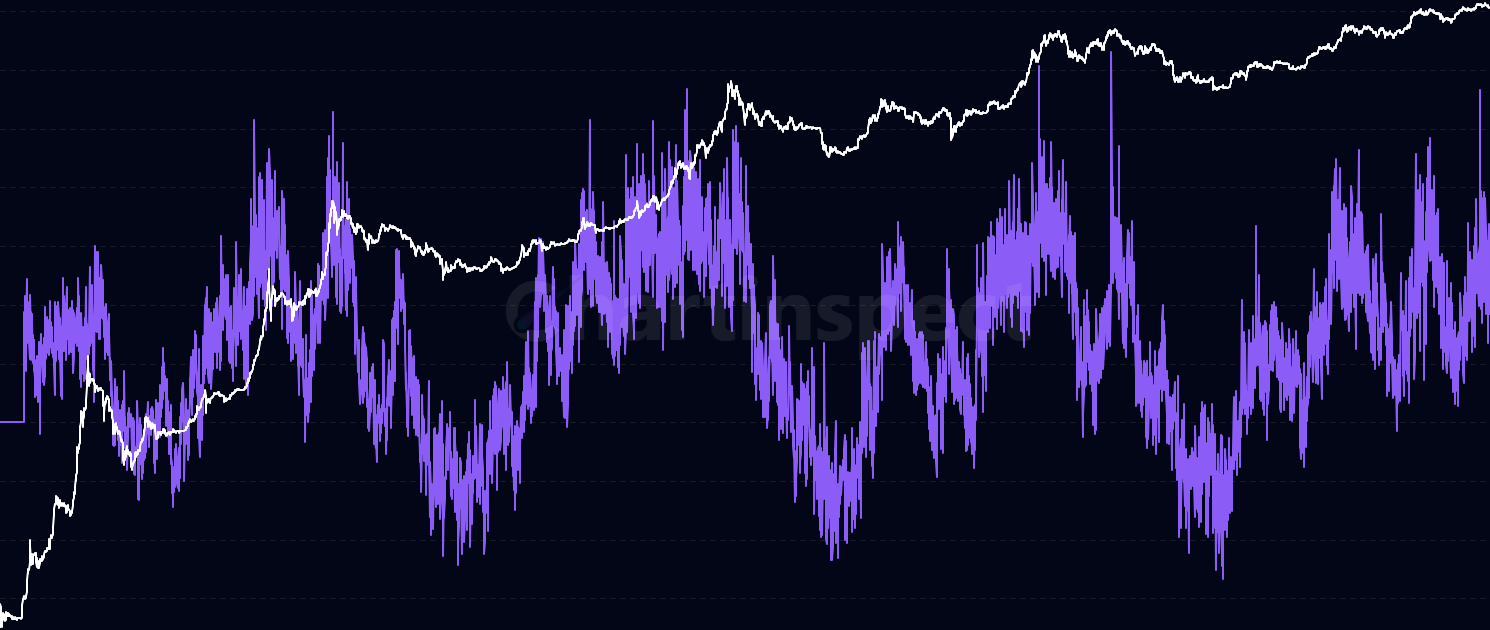
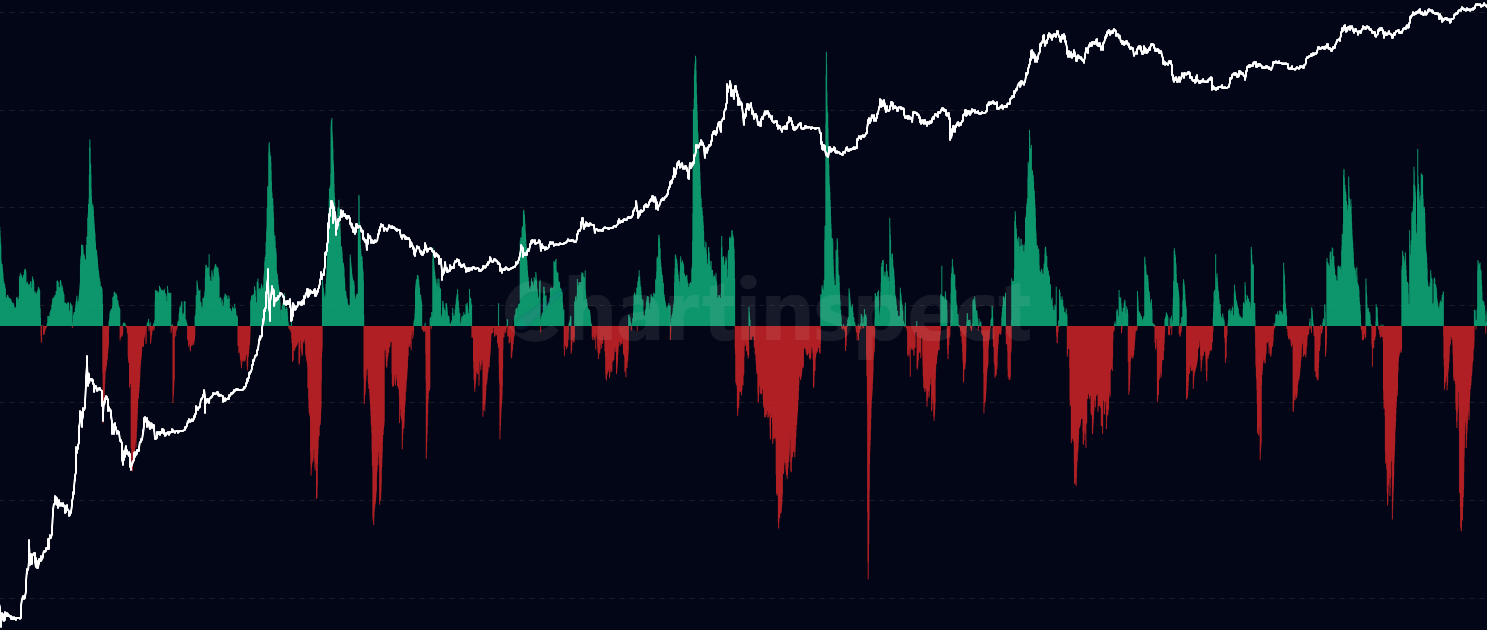
Supply Last Active 1yr+ Net Position Change - Bitcoin & Cryptocurrency Analysis
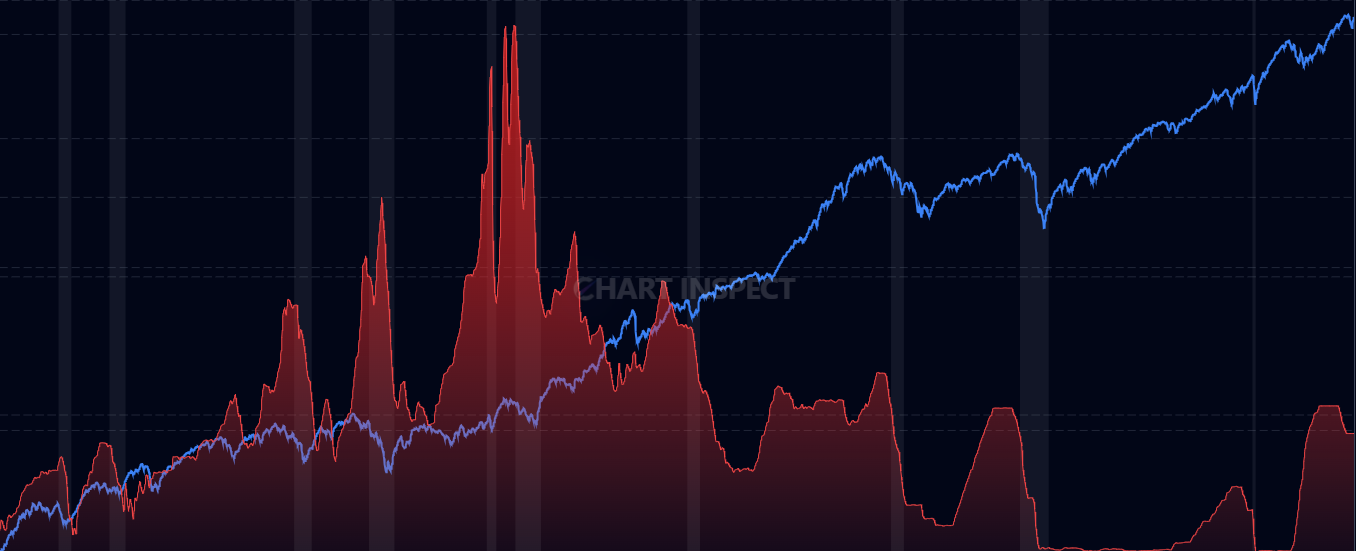
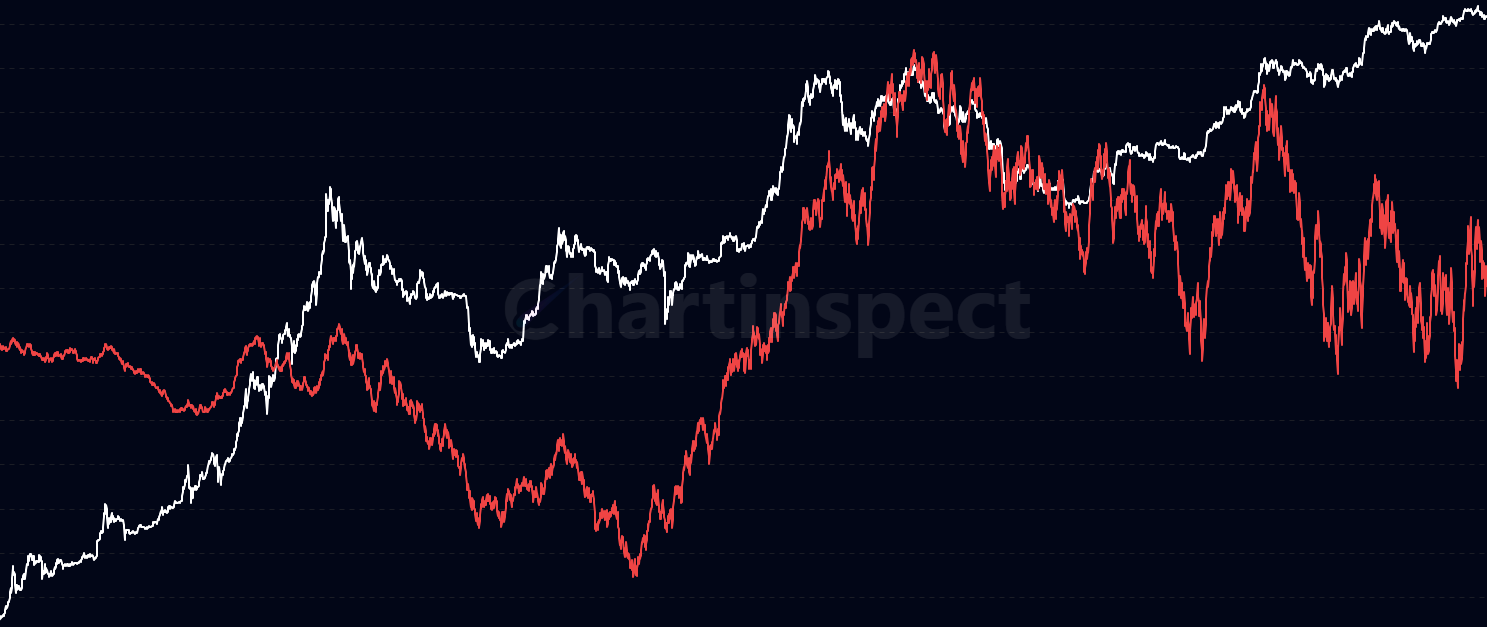
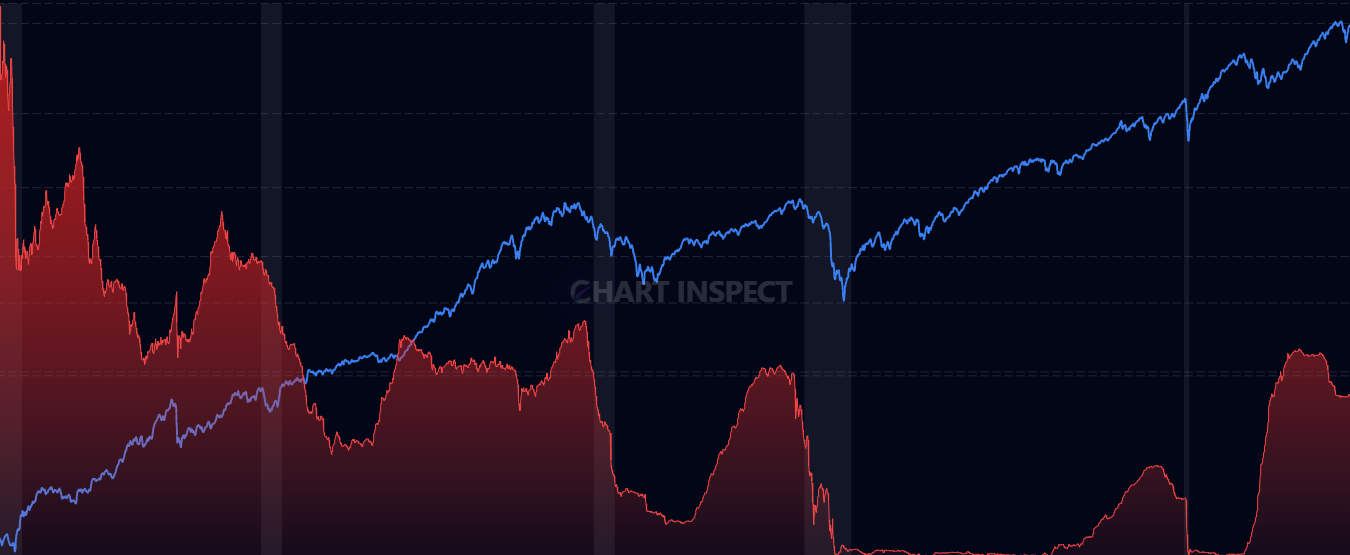
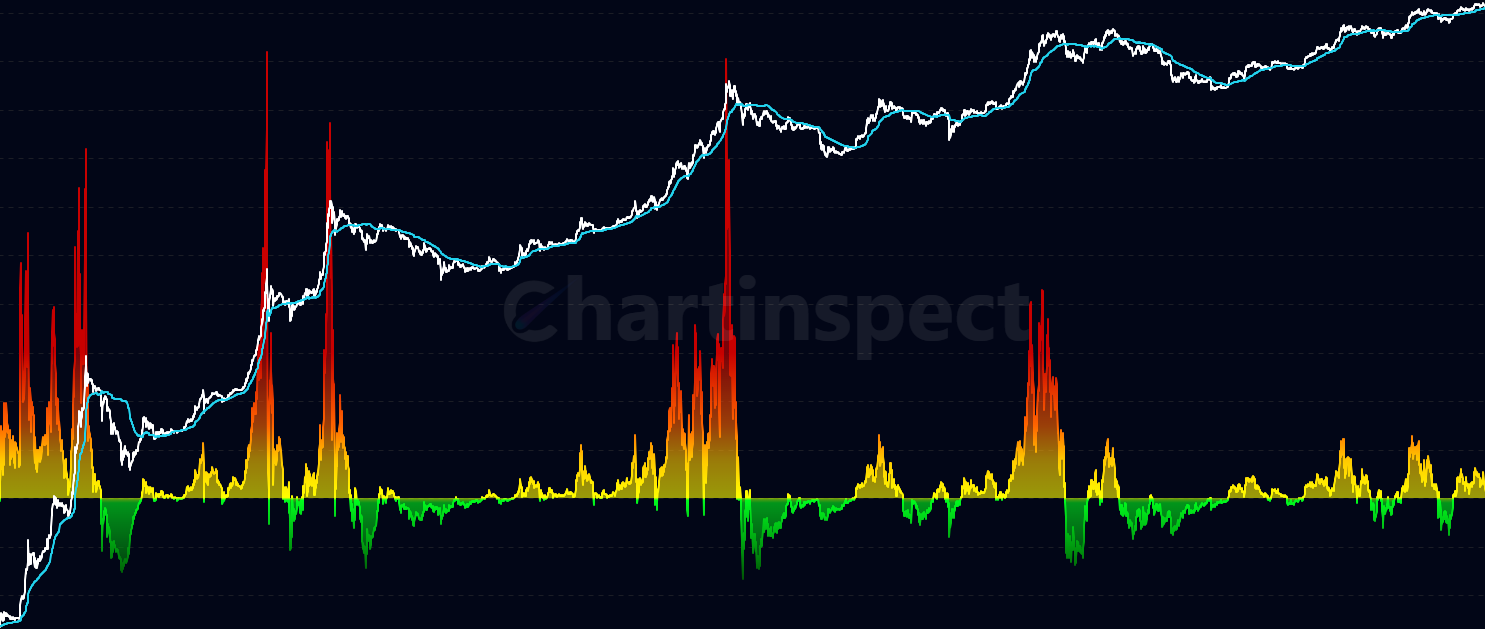
Analyze Bitcoin market cycles through the supply of coins last active 1 year or more. During bull markets, this supply depletes as LTHs distribute; during bear markets, it increases as new conviction holders accumulate. The oscillator shows daily net position change - positive indicates accumulation, negative indicates distribution.
About Supply Last Active 1yr+ Net Position Change
This on-chain metrics chart provides professional-grade analysis for Bitcoin and cryptocurrency markets. The supply last active 1yr+ net position change indicator is part of ChartInspect's comprehensive suite of blockchain analytics tools, designed to help traders and investors make informed decisions based on on-chain blockchain data.
Key Features
Real-time on-chain metrics data visualization
Historical Bitcoin and cryptocurrency market analysis
Interactive charting with zoom and timeframe selection
Mobile-responsive design for trading on the go
How to Use Supply Last Active 1yr+ Net Position Change
Navigate through different timeframes to analyze economic trends. Use the interactive features to zoom into specific periods and identify key on-chain signalsthat can inform your financial investment strategy.