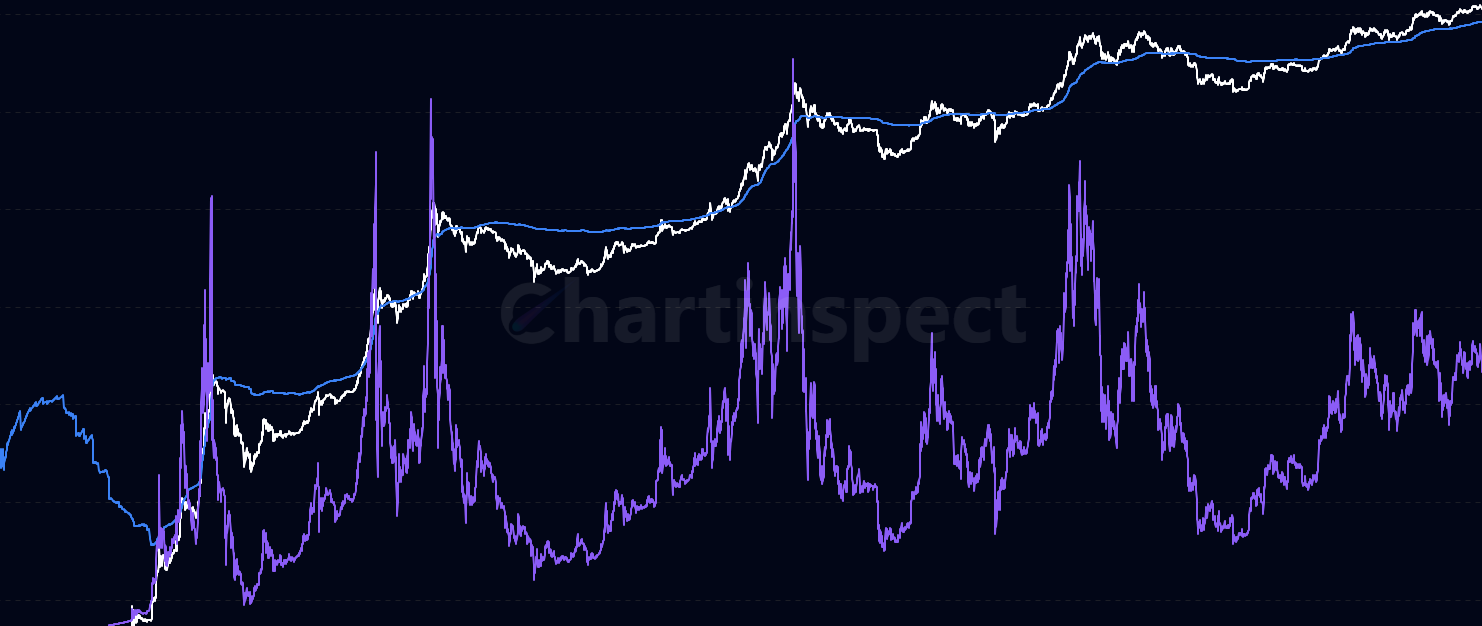
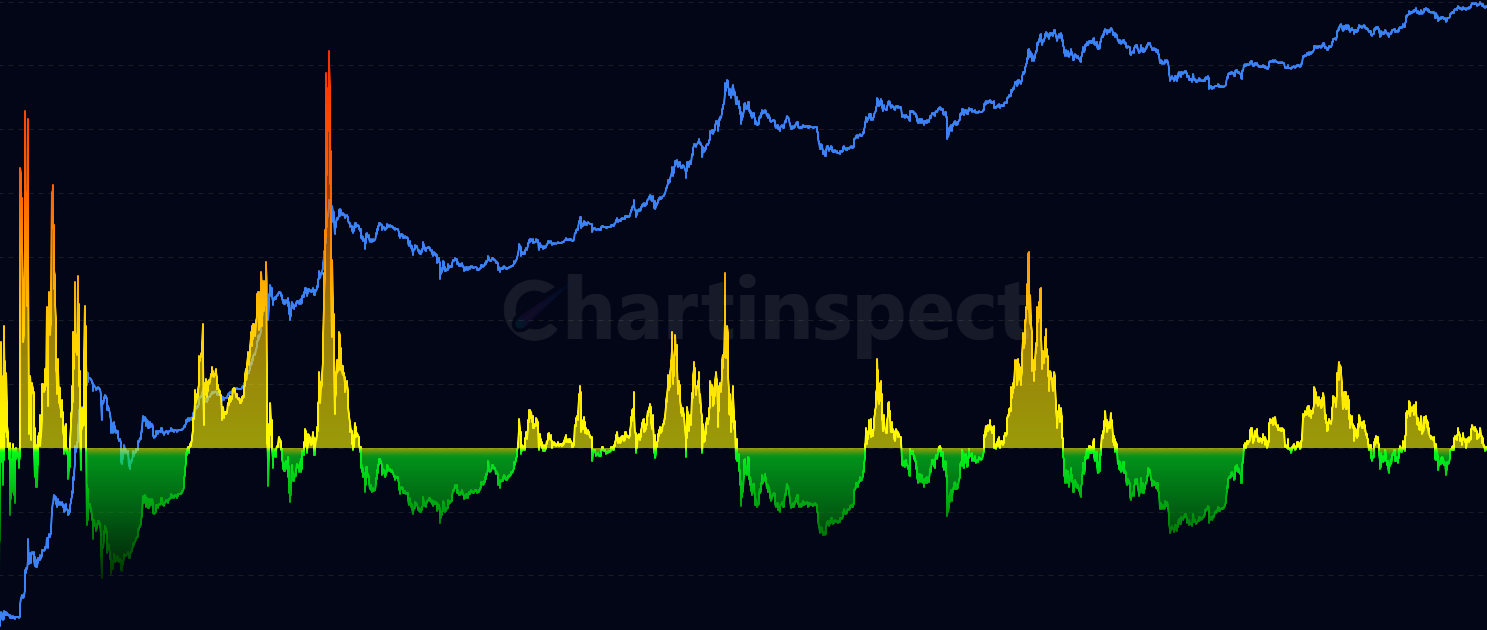
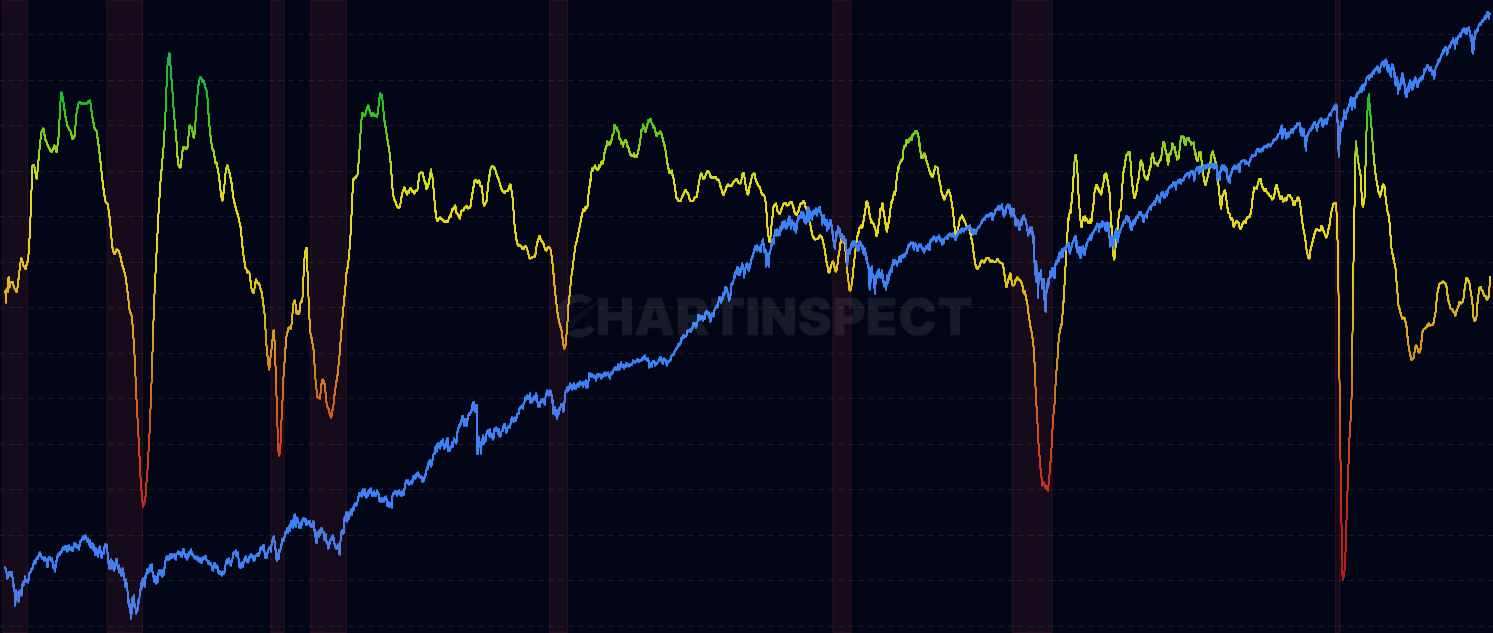
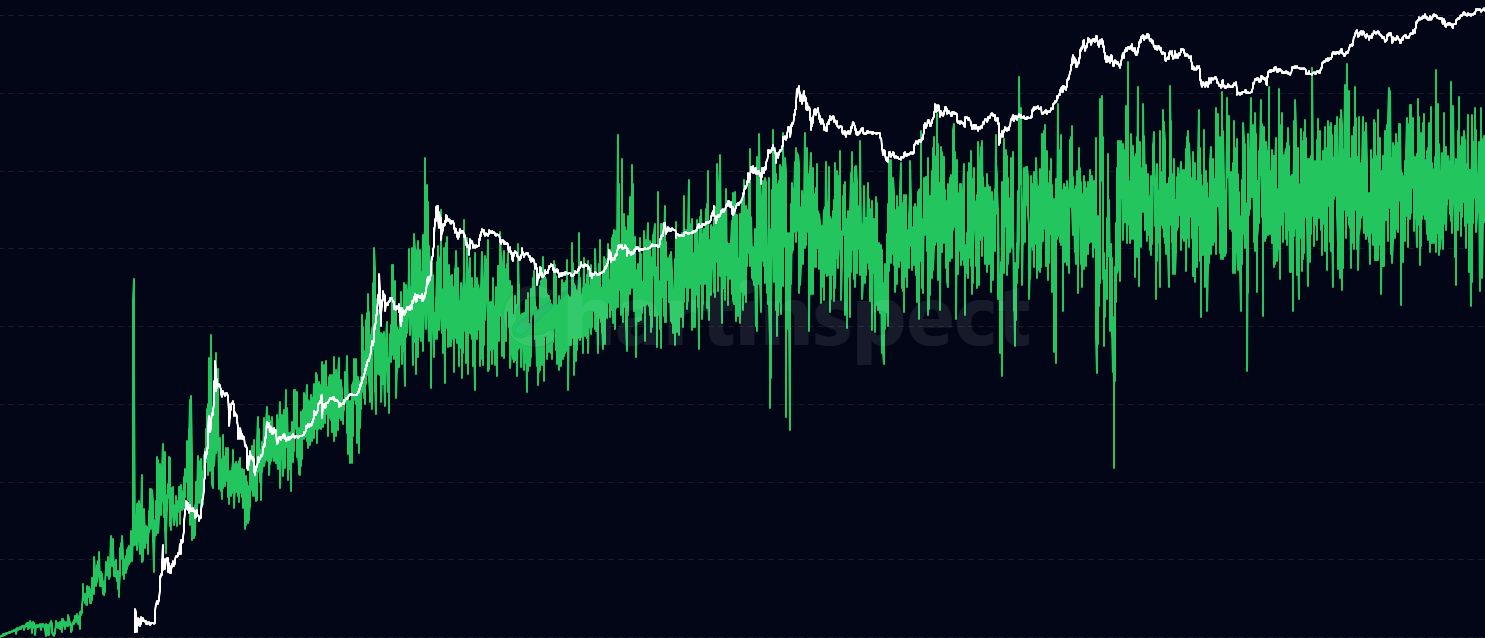
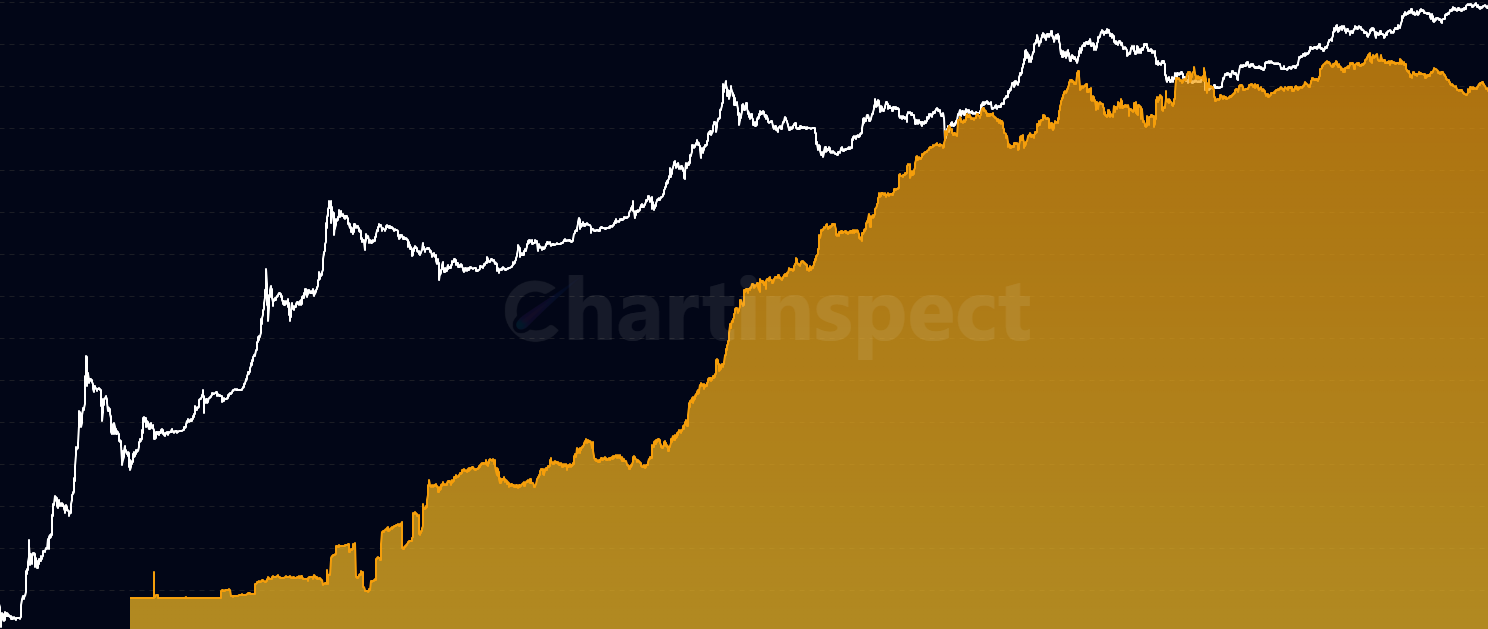
Track momentum shifts in realized profit deviation by comparing current RPD against its moving average to identify intensifying profit-taking or capitulation phases with USD/BTC denomination support
About Realized P&L Deviation Momentum
This on-chain metrics chart provides professional-grade analysis for Bitcoin and cryptocurrency markets. The realized p&l deviation momentum indicator is part of ChartInspect's comprehensive suite of blockchain analytics tools, designed to help traders and investors make informed decisions based on on-chain blockchain data.
Key Features
Real-time on-chain metrics data visualization
Historical Bitcoin and cryptocurrency market analysis
Interactive charting with zoom and timeframe selection
Mobile-responsive design for trading on the go
How to Use Realized P&L Deviation Momentum
Navigate through different timeframes to analyze economic trends. Use the interactive features to zoom into specific periods and identify key on-chain signalsthat can inform your financial investment strategy.