Loading chart data
Loading chart data
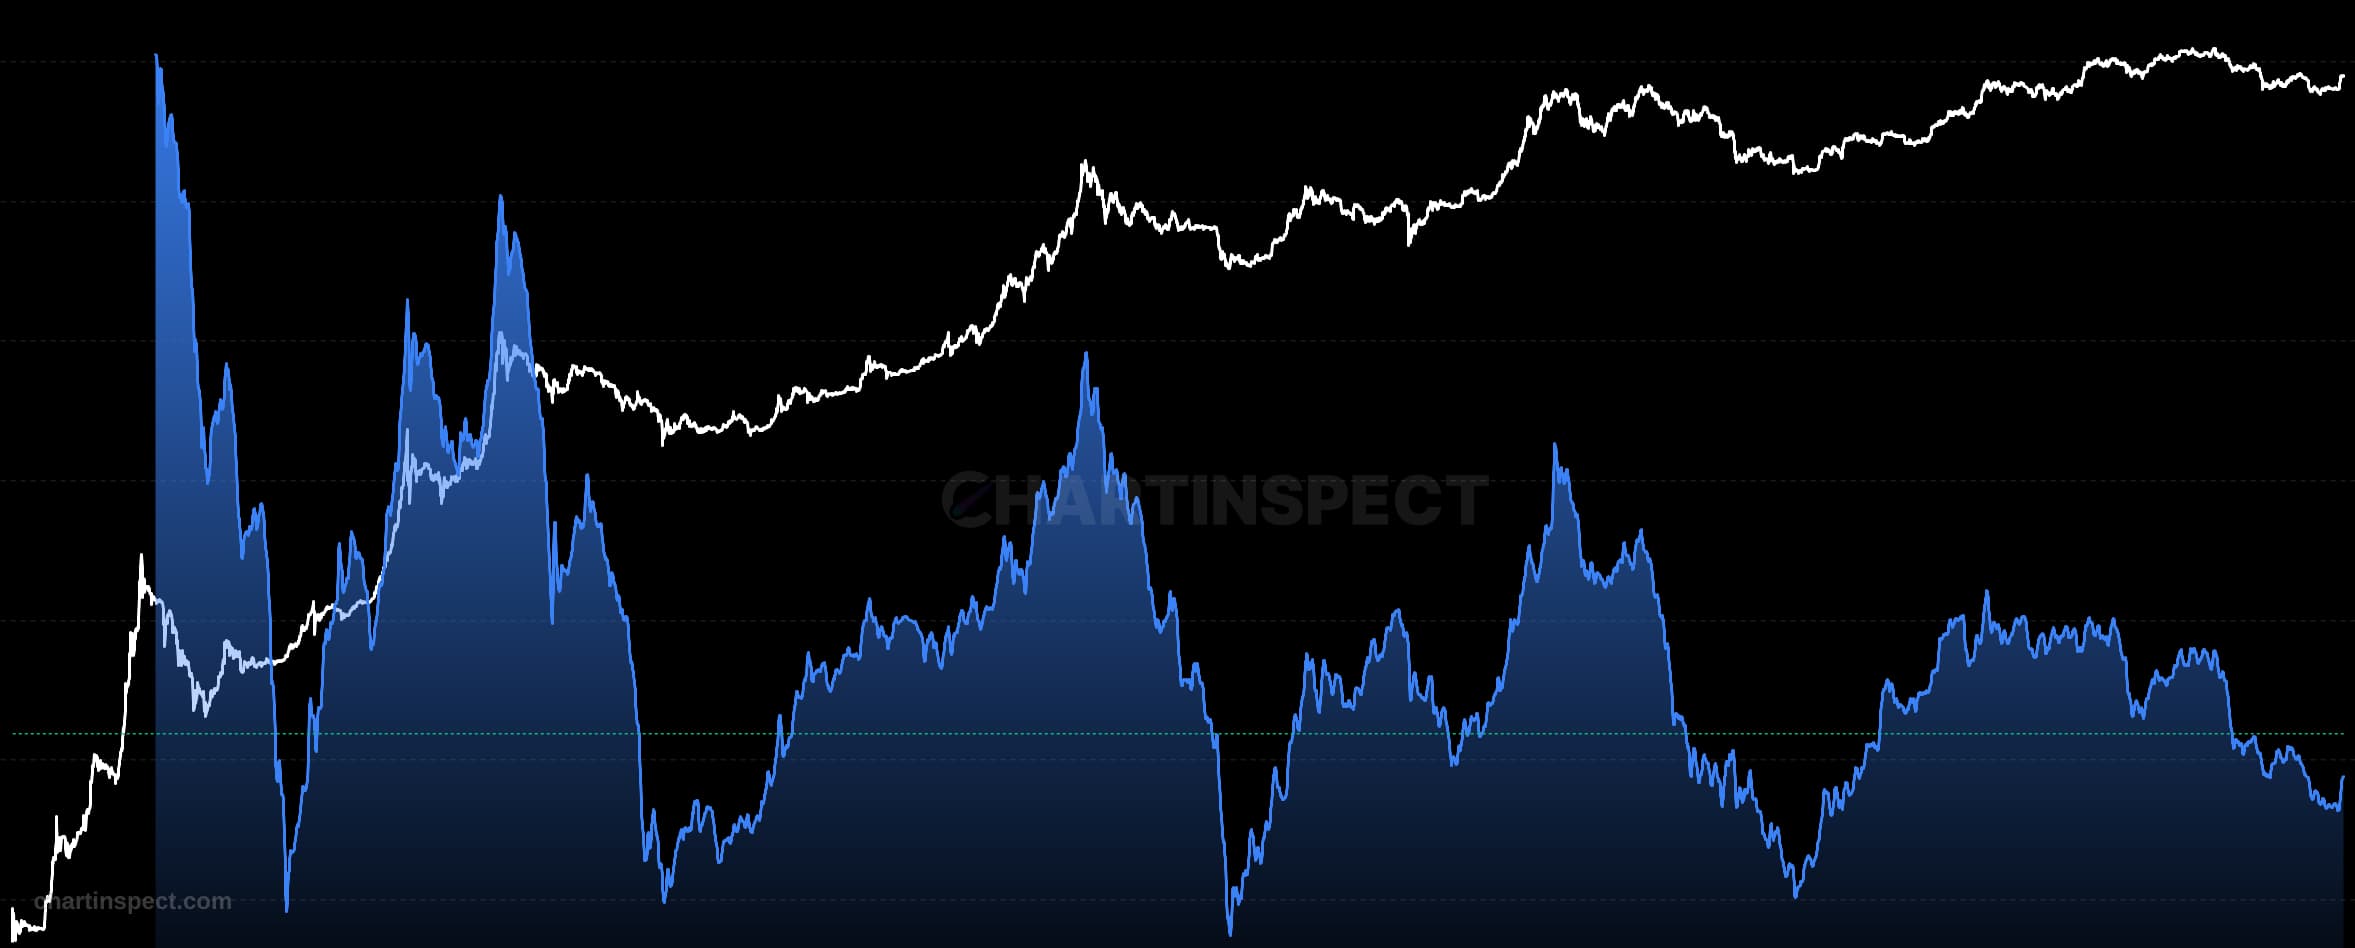
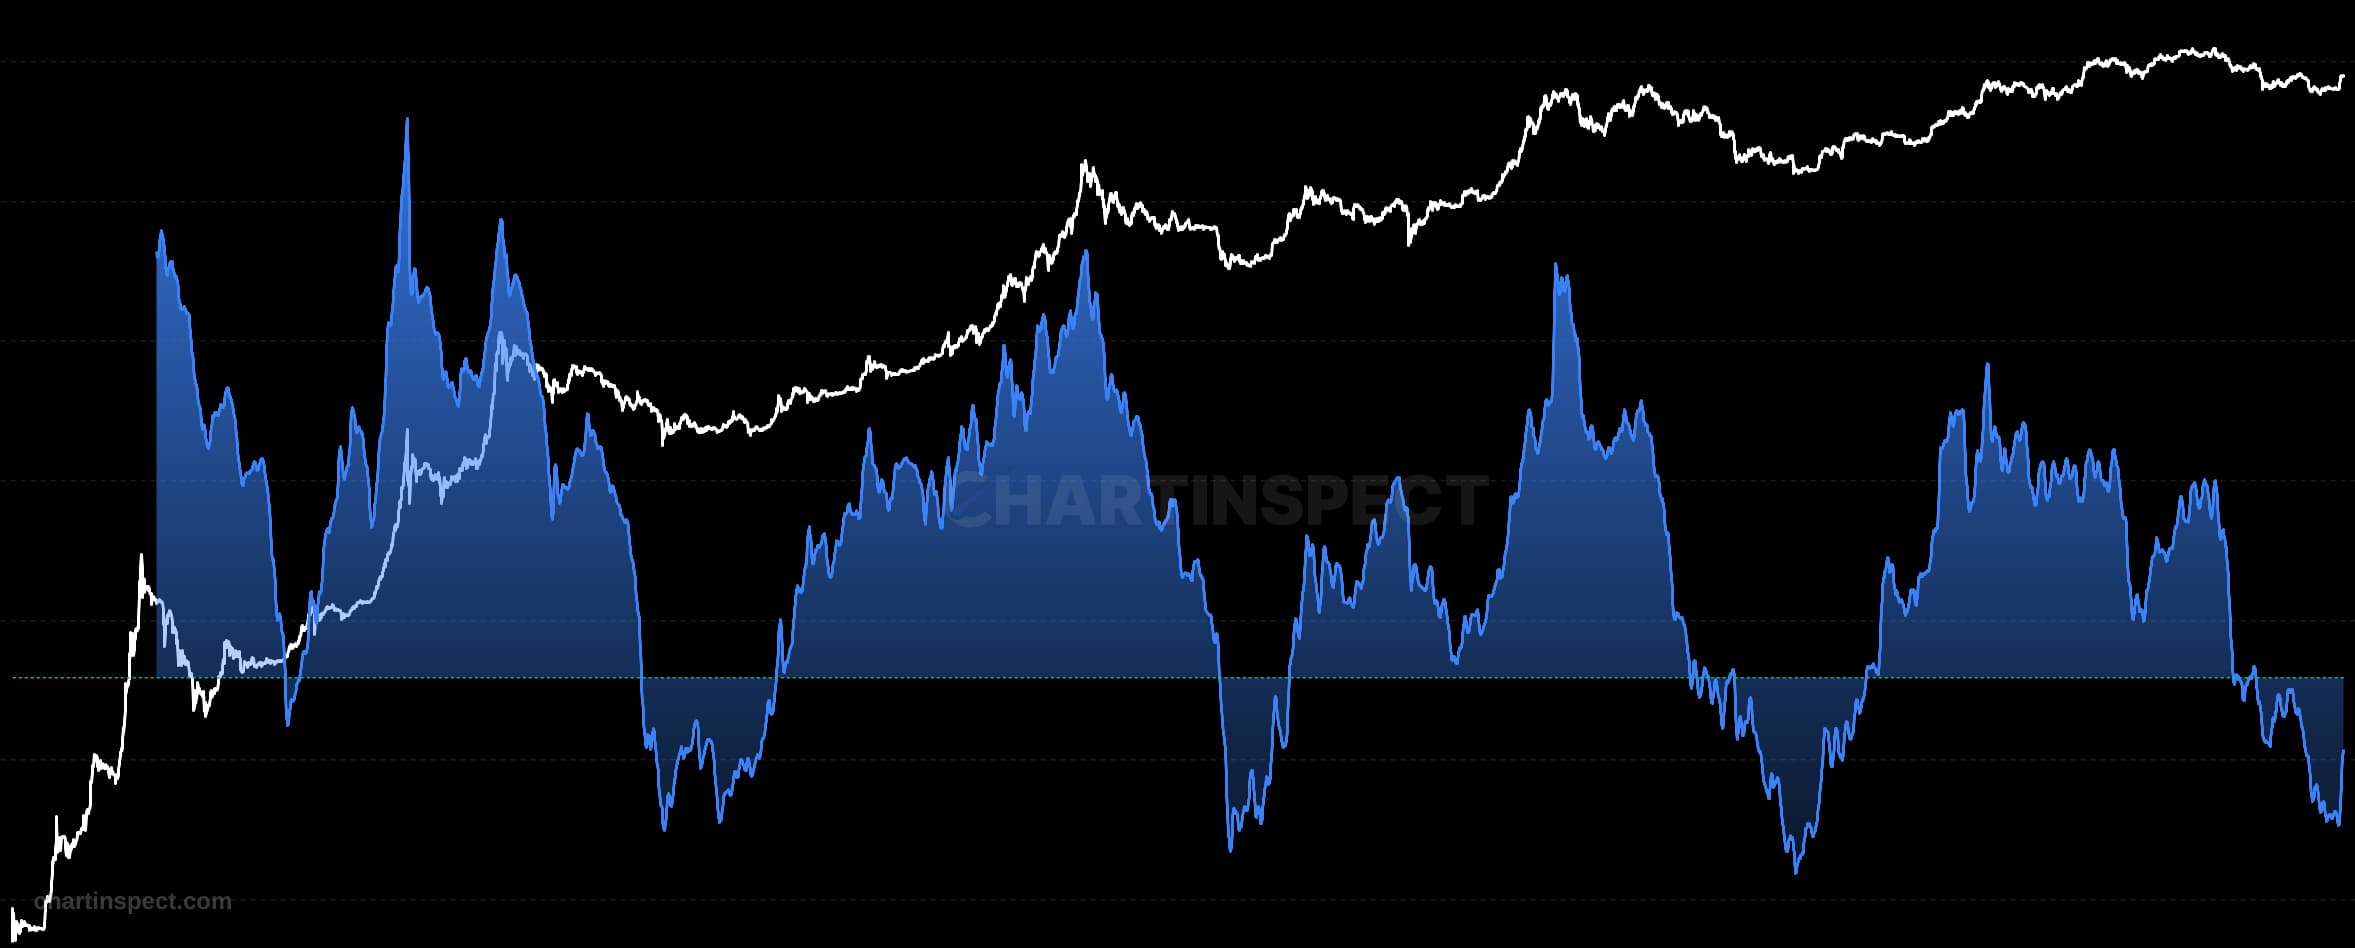
About Death Cross Analysis
Track Death Cross events (50D MA crossing below 200D MA) and analyze historical price impacts
Freshness: Not yet verified
Community snapshot
No community calls on Death Cross Analysis yet. Be the first to share a take.
Related Analytics
Discover more insights with our comprehensive chart collection
Explore All 8012 Charts