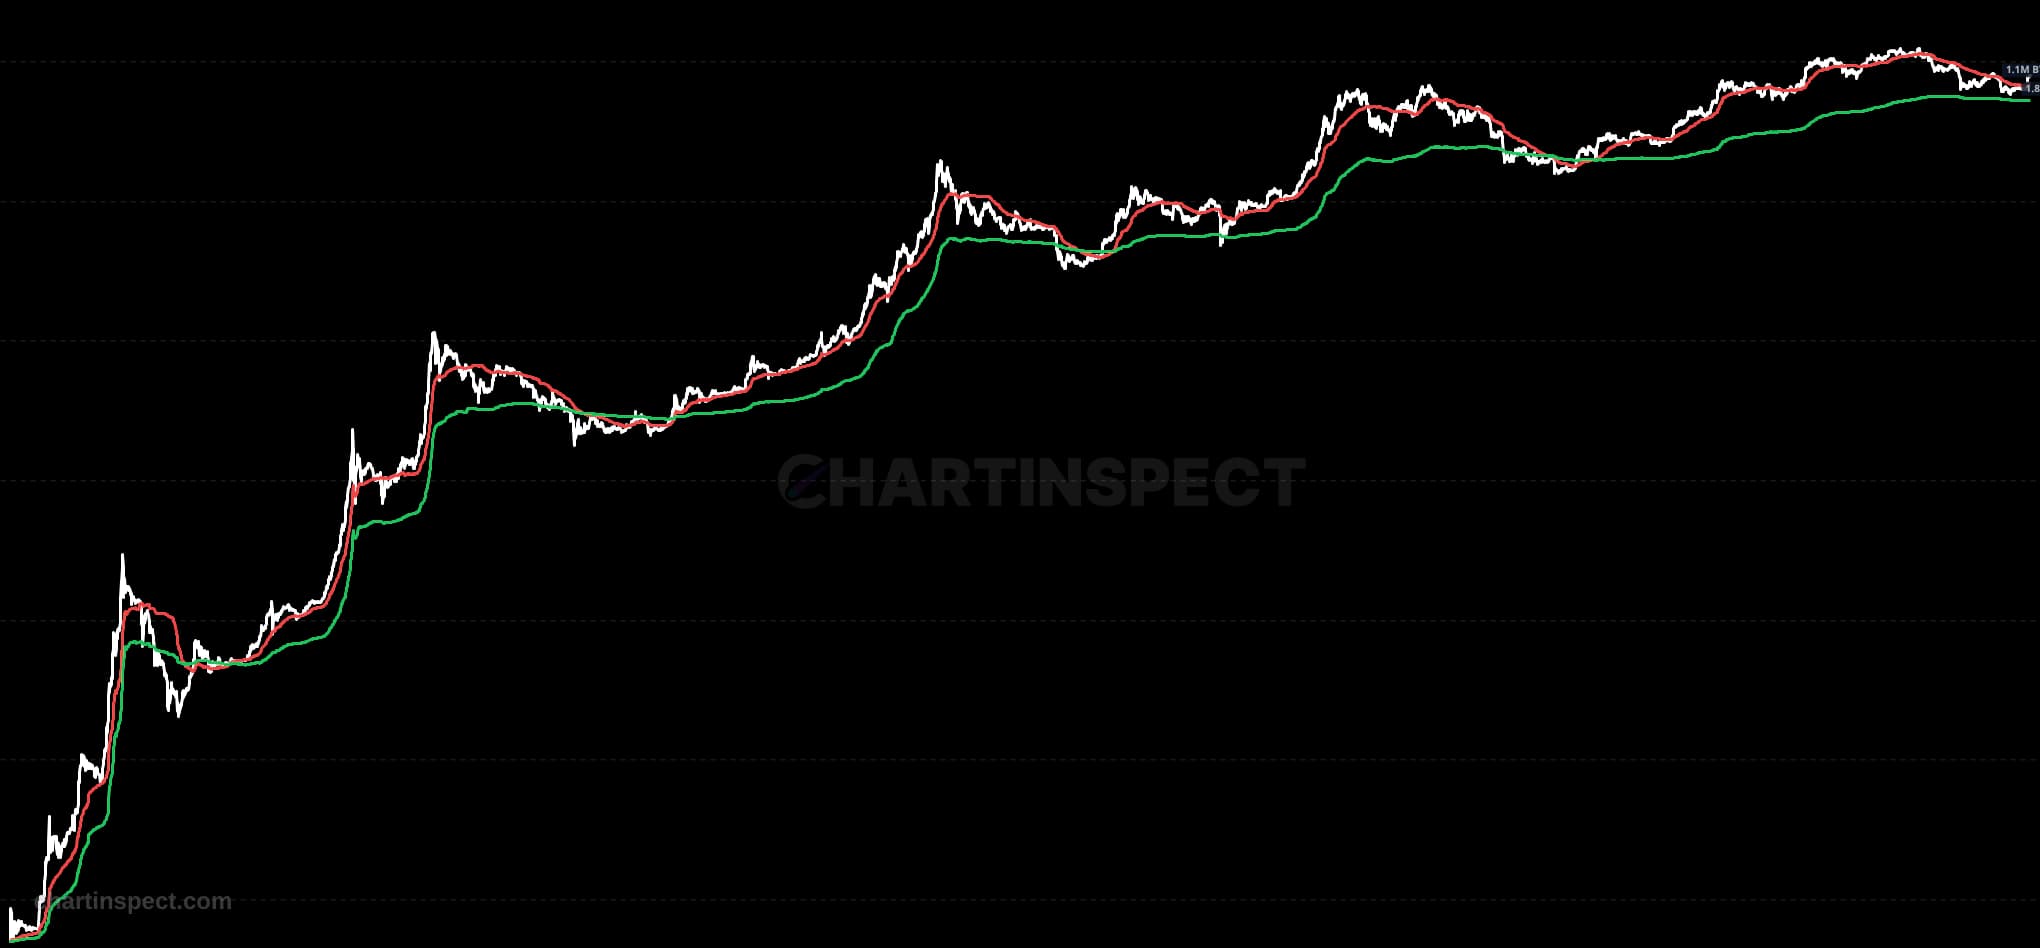
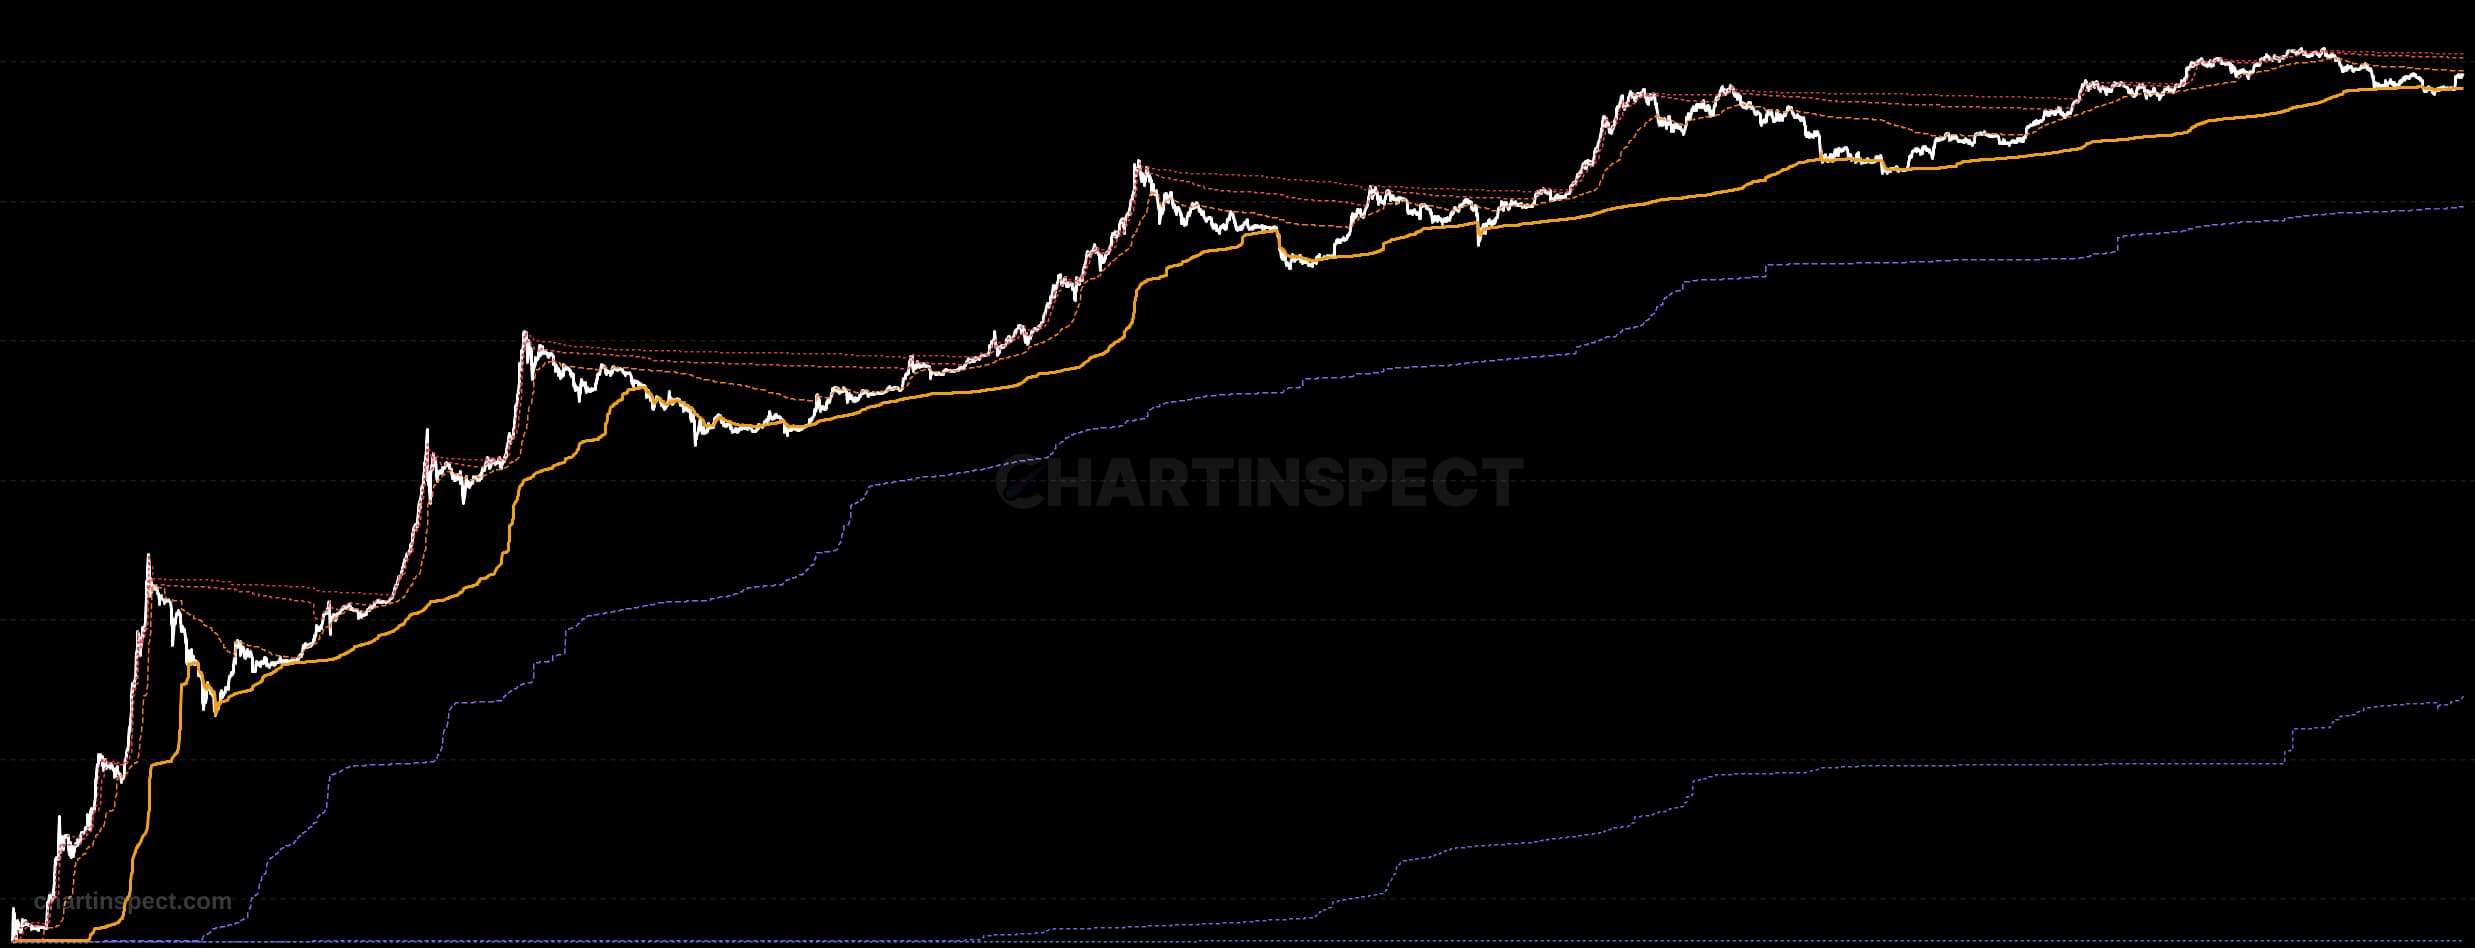
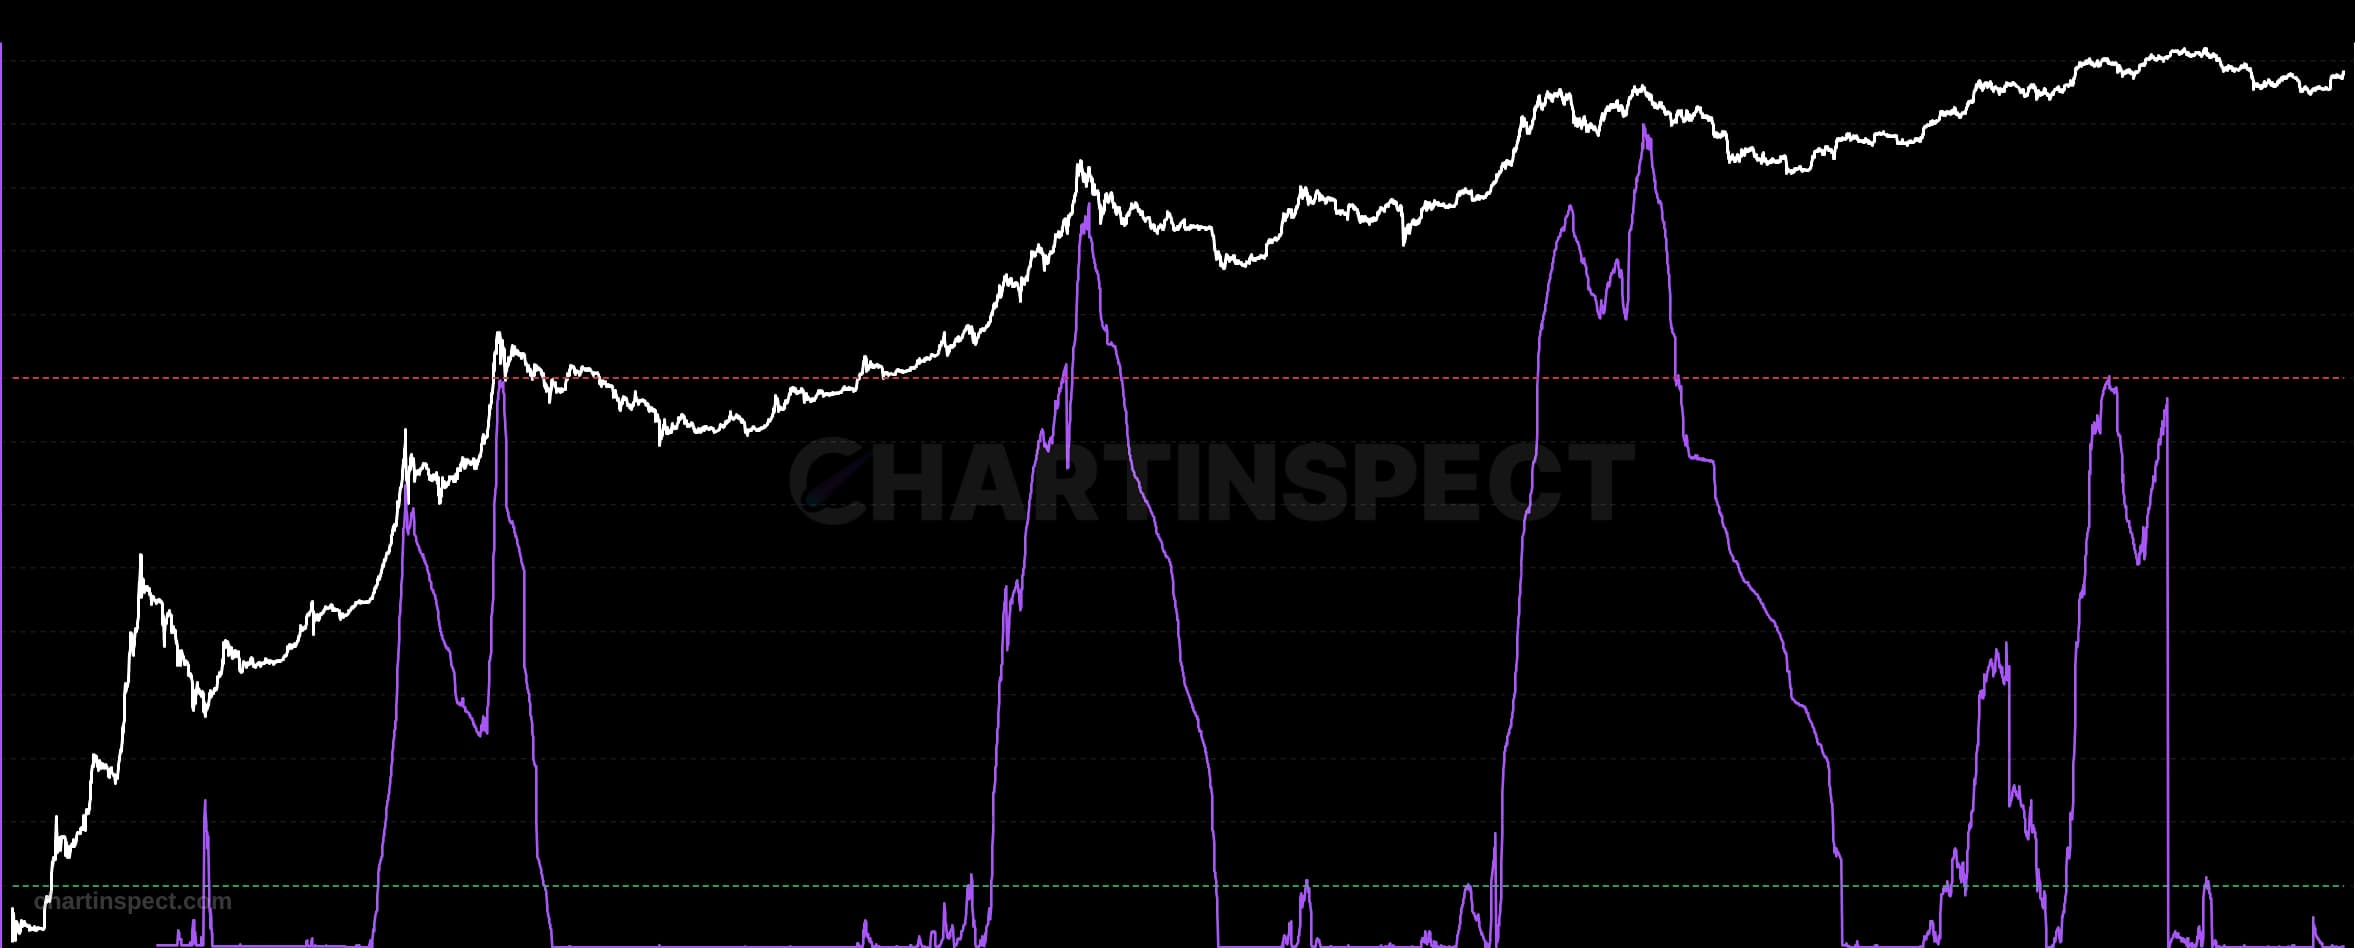
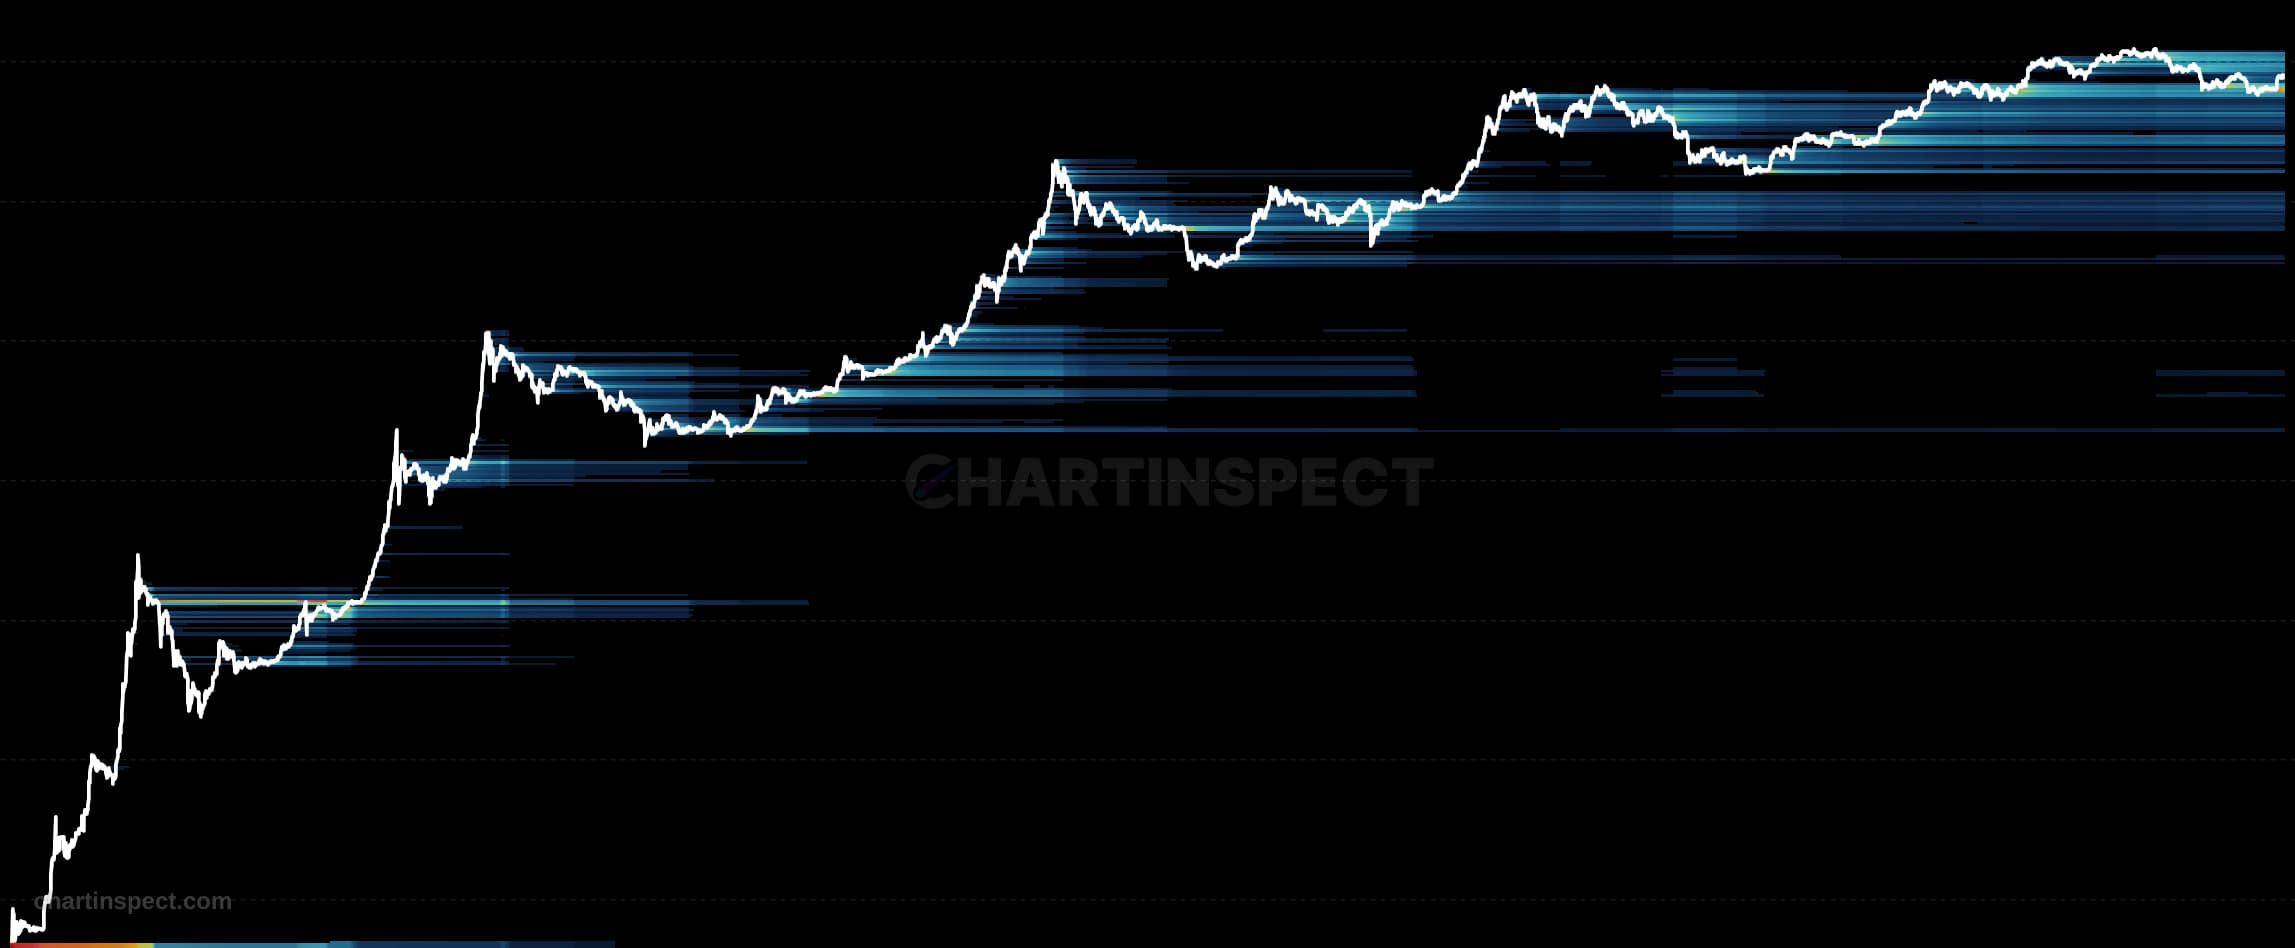
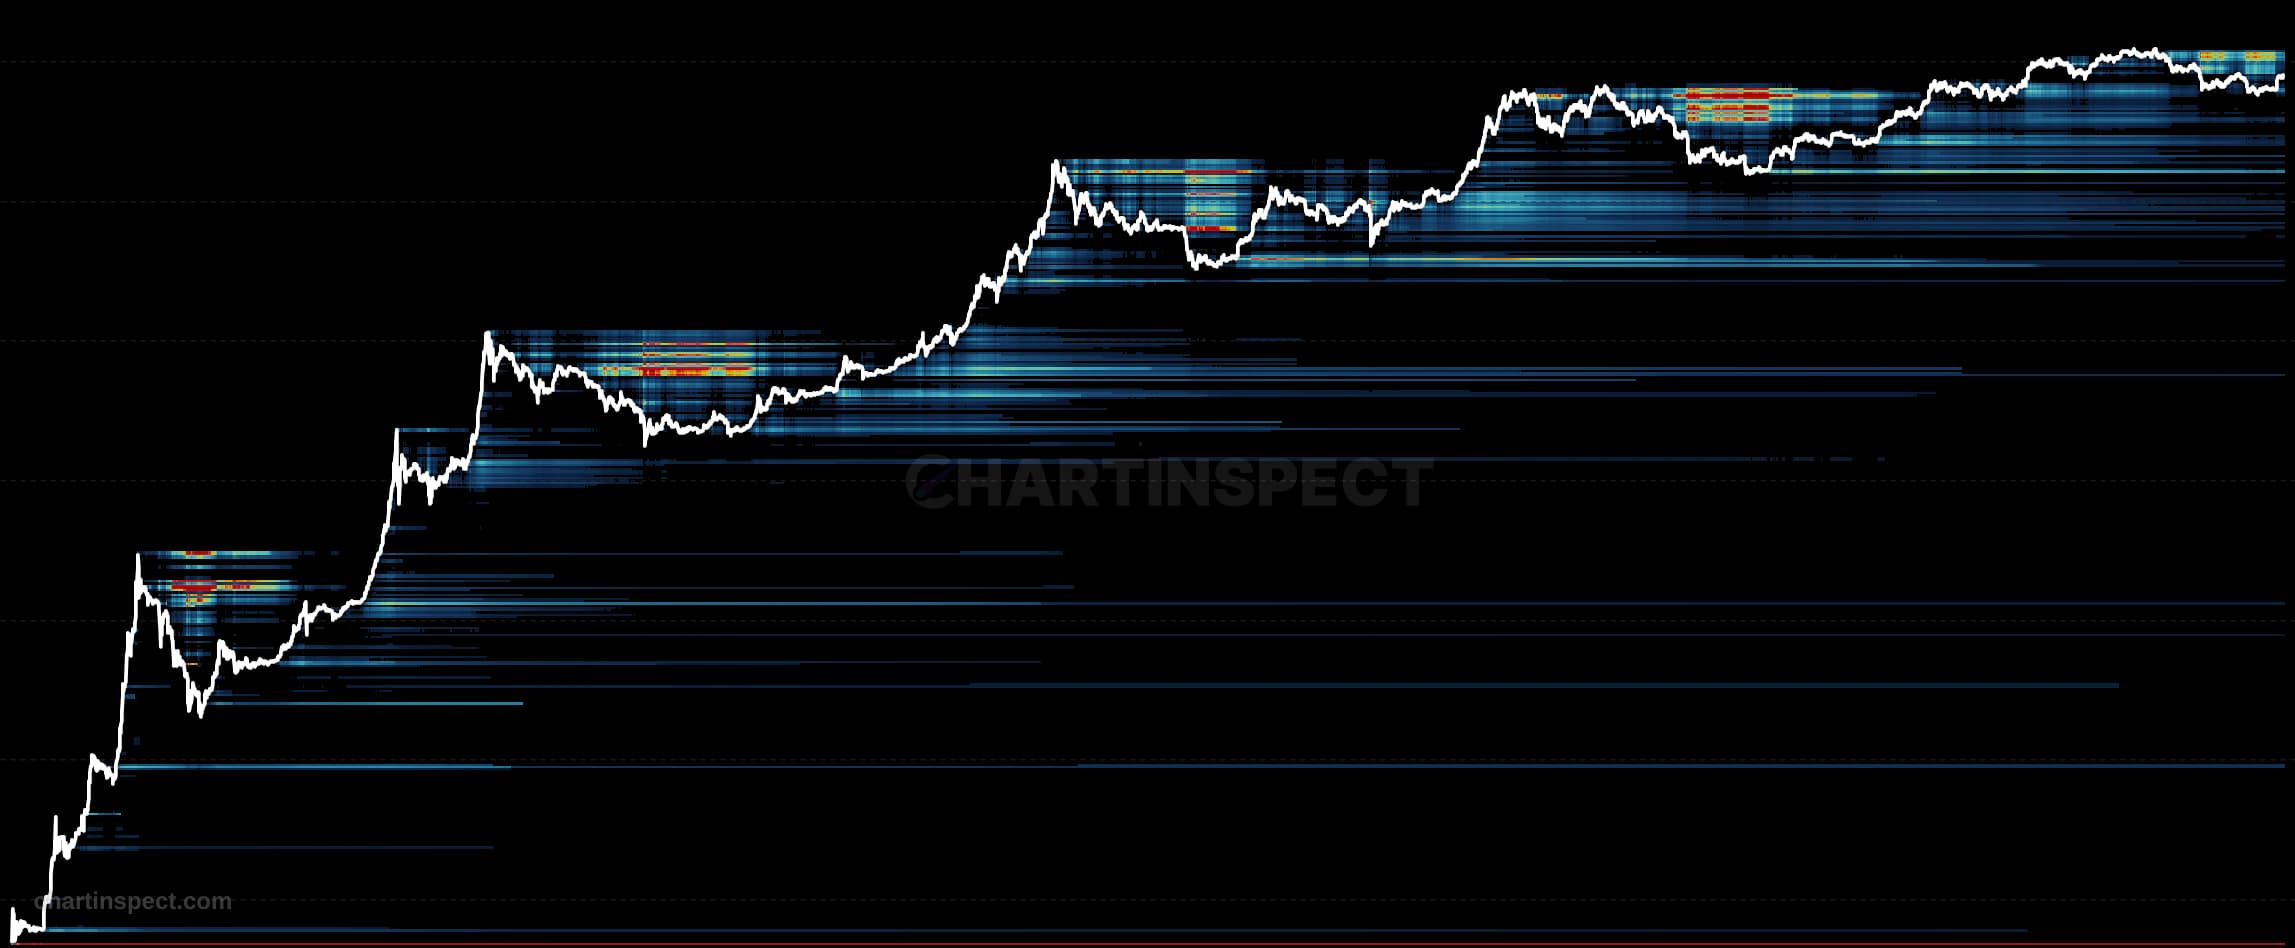
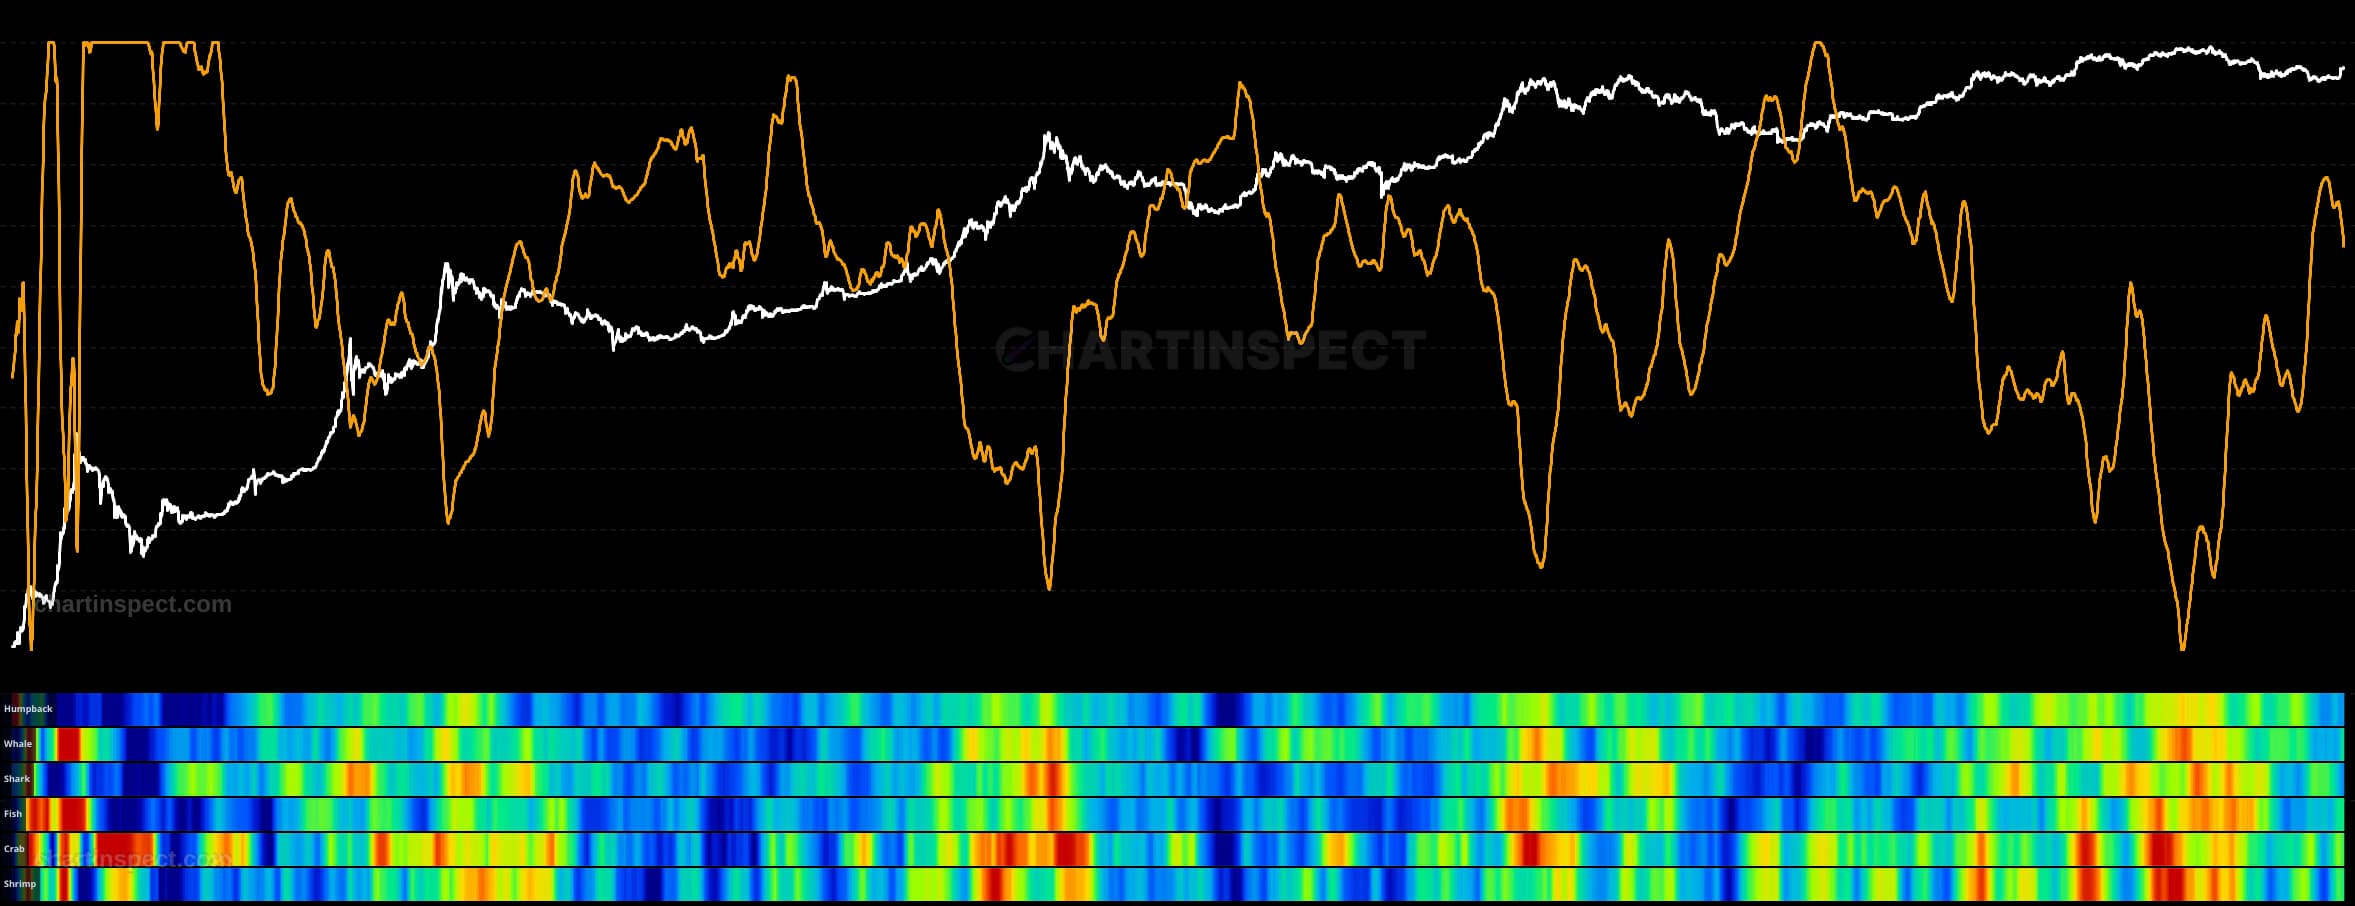
The Bitcoin Cost Basis Heatmap plots the distribution of on-chain cost basis across price levels over time. For each historical point it groups the supply by the price at which those coins last moved, then renders the density of supply sitting at each price band as a color-intensity cell, building a two-dimensional map of where the network's acquisition prices are concentrated against Bitcoin's price history.
Read the heatmap by scanning vertically at any date to see how supply is spread across price levels, and horizontally to watch those concentrations migrate over time. Bright, hot bands mark price levels where a large share of the supply established its cost basis, and these tend to act as accumulation zones or support; thinner, cooler regions mark prices where little supply changed hands. Bands that build while price is flat reveal accumulation, while bands that fade or shift upward as price rises reveal distribution and coins changing hands at higher levels.
Use the Cost Basis Heatmap to locate the price levels that matter most to holders. When price trades above dense cost-basis bands, most of that supply sits in profit and those bands often serve as support; when price falls into or below them, holders move toward loss, which historically shapes capitulation and re-accumulation behavior.
Check the selected asset, units, and cohort before comparing readings. Compare the metric over consistent dates and use related measures to understand what contributes to a change.