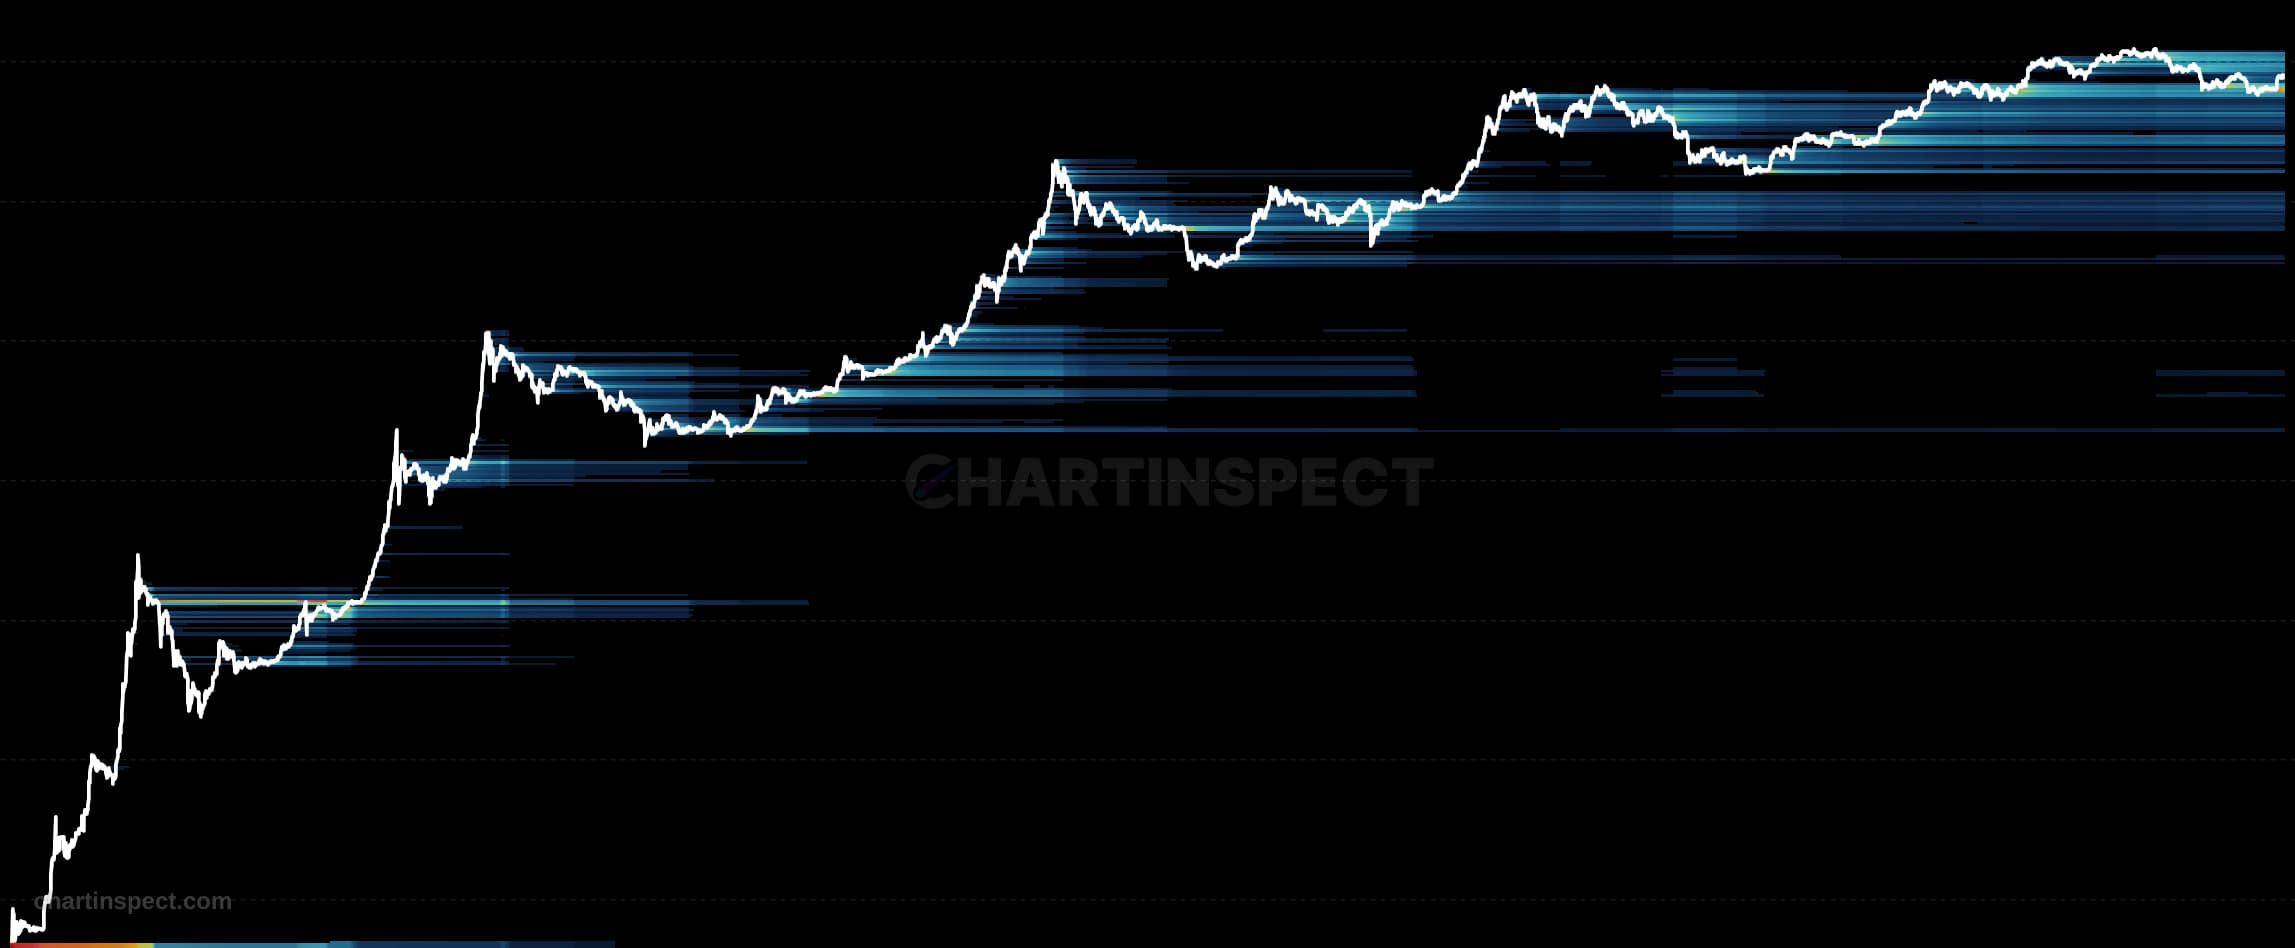
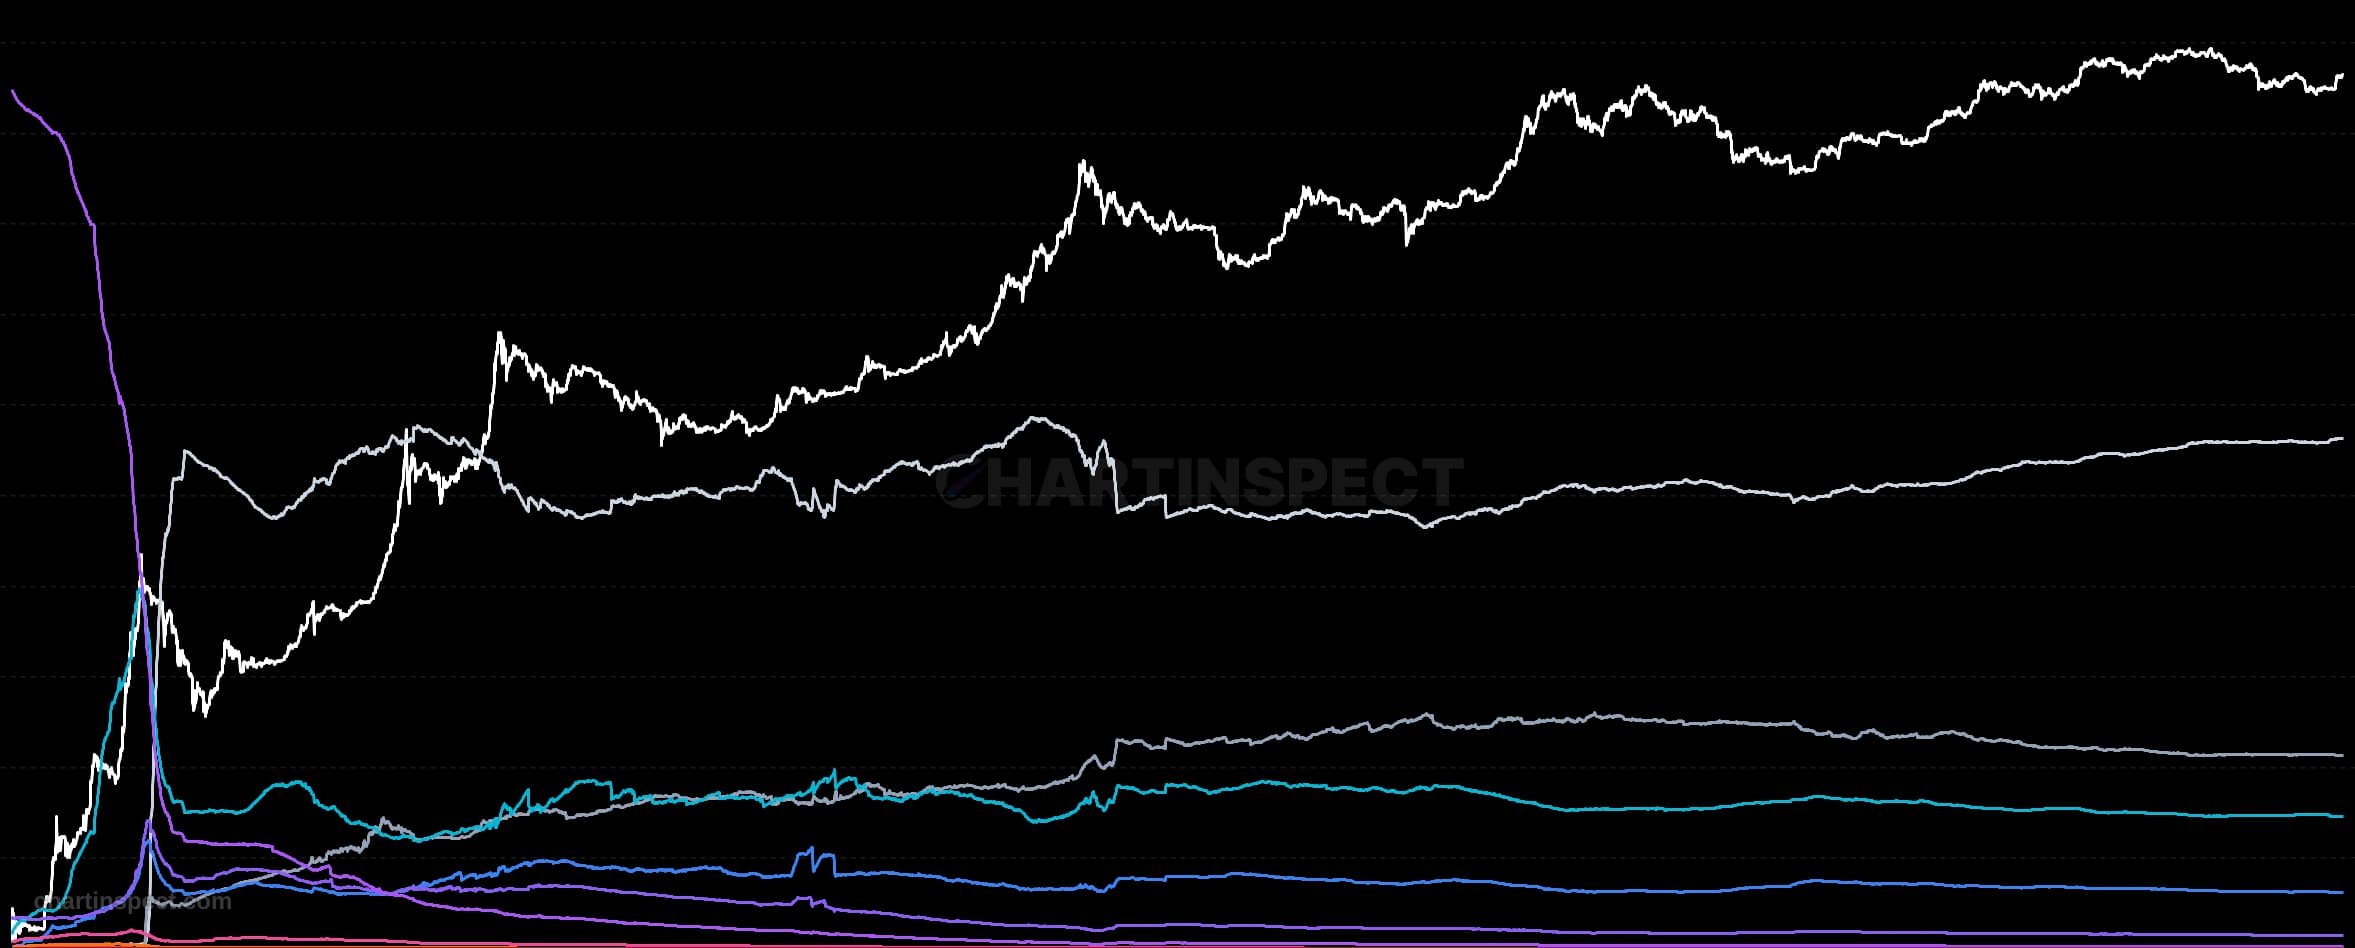
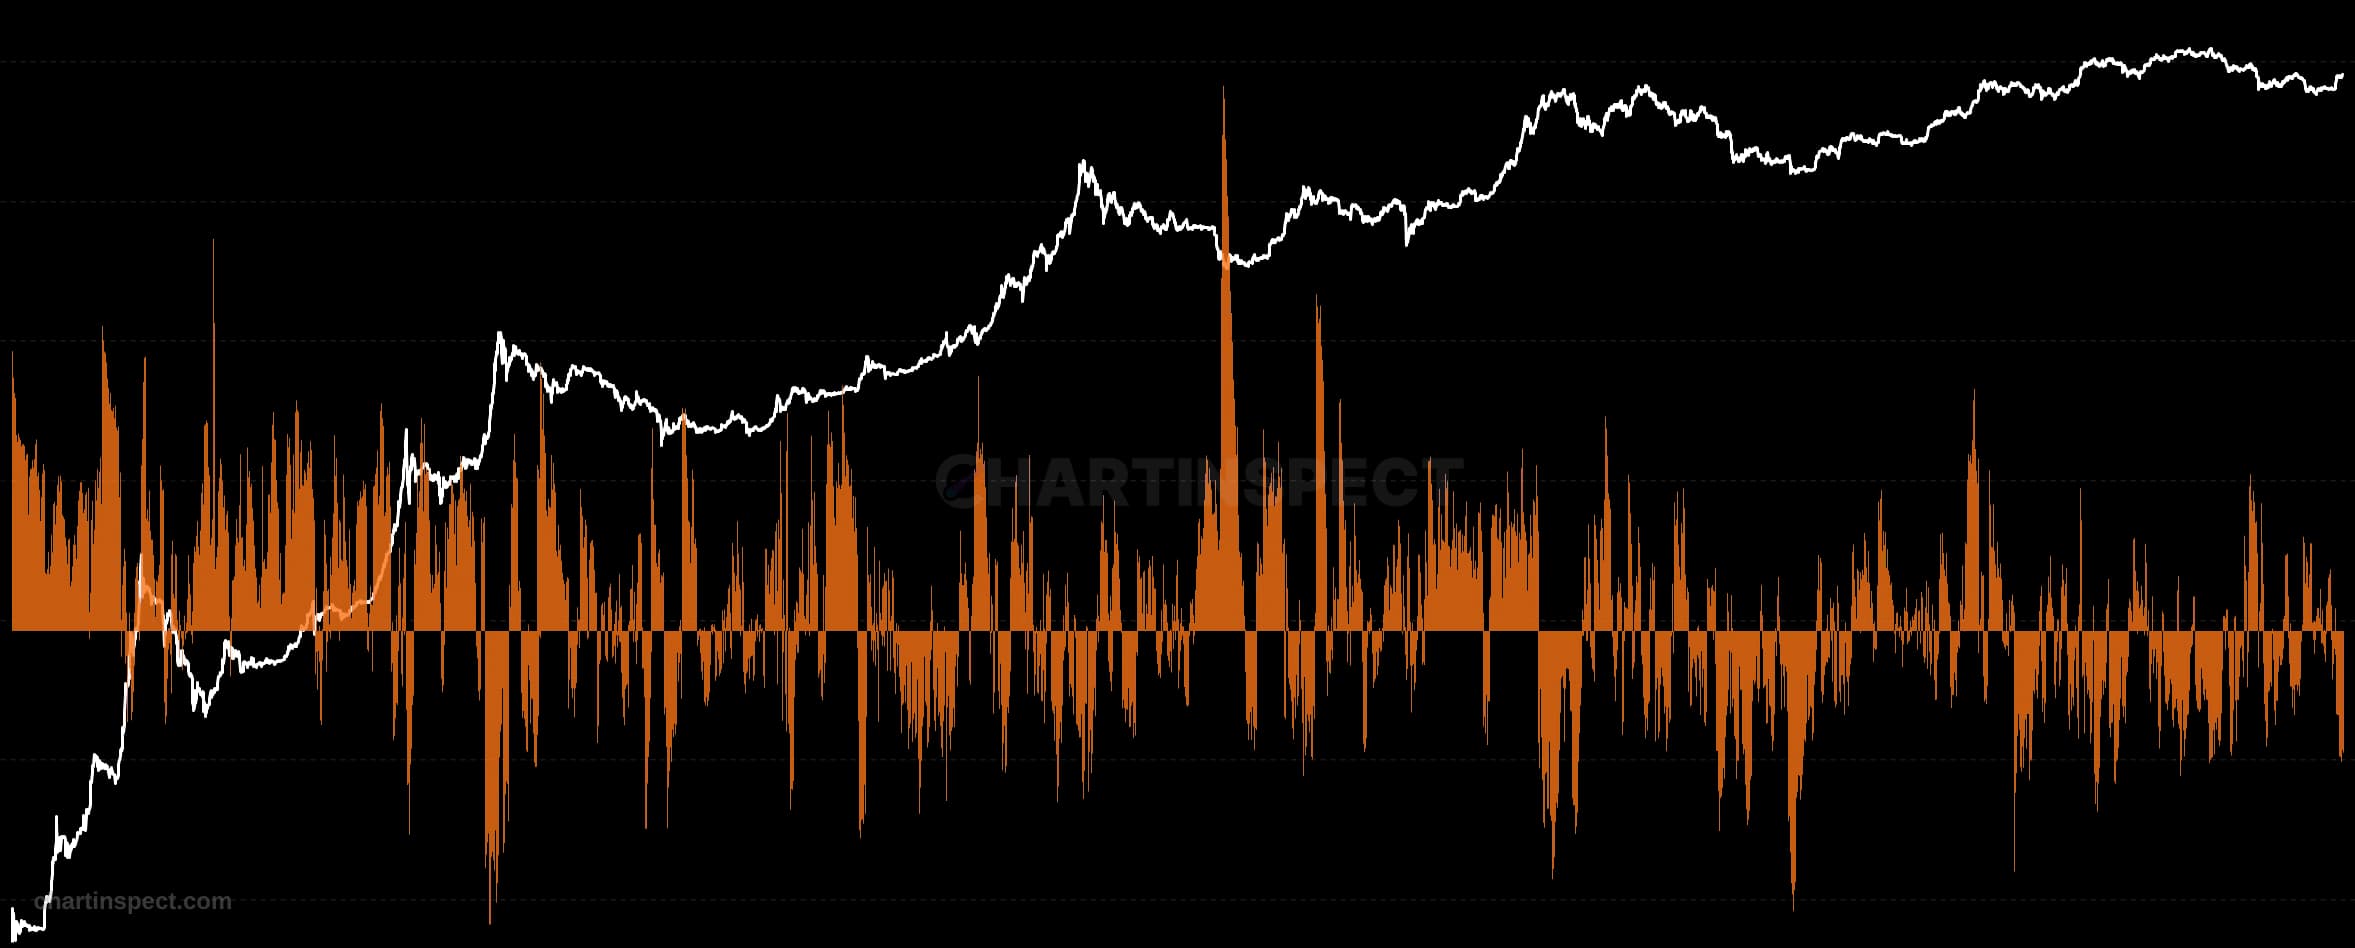
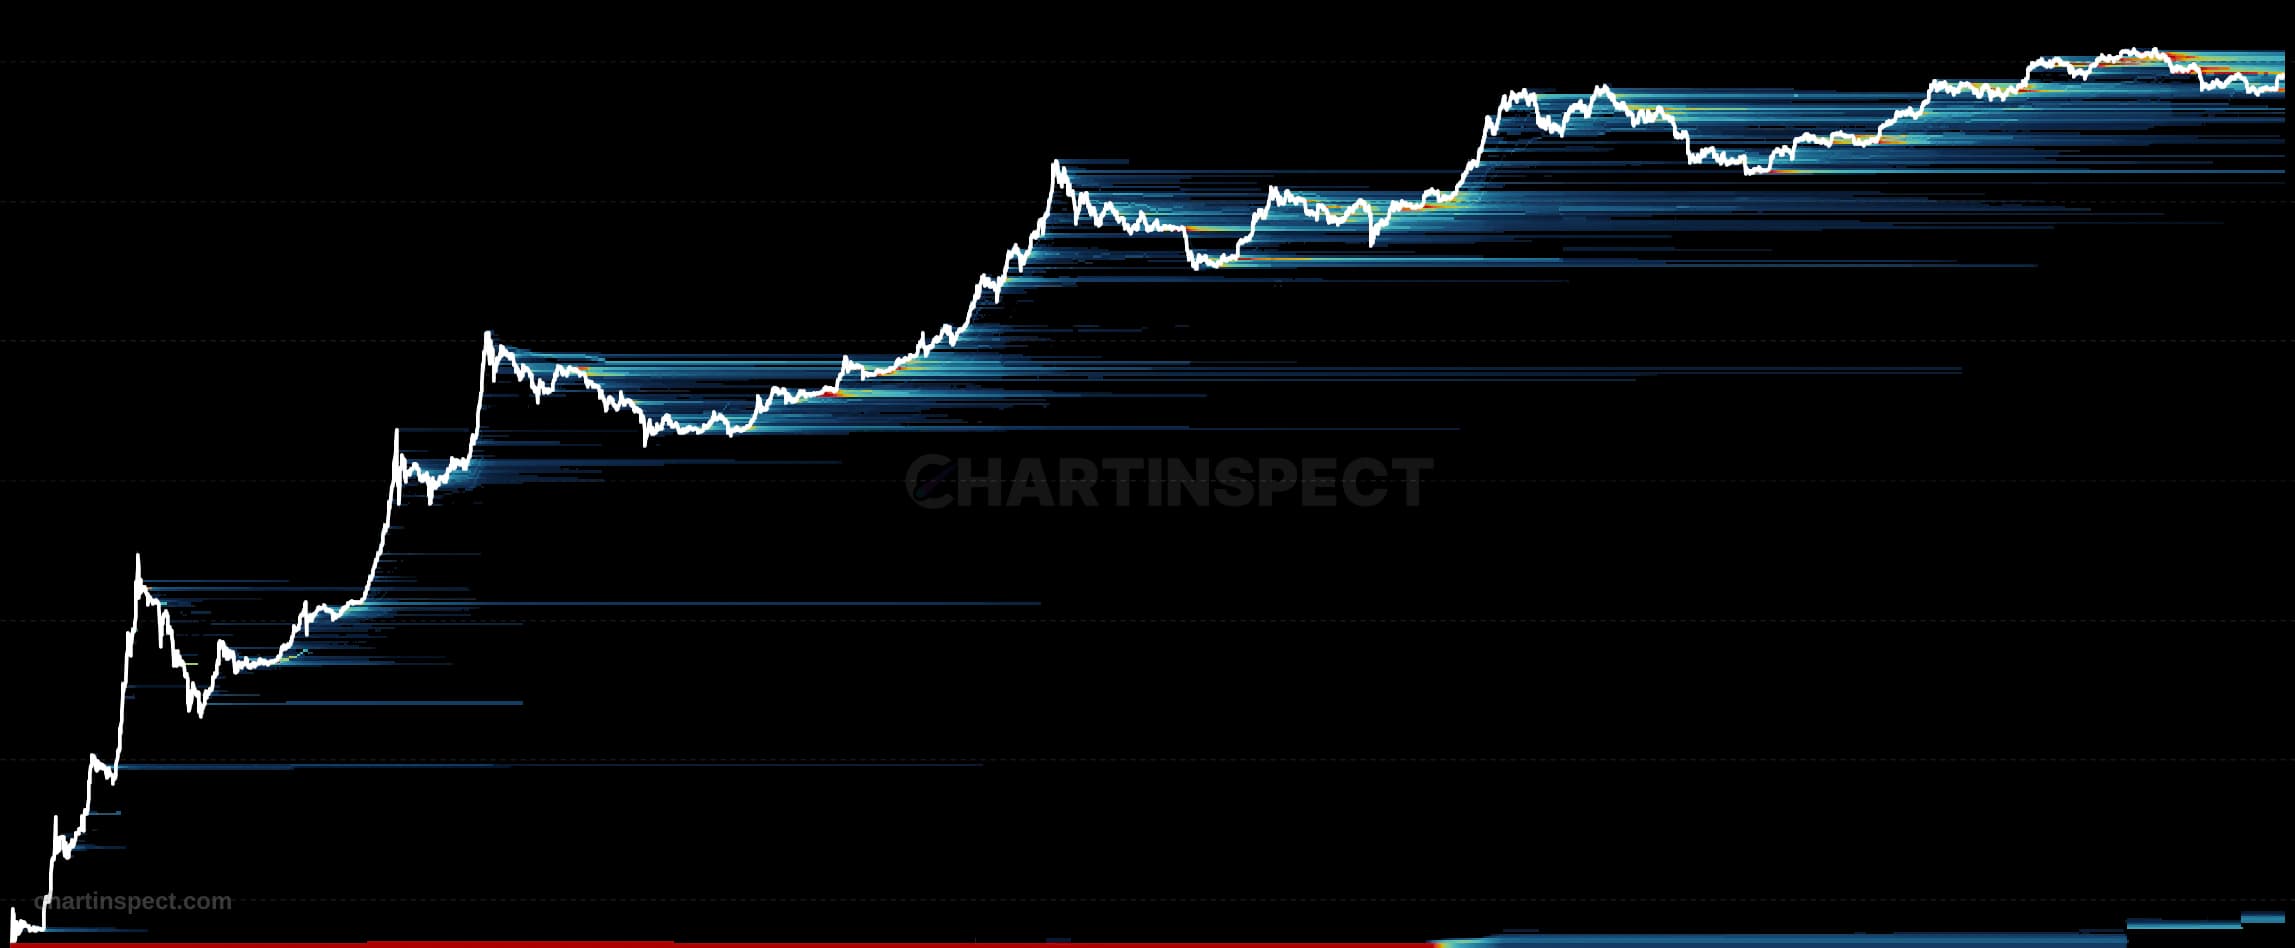
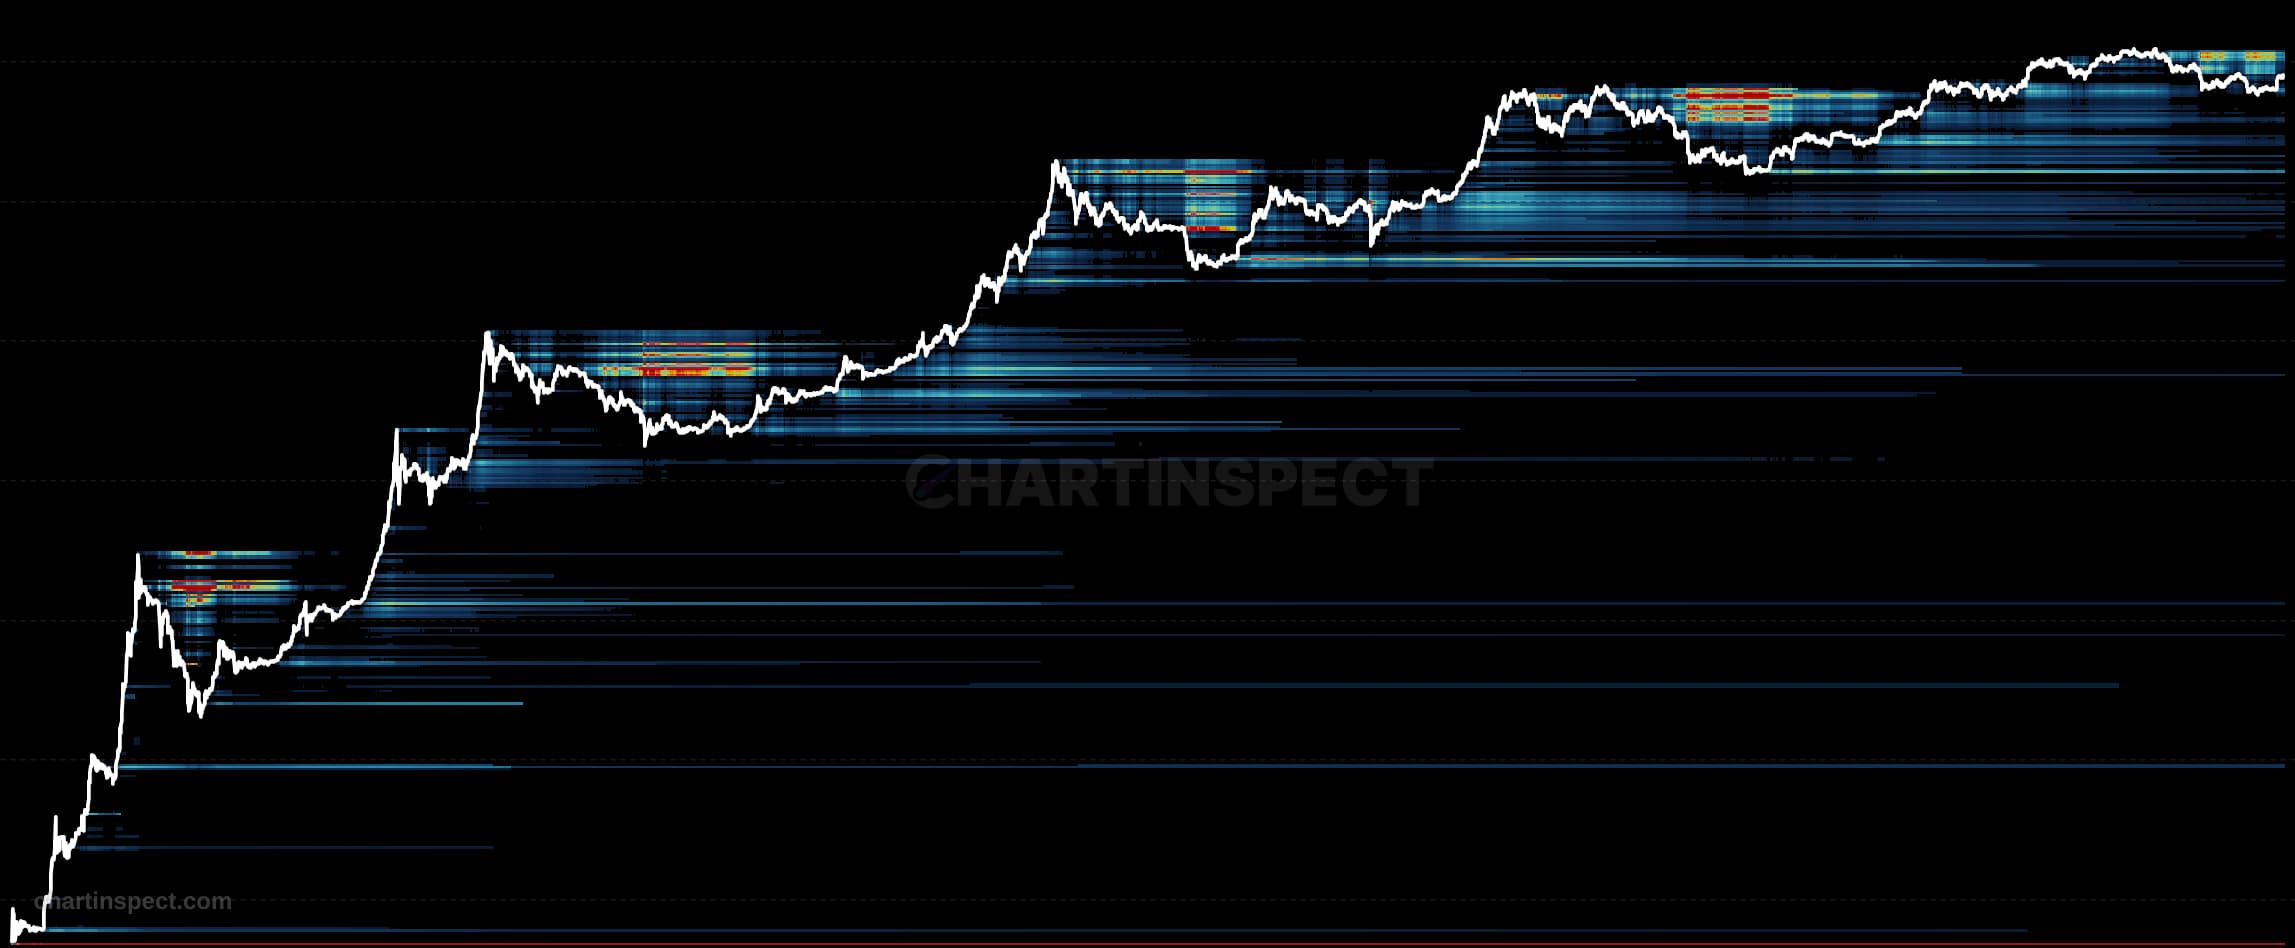
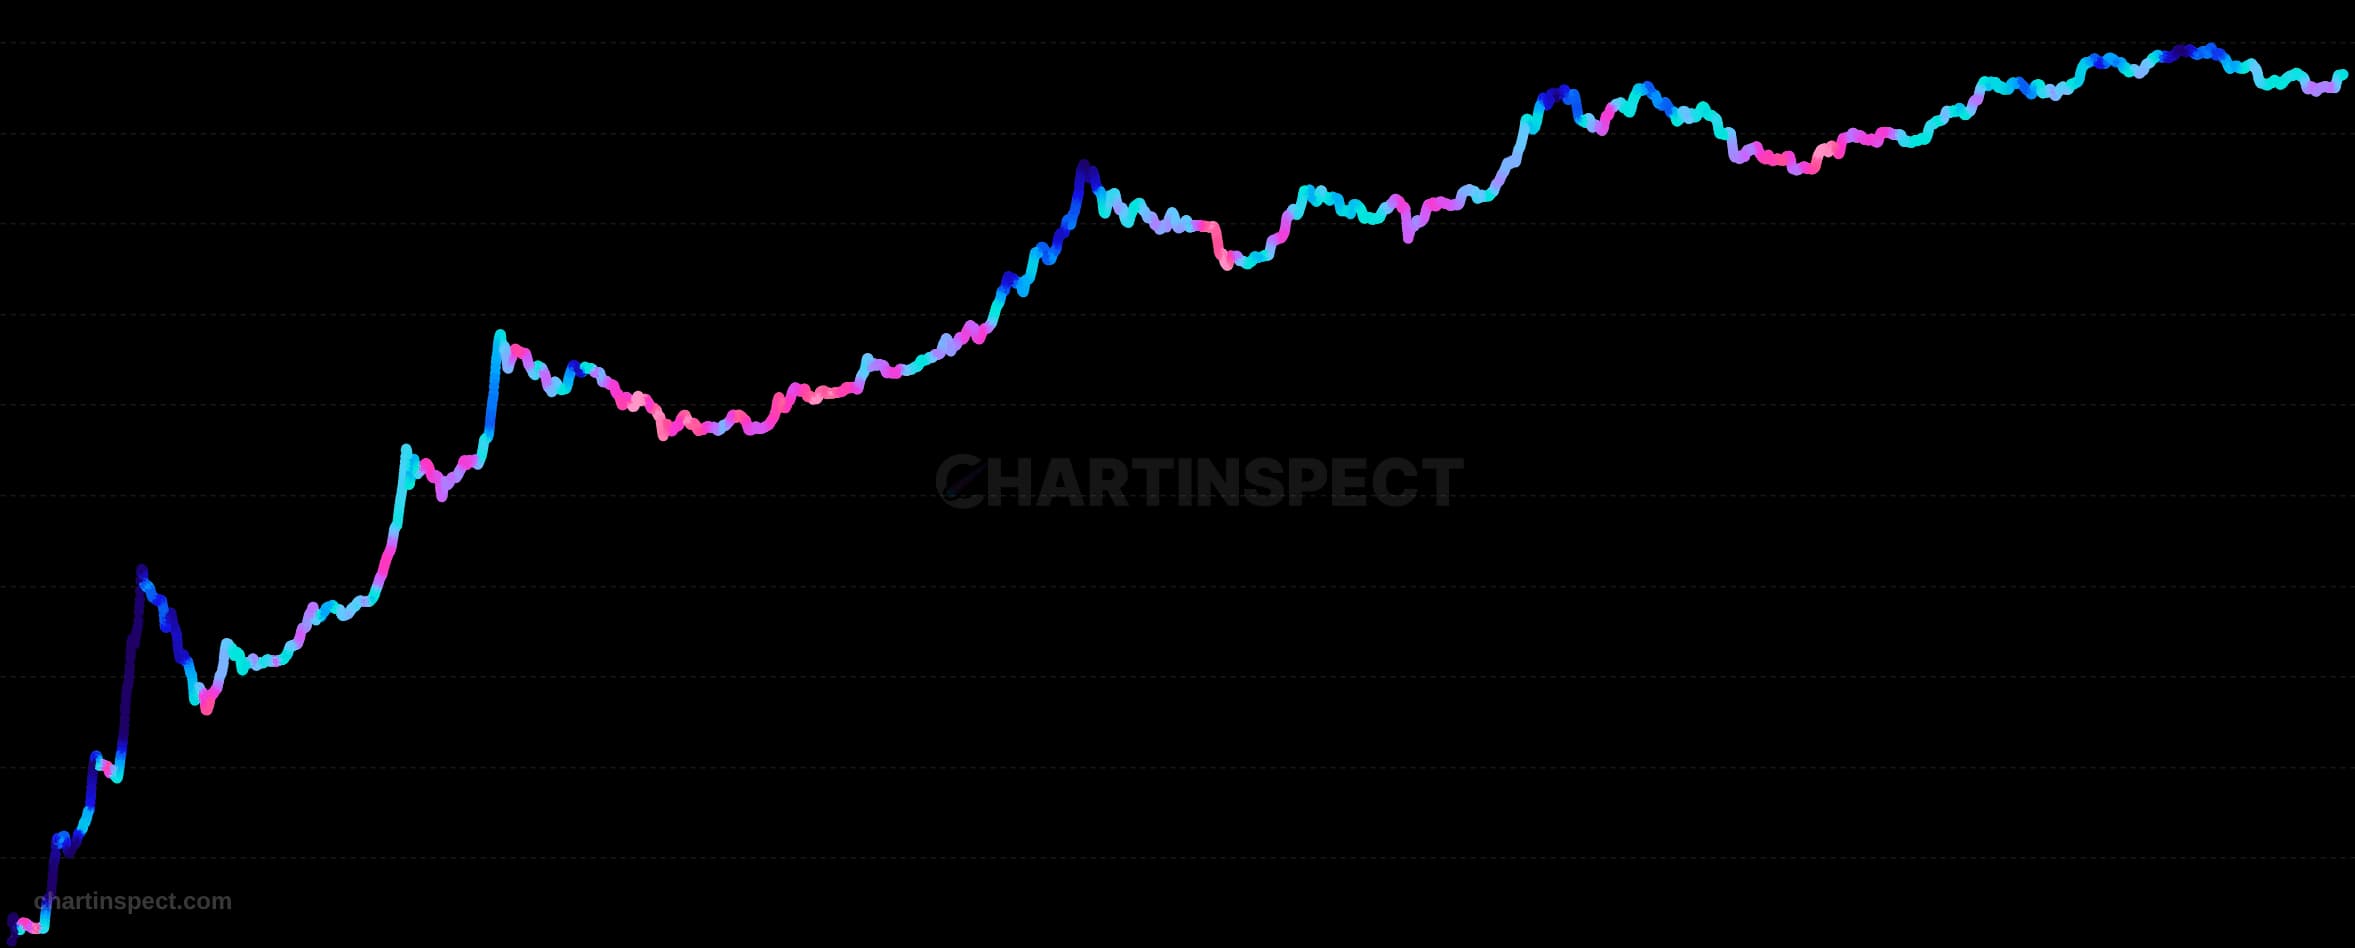
The Bitcoin Whale vs Retail Delta Heatmap visualizes the divergence between whale and retail holder behavior across the network. Whales are defined as addresses holding 1,000 or more BTC, while retail is defined as addresses holding fewer than 10 BTC. The chart computes an accumulation/distribution score for each of the six balance tiers, from Shrimp up through Humpback, and renders them as a per-cohort heatmap so you can read how each band of Bitcoin holders is behaving at a glance.
Each cell in the heatmap encodes a single cohort's accumulation or distribution intensity, and two aggregate overlay lines trace the whale delta and the retail delta on top of the grid. When the whale line pulls away from the retail line, the two groups are moving in opposite directions, one accumulating while the other distributes. The chart supports three calculation modes: Active Supply Weighted, Non-Active Supply Weighted, and Raw Flows, letting you weight the scores by circulating activity or read the unadjusted flows directly.
Use the whale vs retail delta to spot cohort divergence in Bitcoin's supply. Sustained whale accumulation against retail distribution often signals large holders absorbing supply that smaller holders are releasing, and the six-tier heatmap lets you localize which cohorts are driving the aggregate delta before it shows up in price.
Check the selected asset, units, and cohort before comparing readings. Compare the metric over consistent dates and use related measures to understand what contributes to a change.