Loading chart data
Scale
Smoothing
Loading chart data
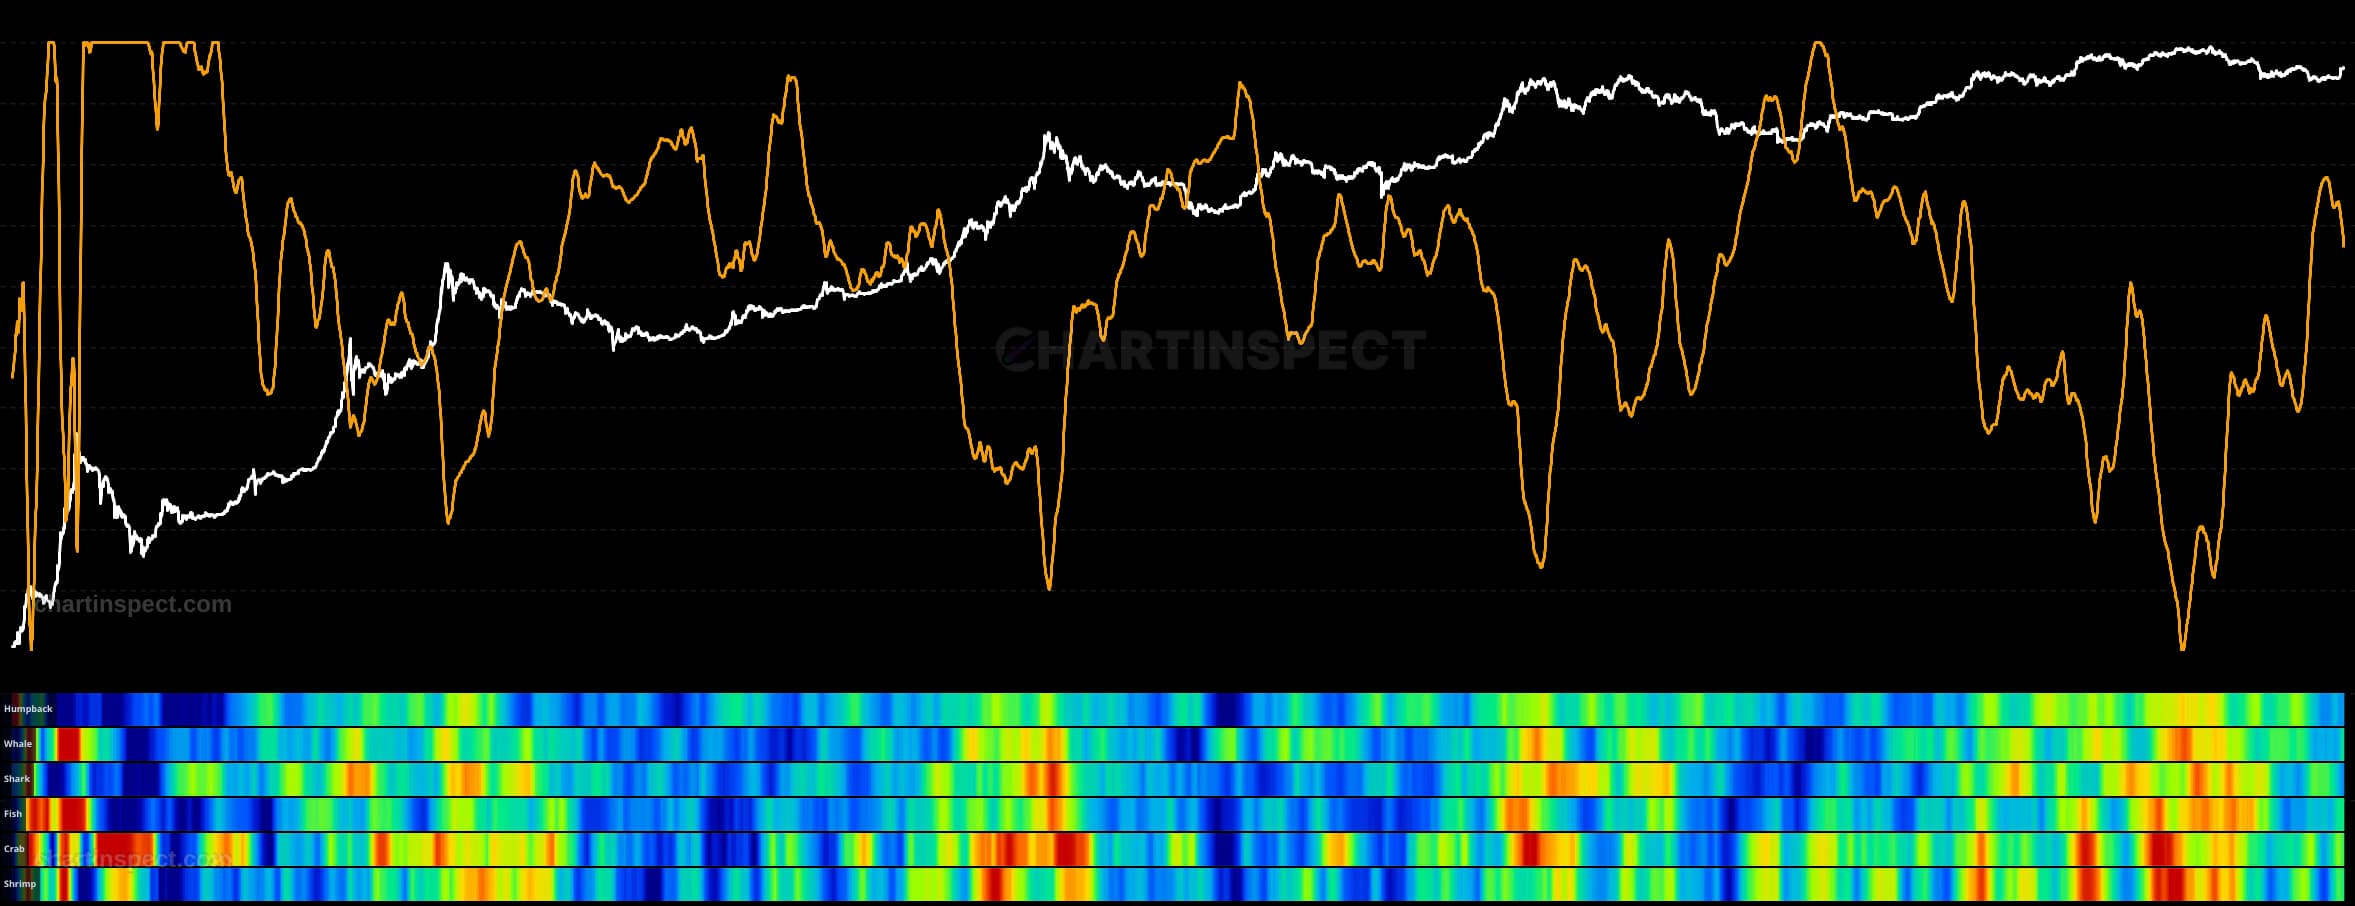
About Balance Distribution Flows (Whale Accumulation)
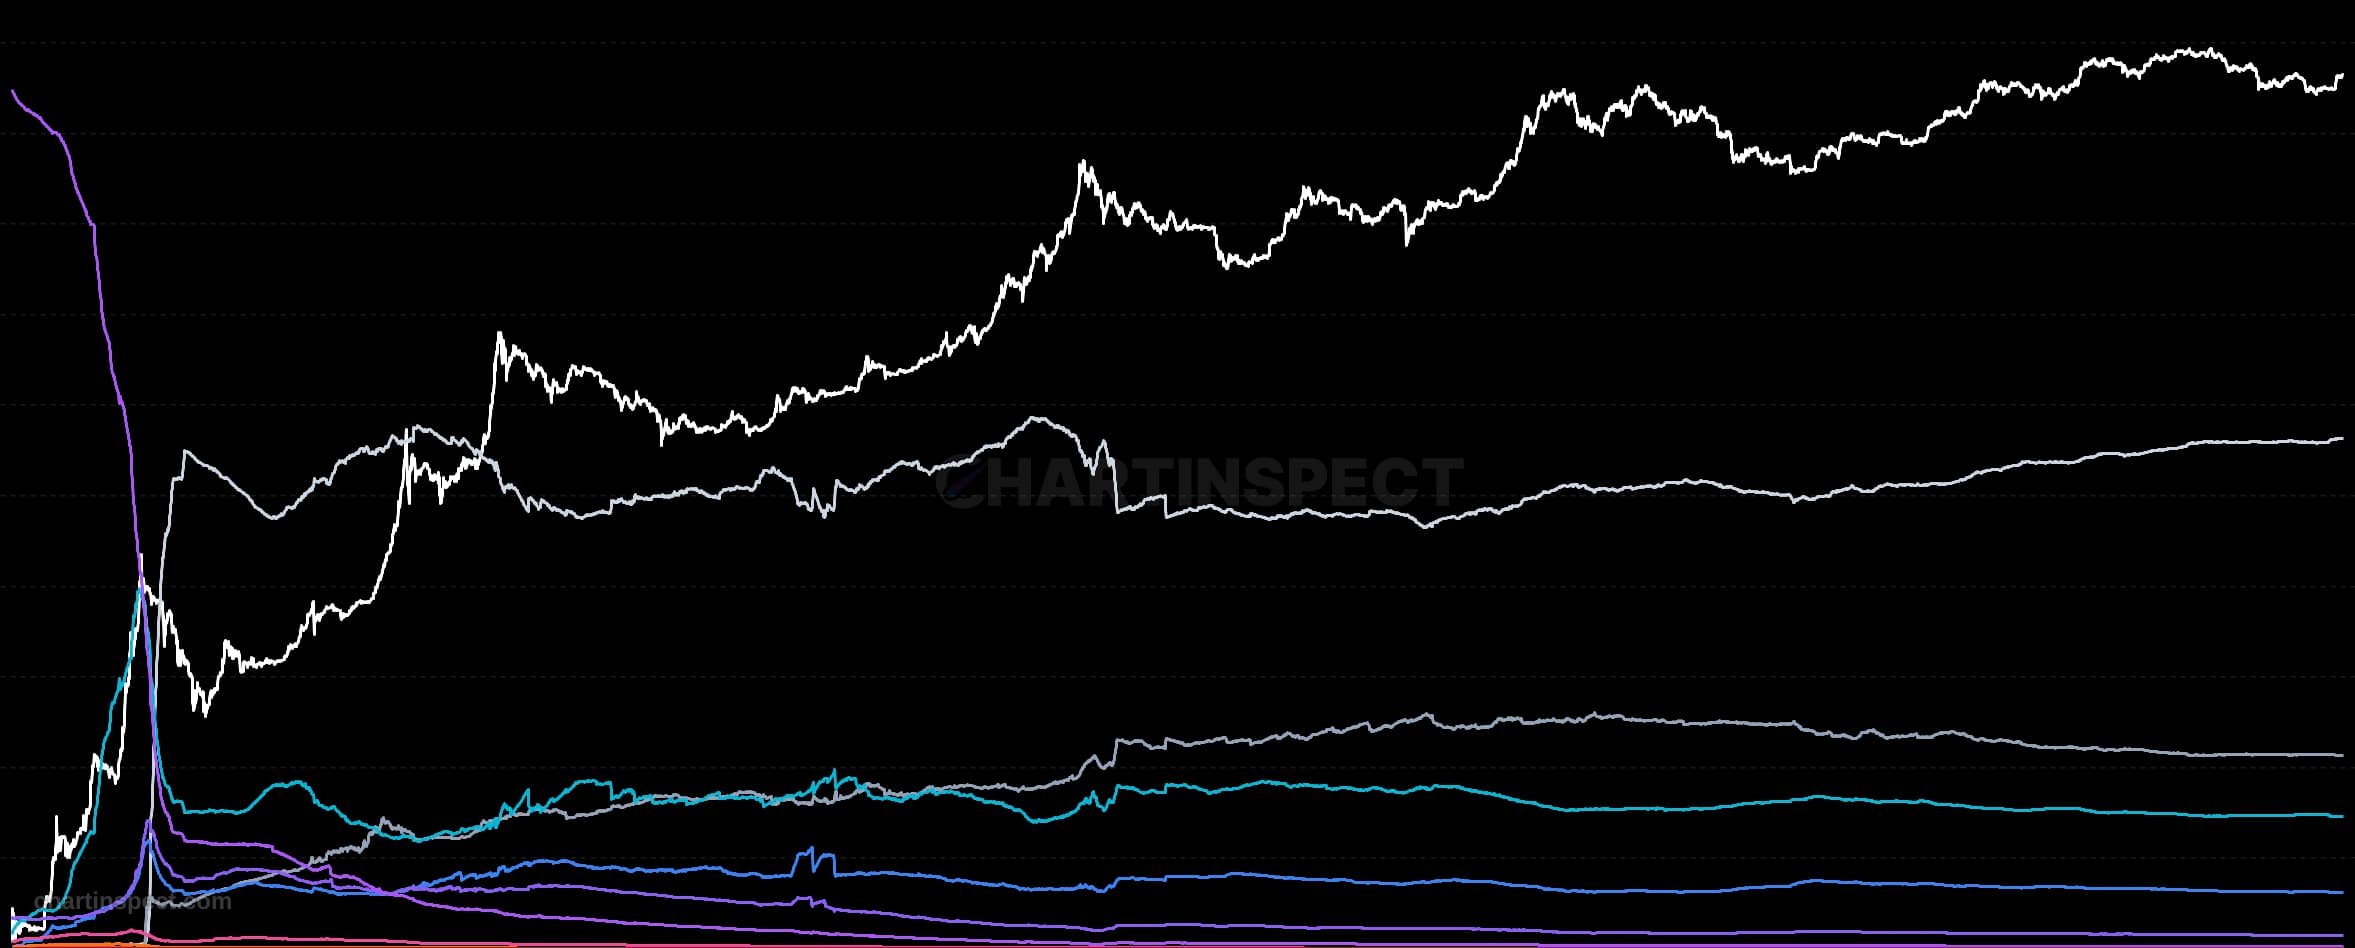
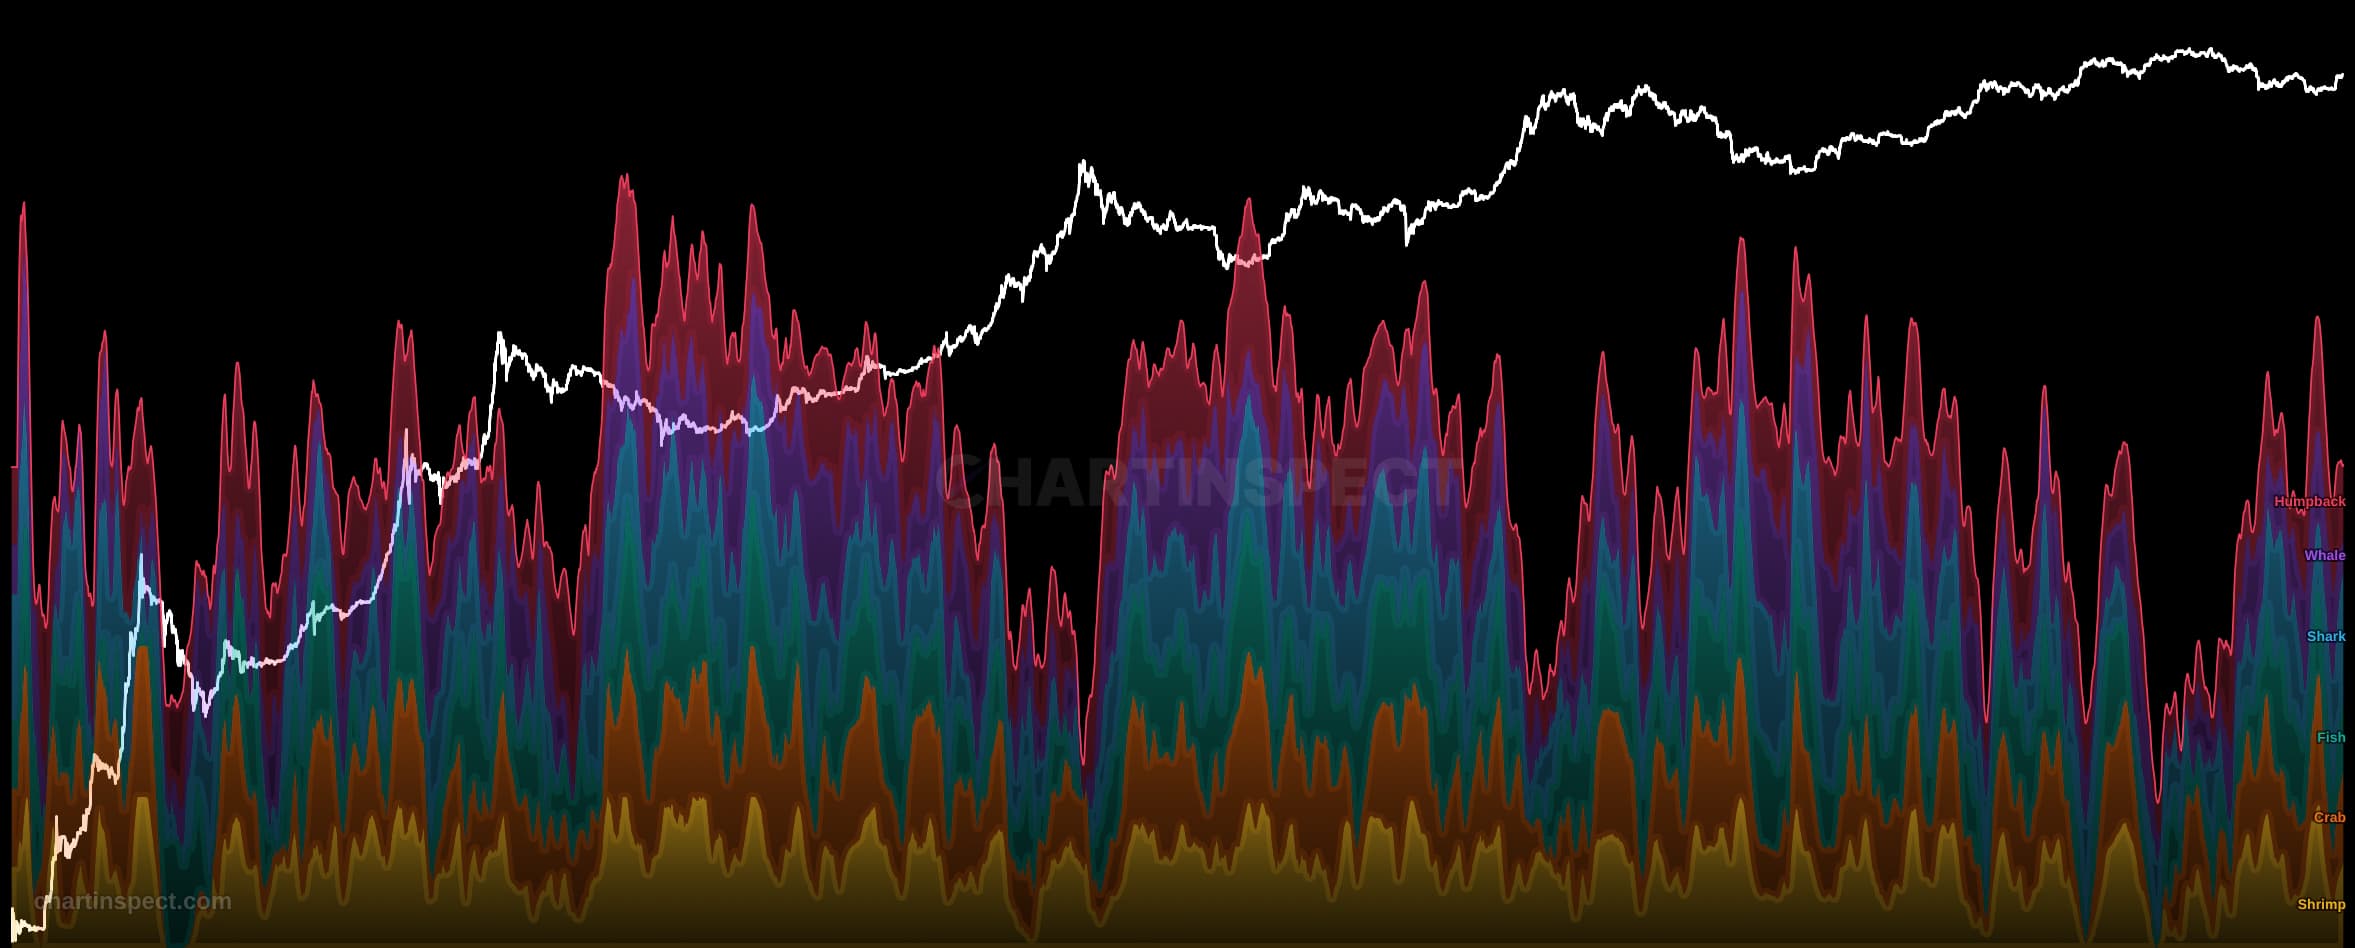
Track net position changes (accumulation/distribution) across different whale tiers from Shrimp to Humpback. Reveals when specific cohorts are buying or selling, providing insights into smart money behavior and retail capitulation. Positive flows indicate accumulation, negative flows indicate distribution.
Freshness: Not yet verified
Community snapshot
No community calls on Balance Distribution Flows (Whale Accumulation) yet. Be the first to share a take.
Related Analytics
Discover more insights with our comprehensive chart collection
Explore All 8809 Charts