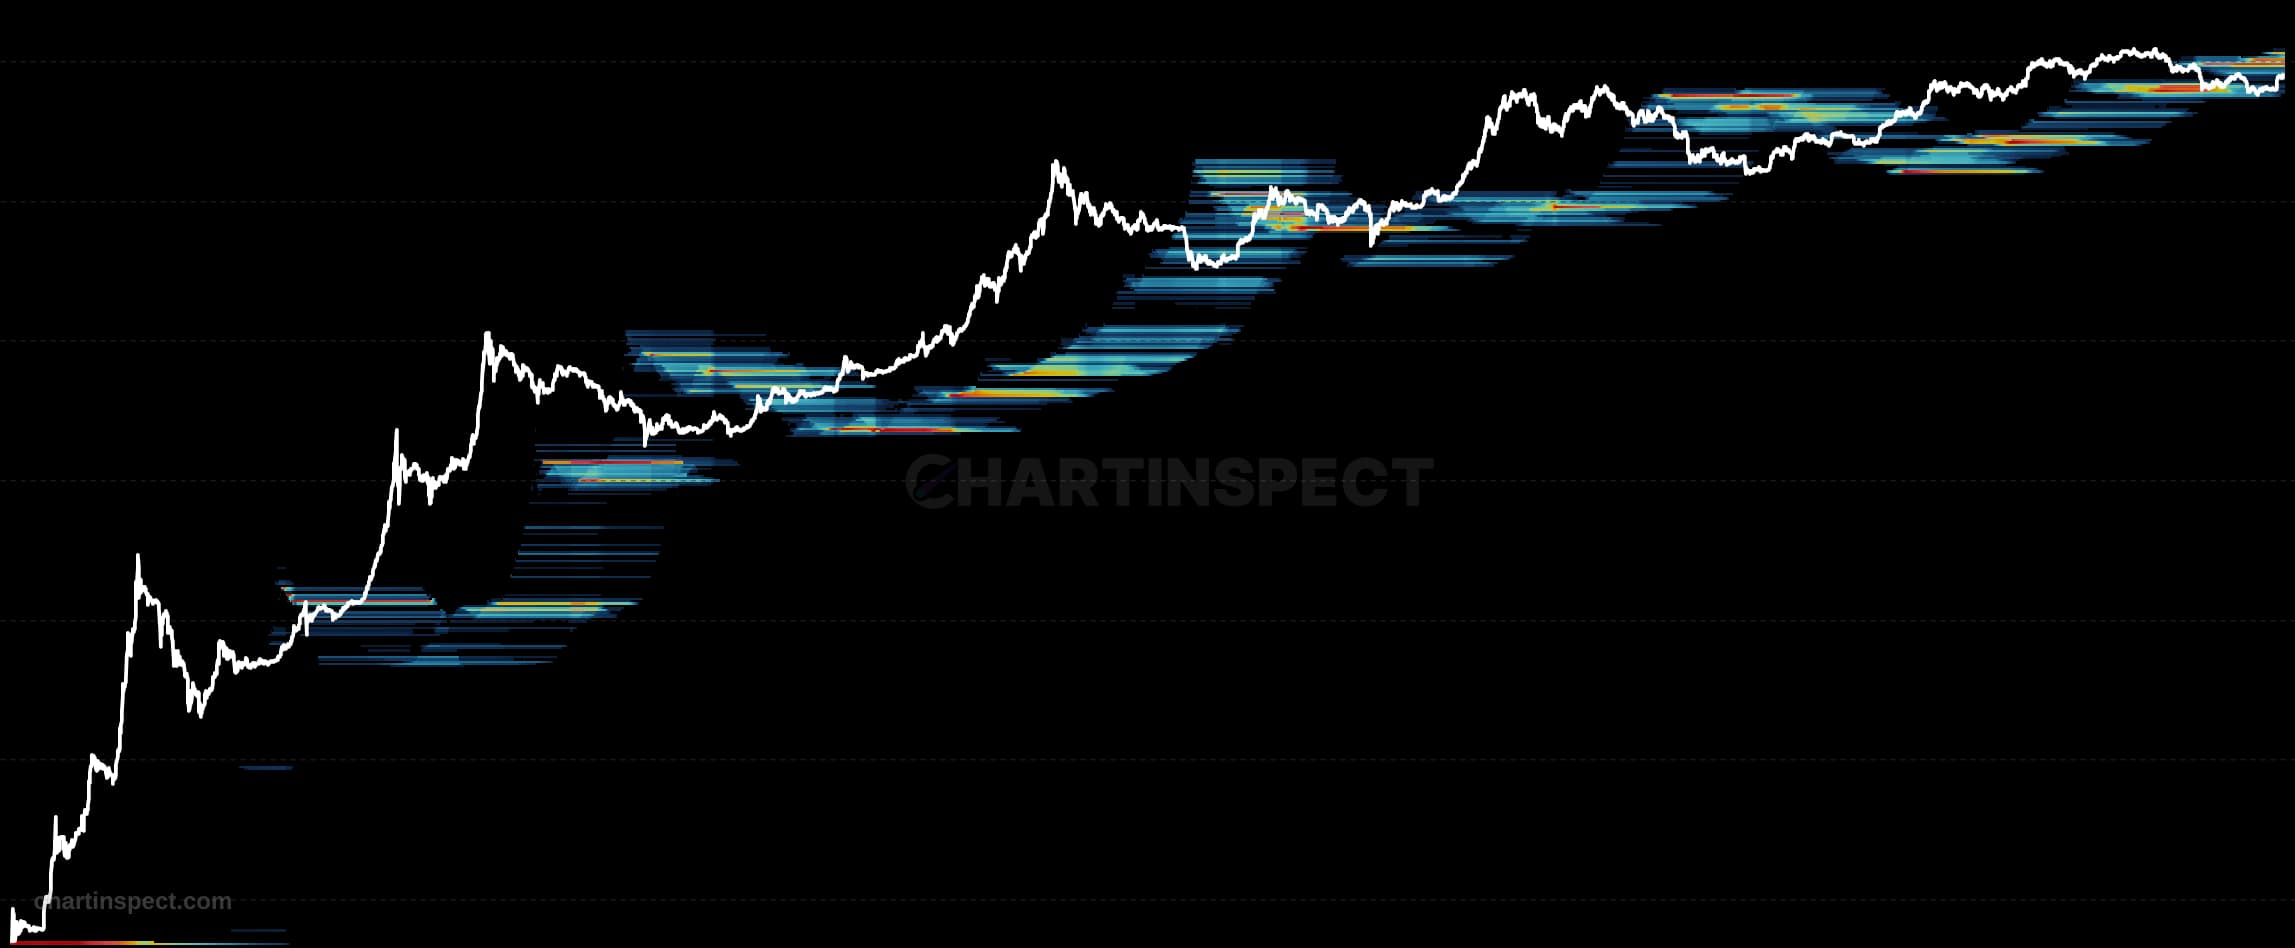
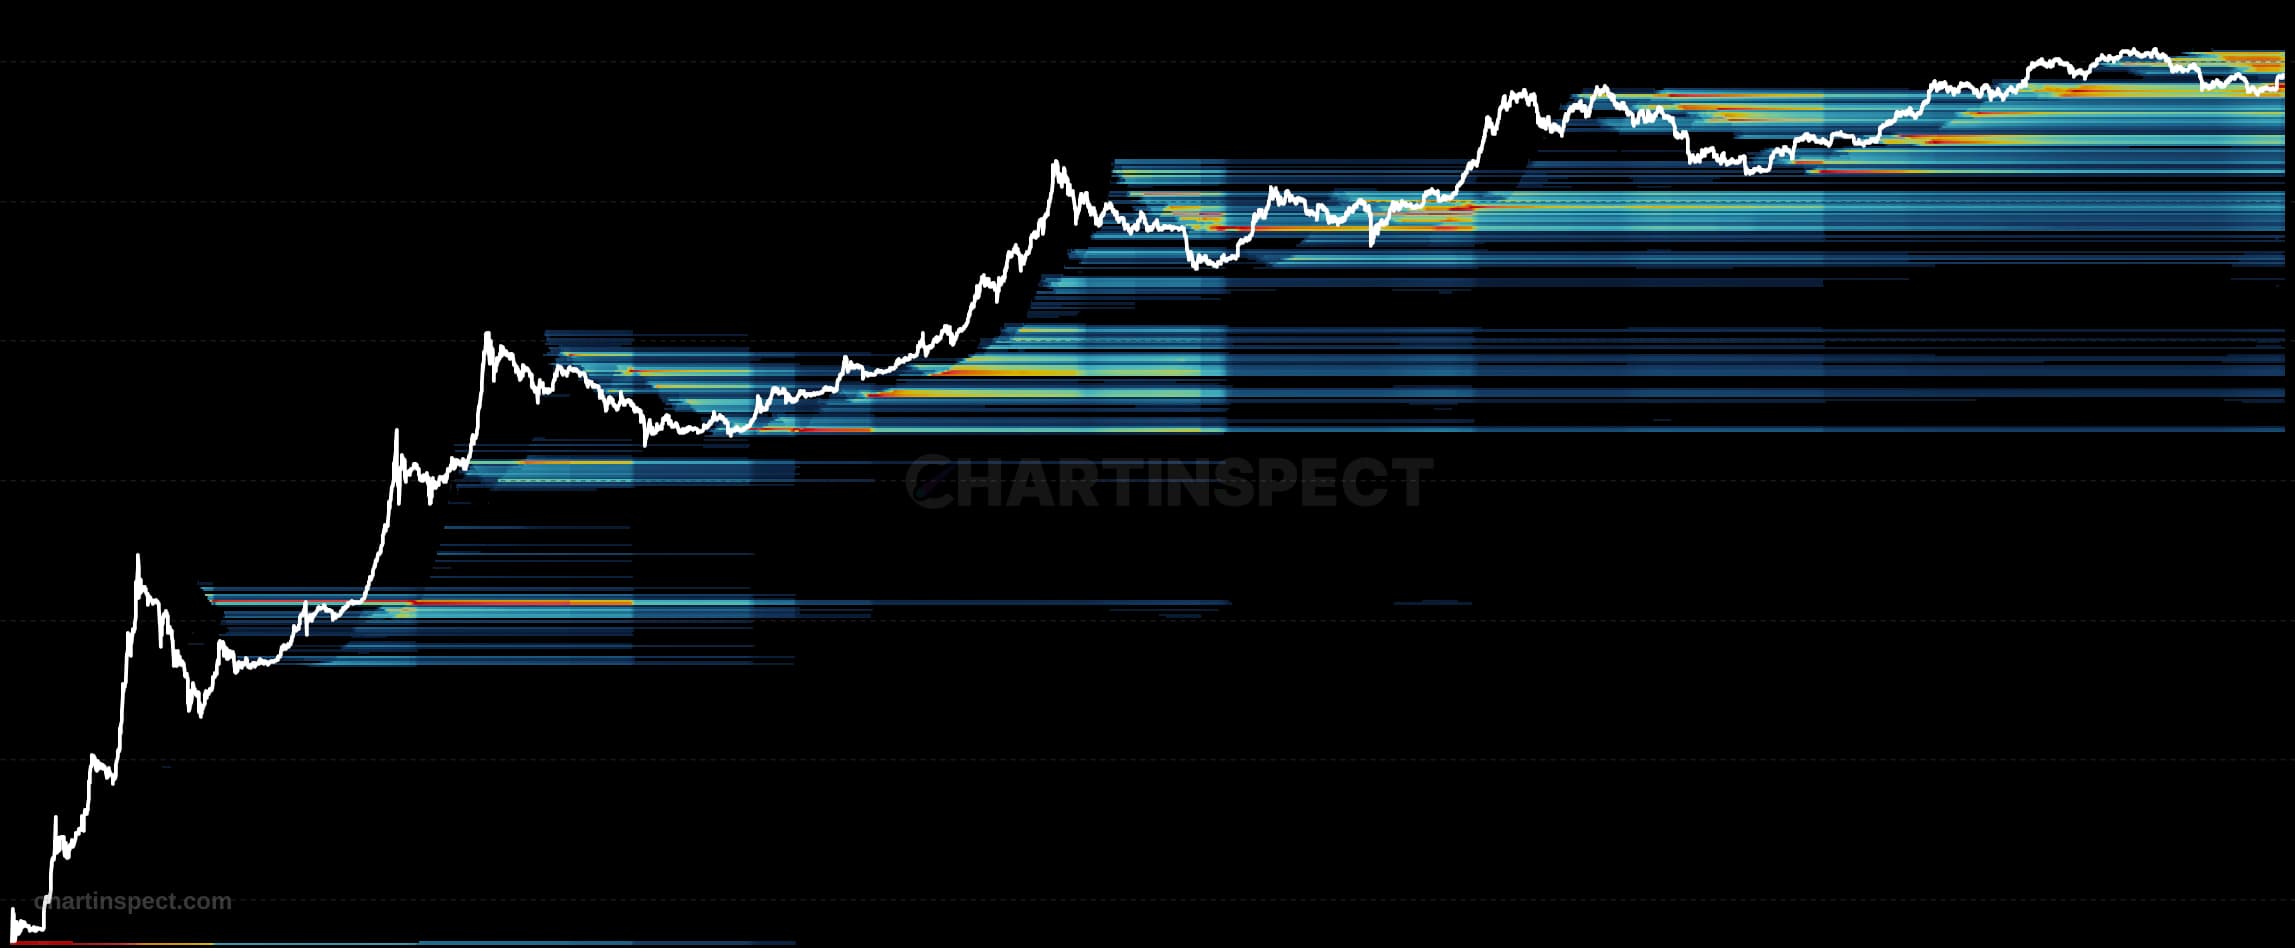
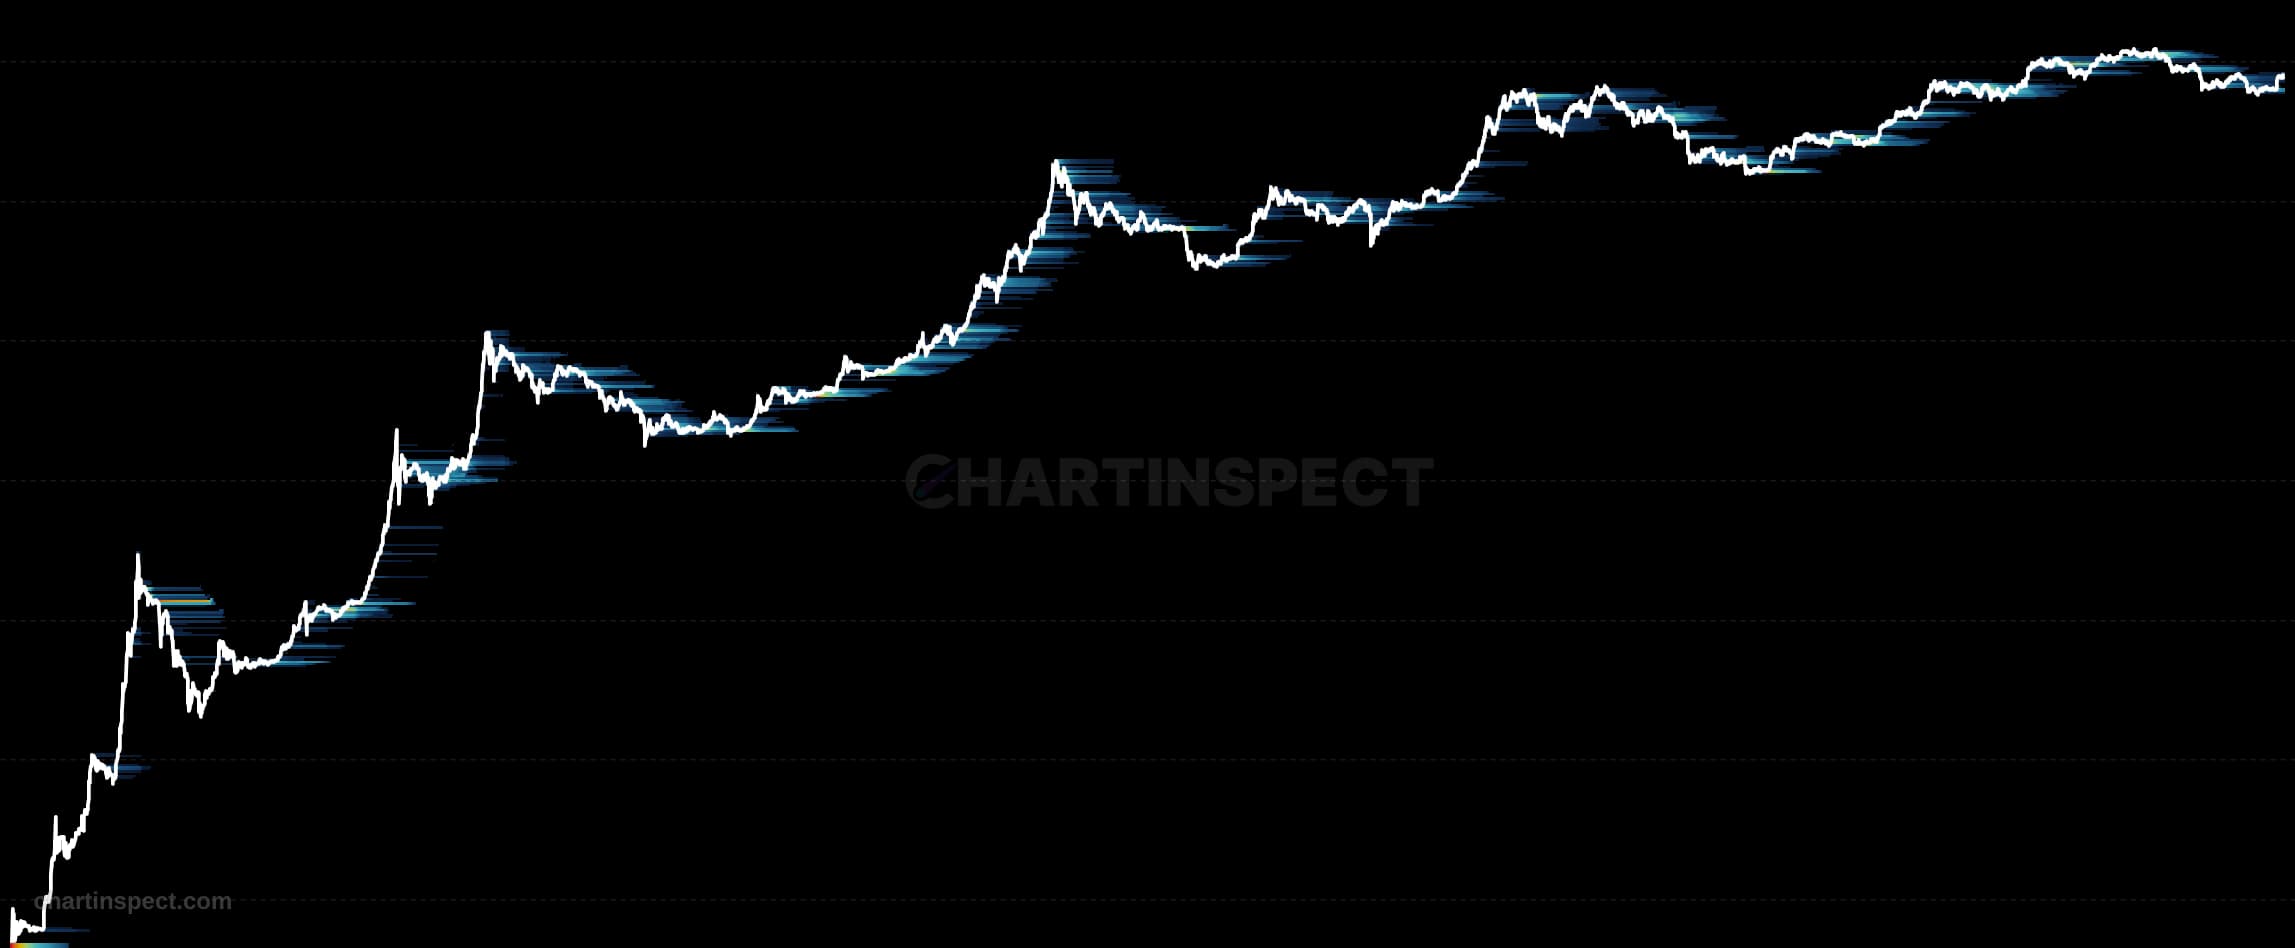
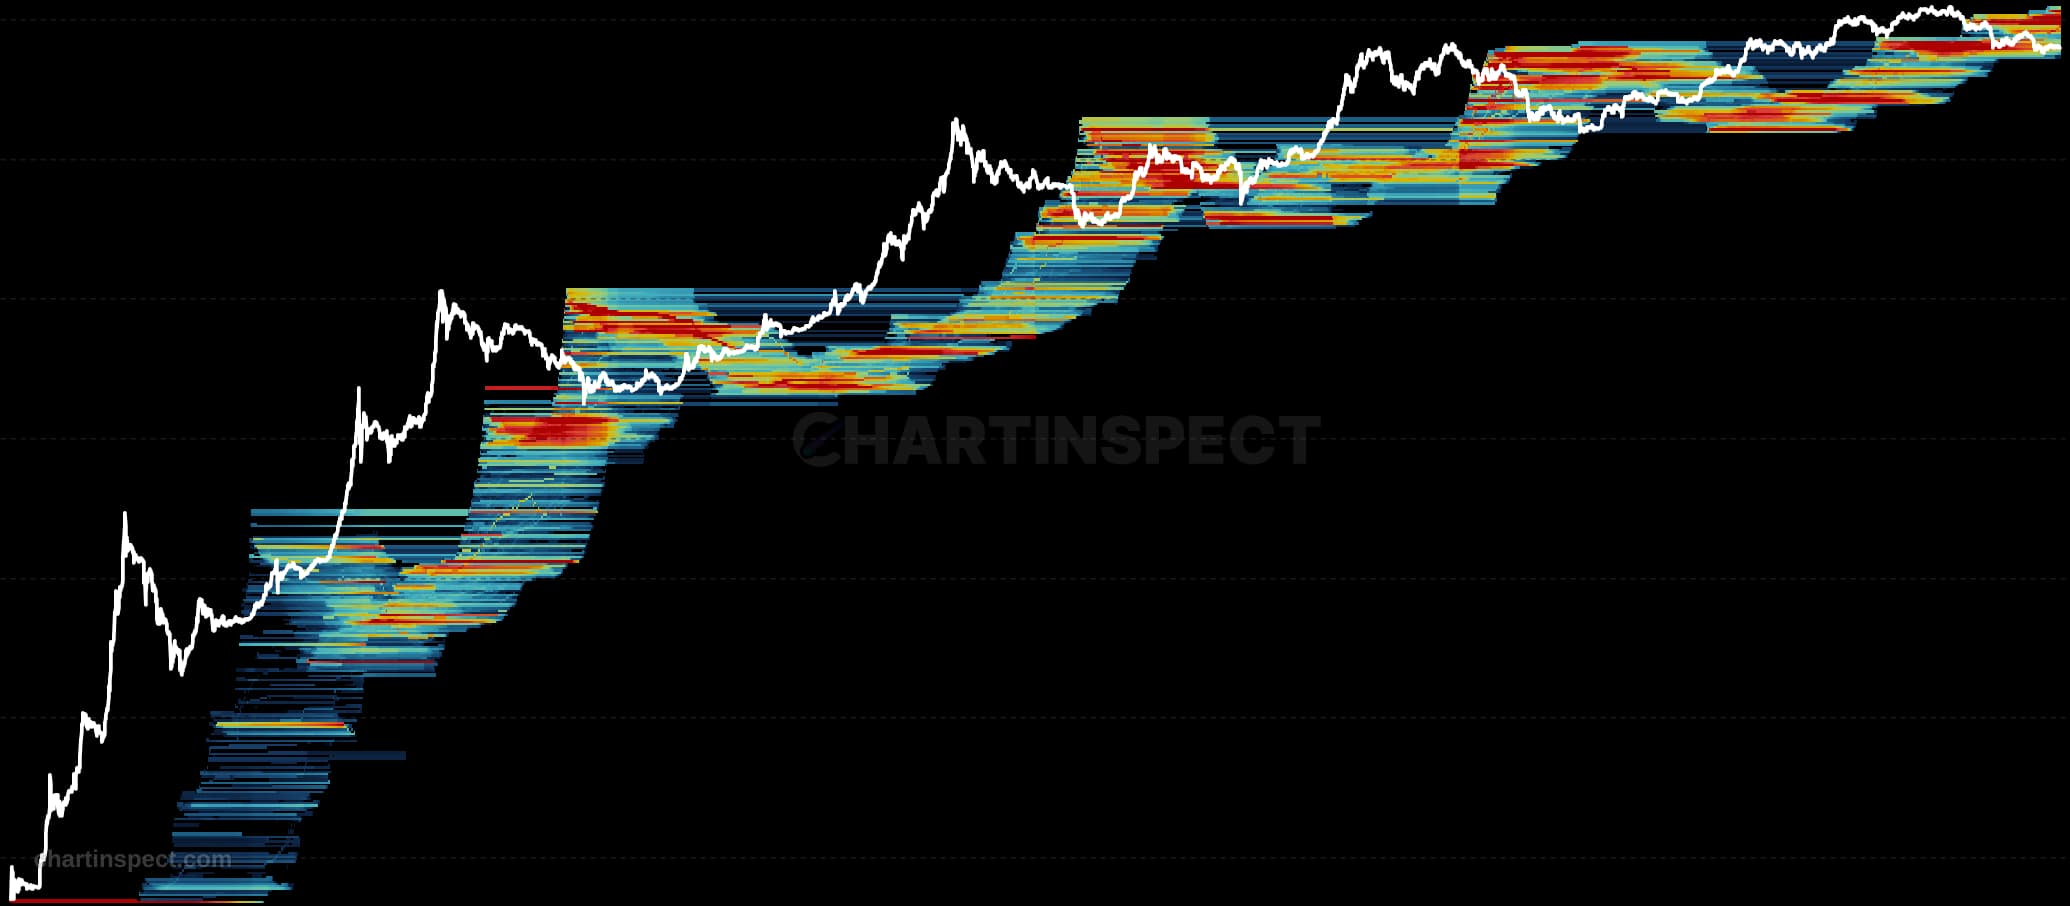
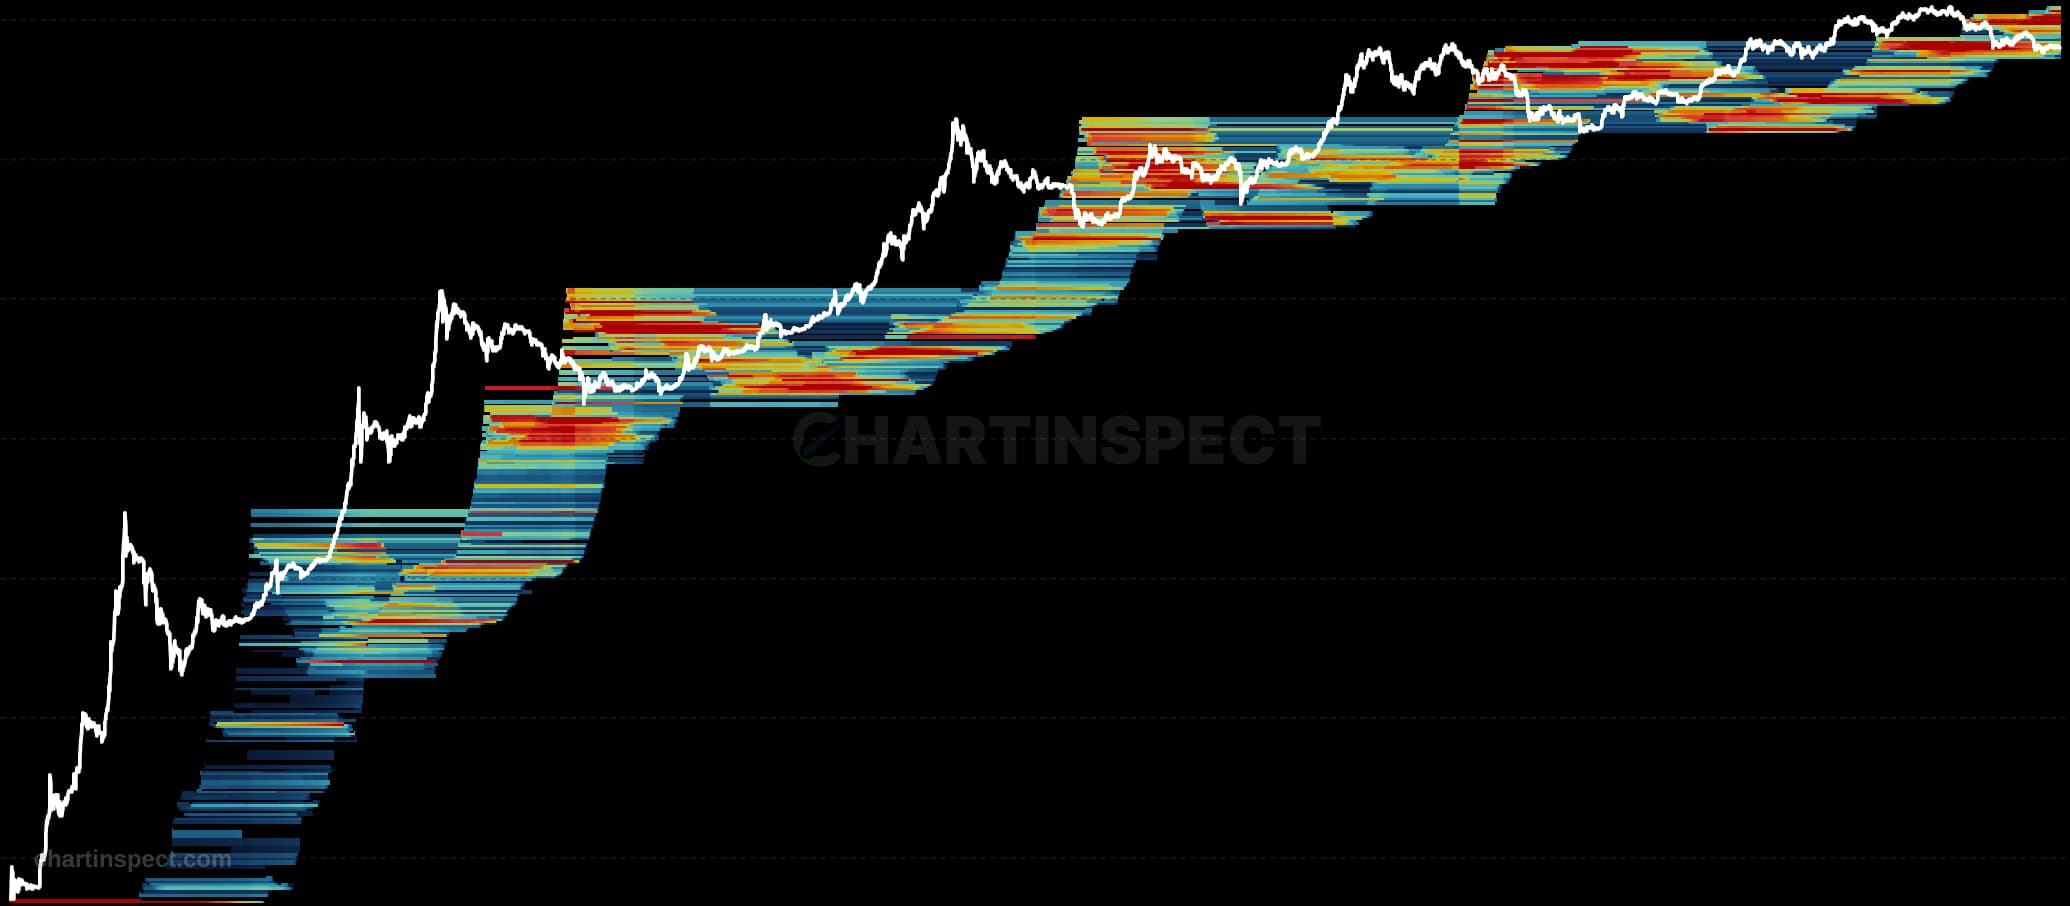
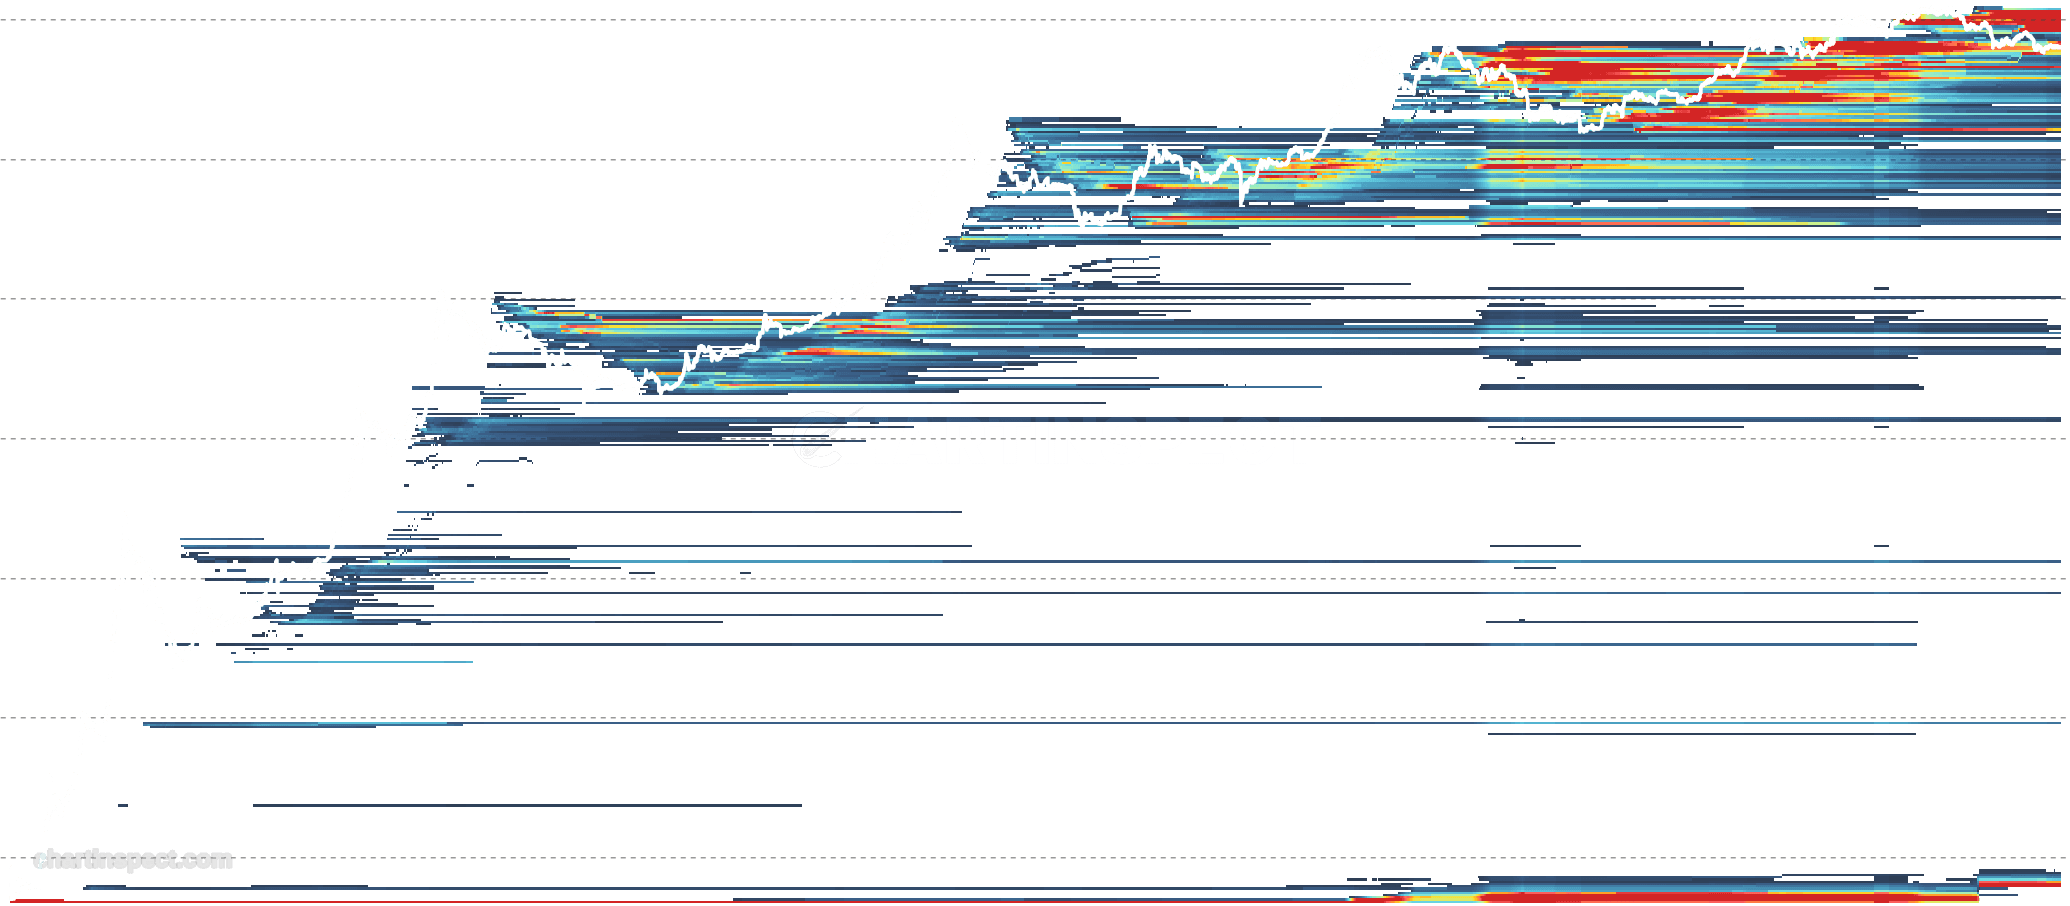
Bitcoin URPD History maps the UTXO Realized Price Distribution across the entire history of the network, plotting how much supply sits at each cost-basis price band for every day Bitcoin has existed. Every coin is placed into a price bucket according to the value it last moved on-chain, and the resulting distribution is stacked into a single vertical column per day. Read left to right, the chart becomes a heatmap of the network's aggregate cost basis evolving through time rather than a single snapshot.
Each column is one day of Bitcoin history, and brighter bands hold more supply acquired at that price level. Dense, luminous clusters mark prices where large volumes of coins changed hands and settled; faint regions mark price ranges that supply passed through quickly. As you scan across cycles, you can watch these cost-basis clusters build up as accumulation concentrates and dissolve as coins are spent and repriced, tracing where support and resistance formed and later broke.
Use URPD History to see structure that single-day distributions hide. Thick bands directly beneath the current price often act as support, since holders there are in profit and less likely to sell at a loss, while heavy bands overhead can cap advances as trapped buyers exit near break-even. Following clusters as they migrate across entire market cycles shows how Bitcoin's holder base repriced through each bull and bear phase.
Check the selected asset, units, and cohort before comparing readings. Compare the metric over consistent dates and use related measures to understand what contributes to a change.