Loading chart data
Chain
Smoothing
Loading chart data
About BCH URPD History
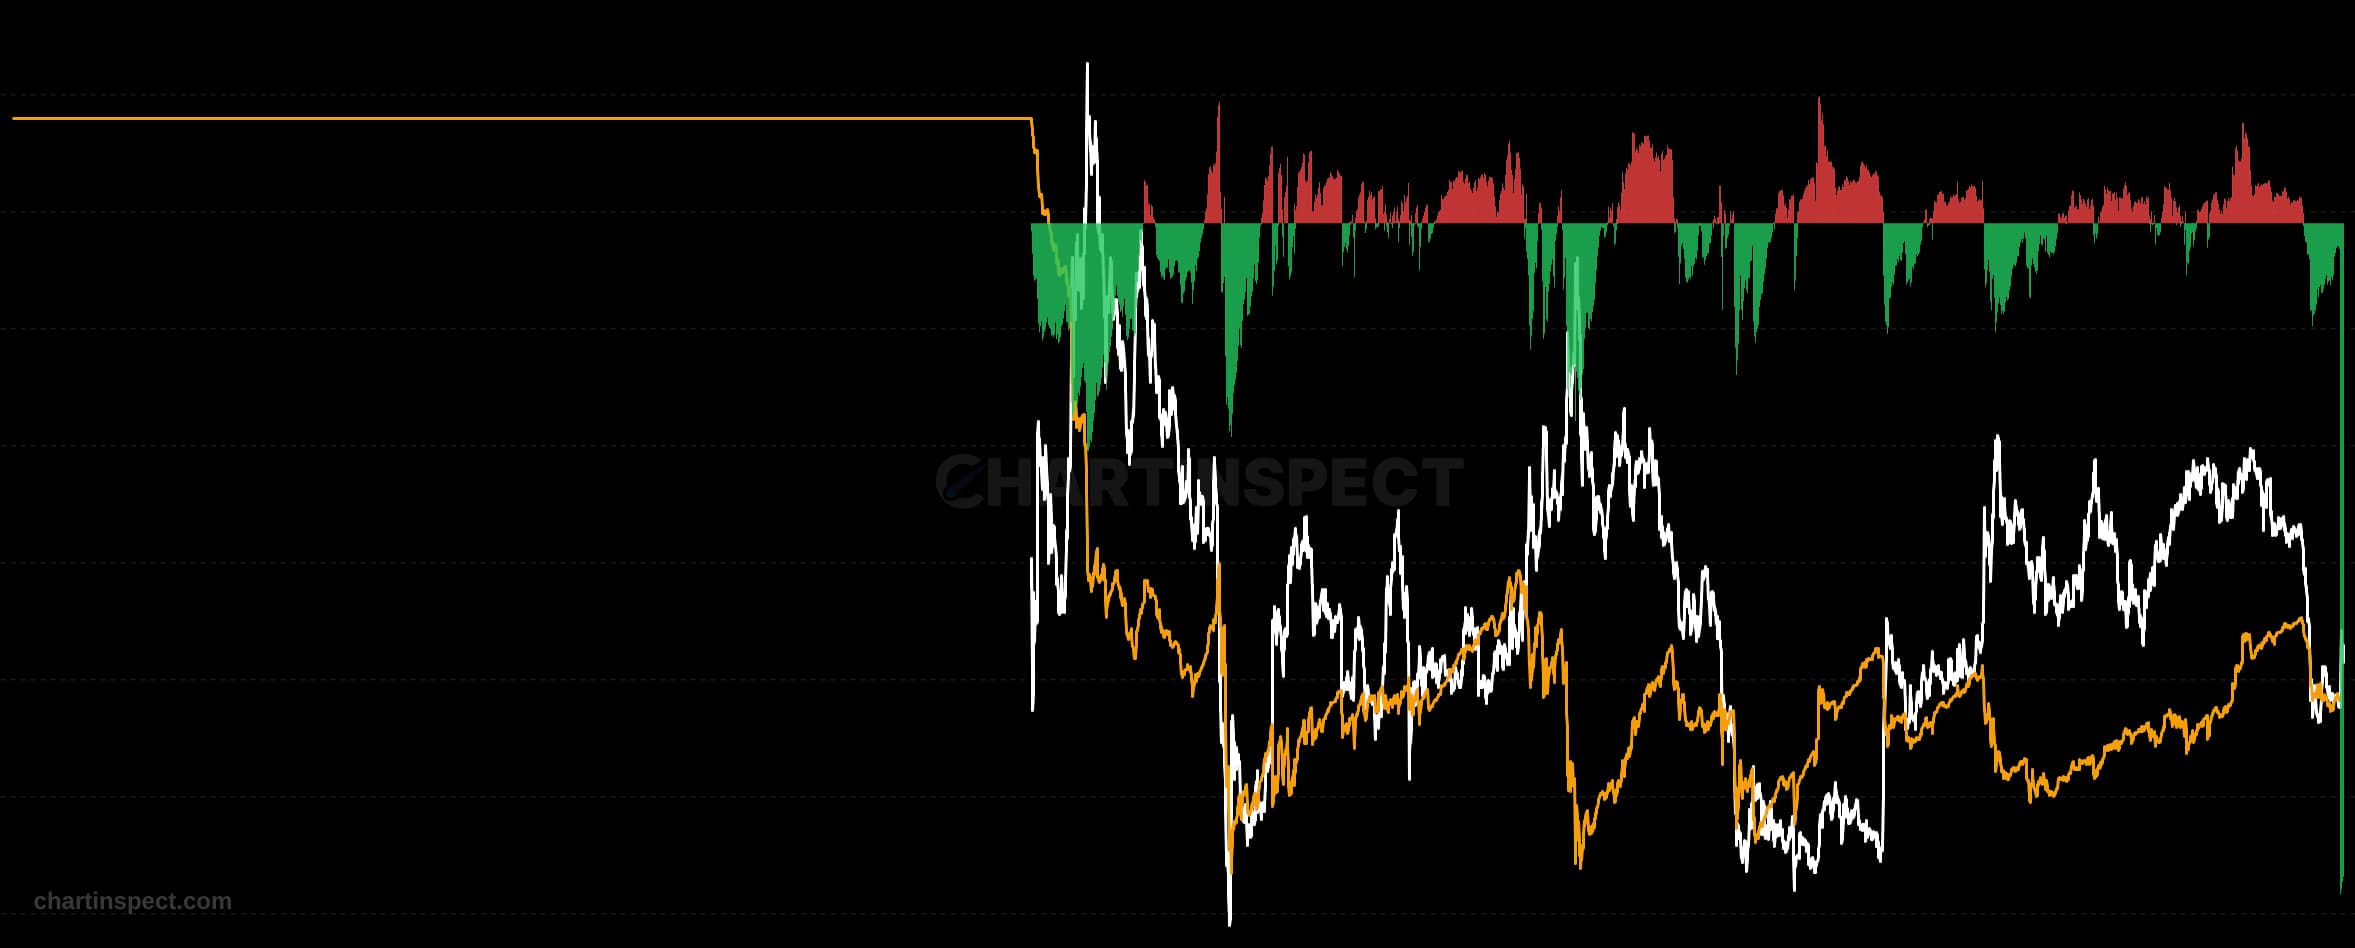
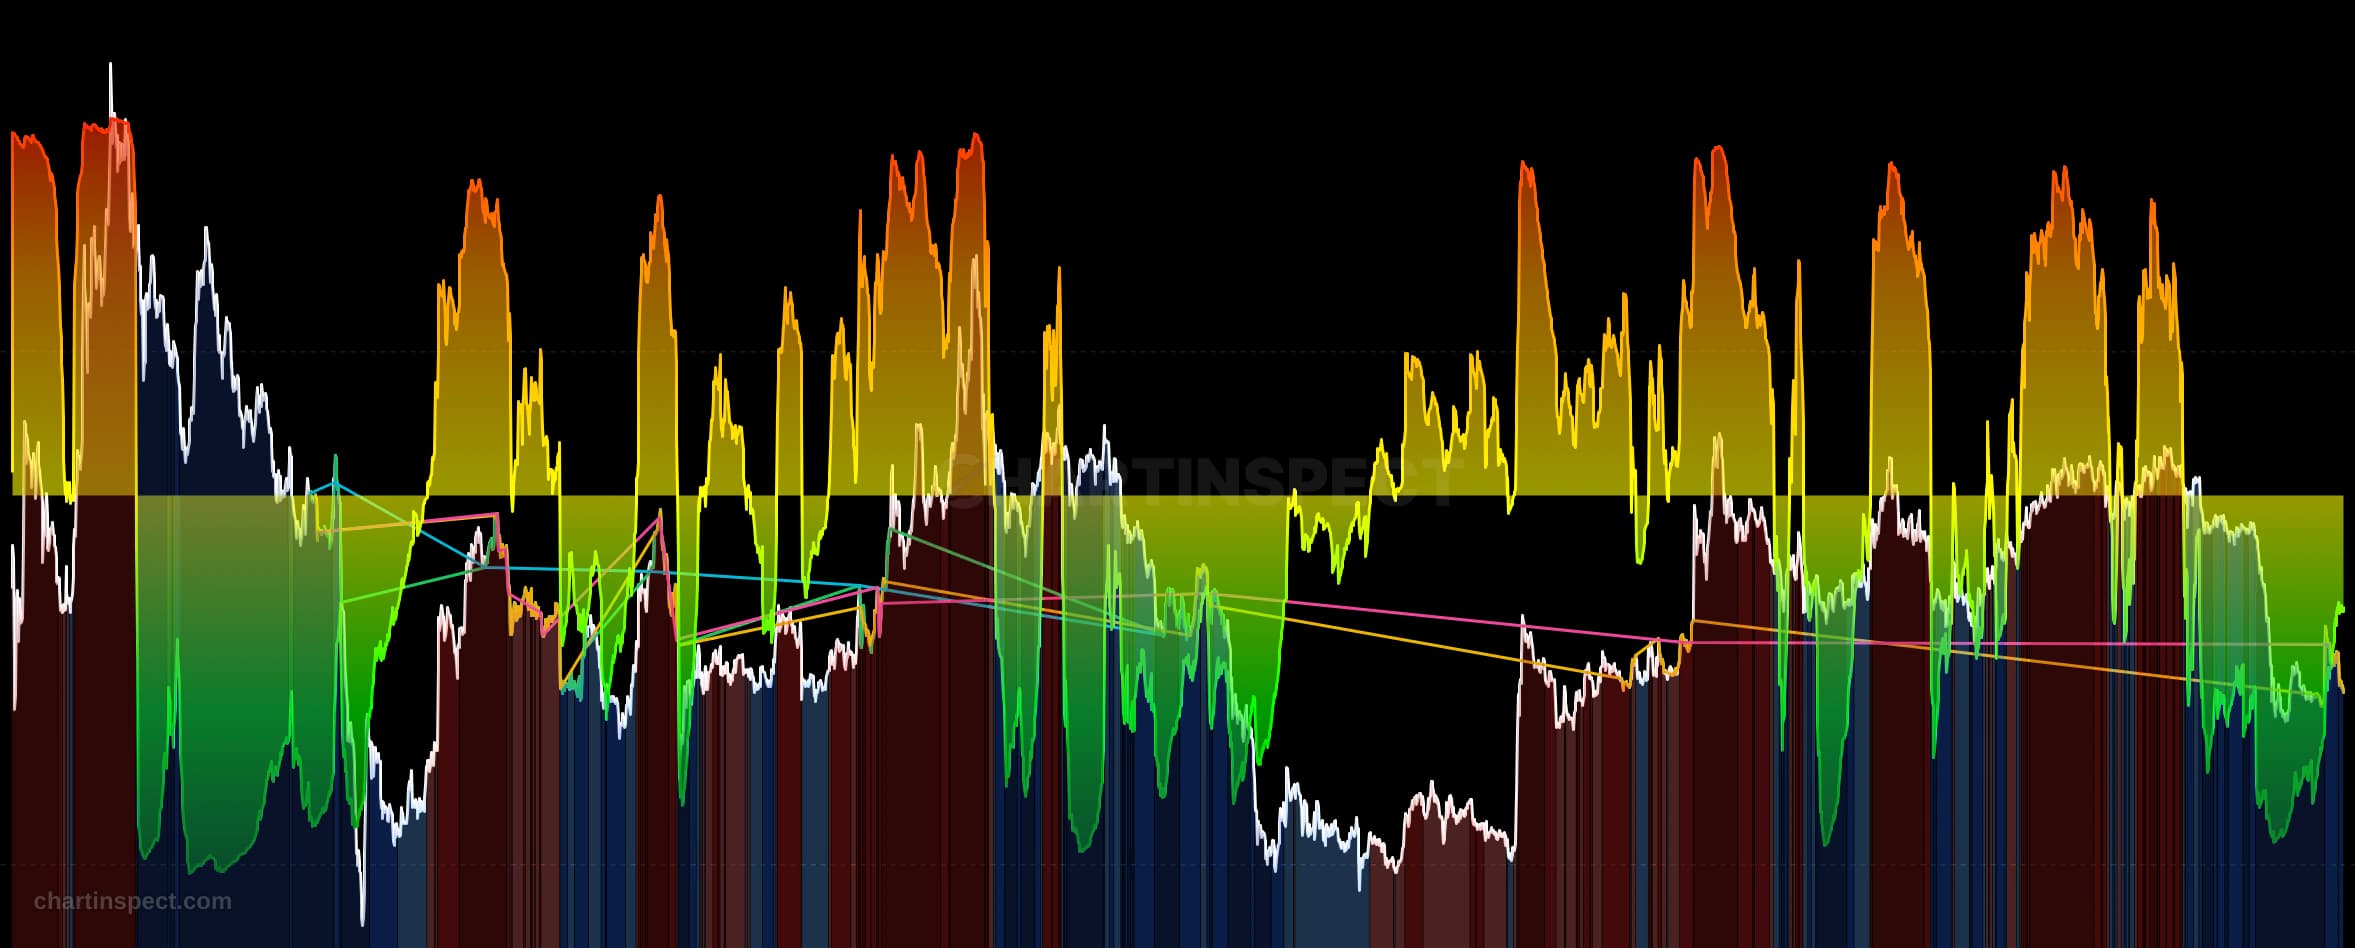
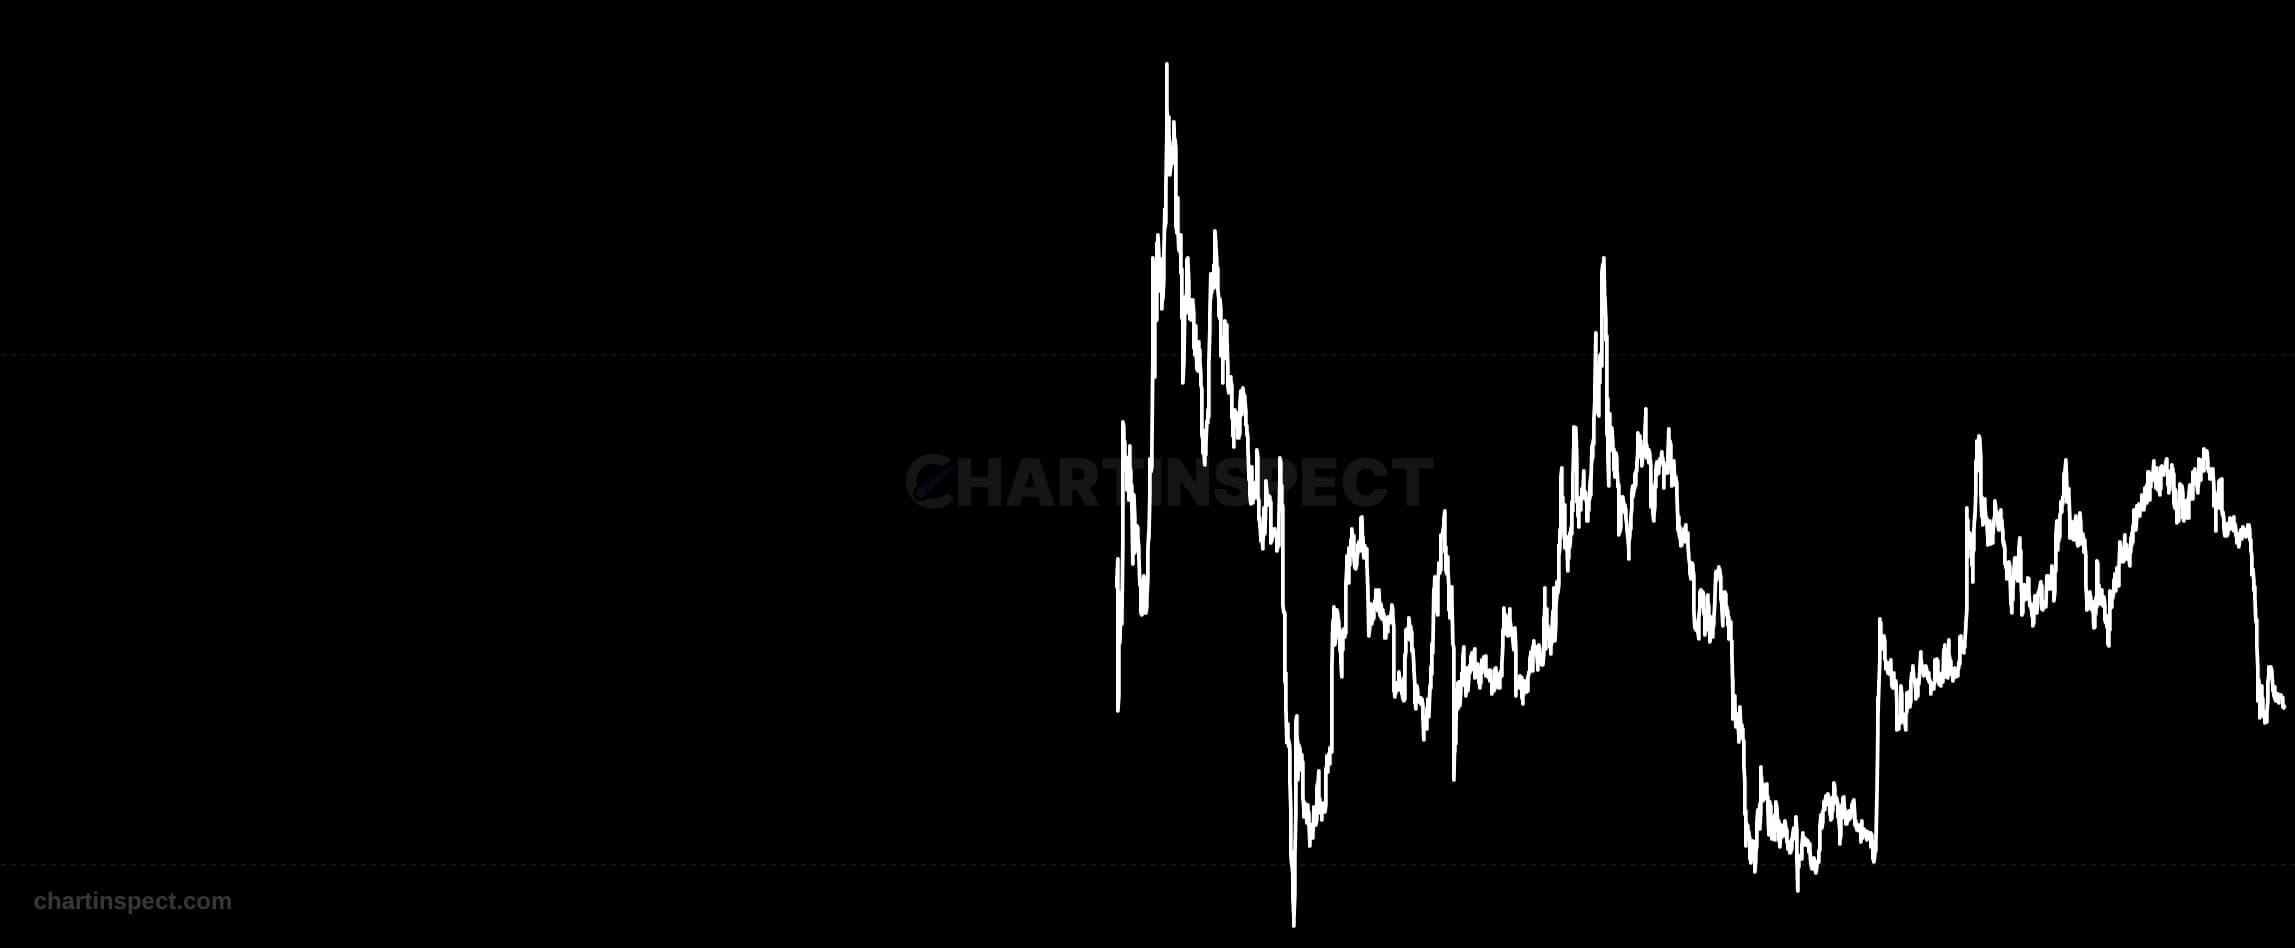
The full historical UTXO Realized Price Distribution, supply across cost-basis price bands, for every day of Bitcoin Cash history. Each column is one day; brighter bands hold more supply acquired at that price. Watch cost-basis clusters build and dissolve across entire market cycles, revealing how support and resistance levels formed and broke.
Freshness: Not yet verified
Community snapshot
No community calls on BCH URPD History yet. Be the first to share a take.
Also available for

Related Analytics


Discover more insights with our comprehensive chart collection
Explore All 9143 Charts