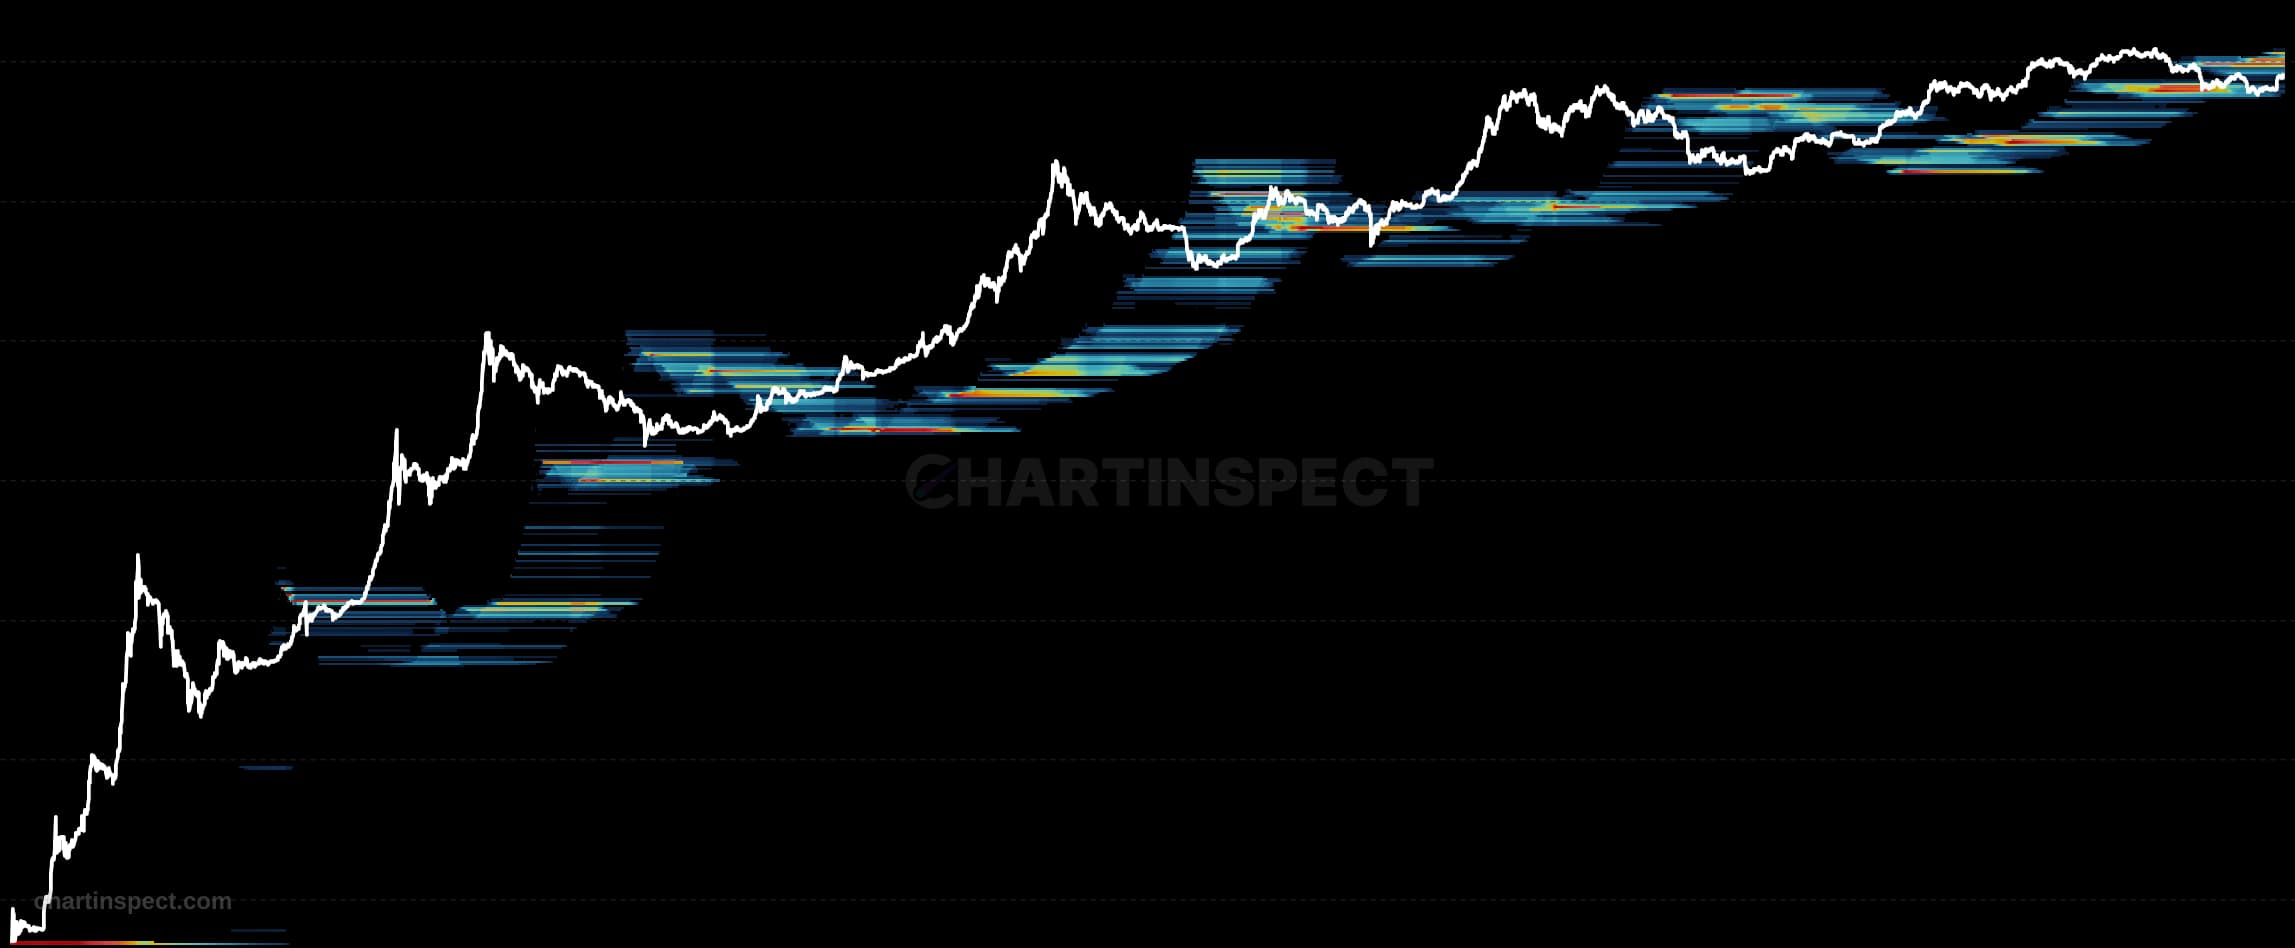
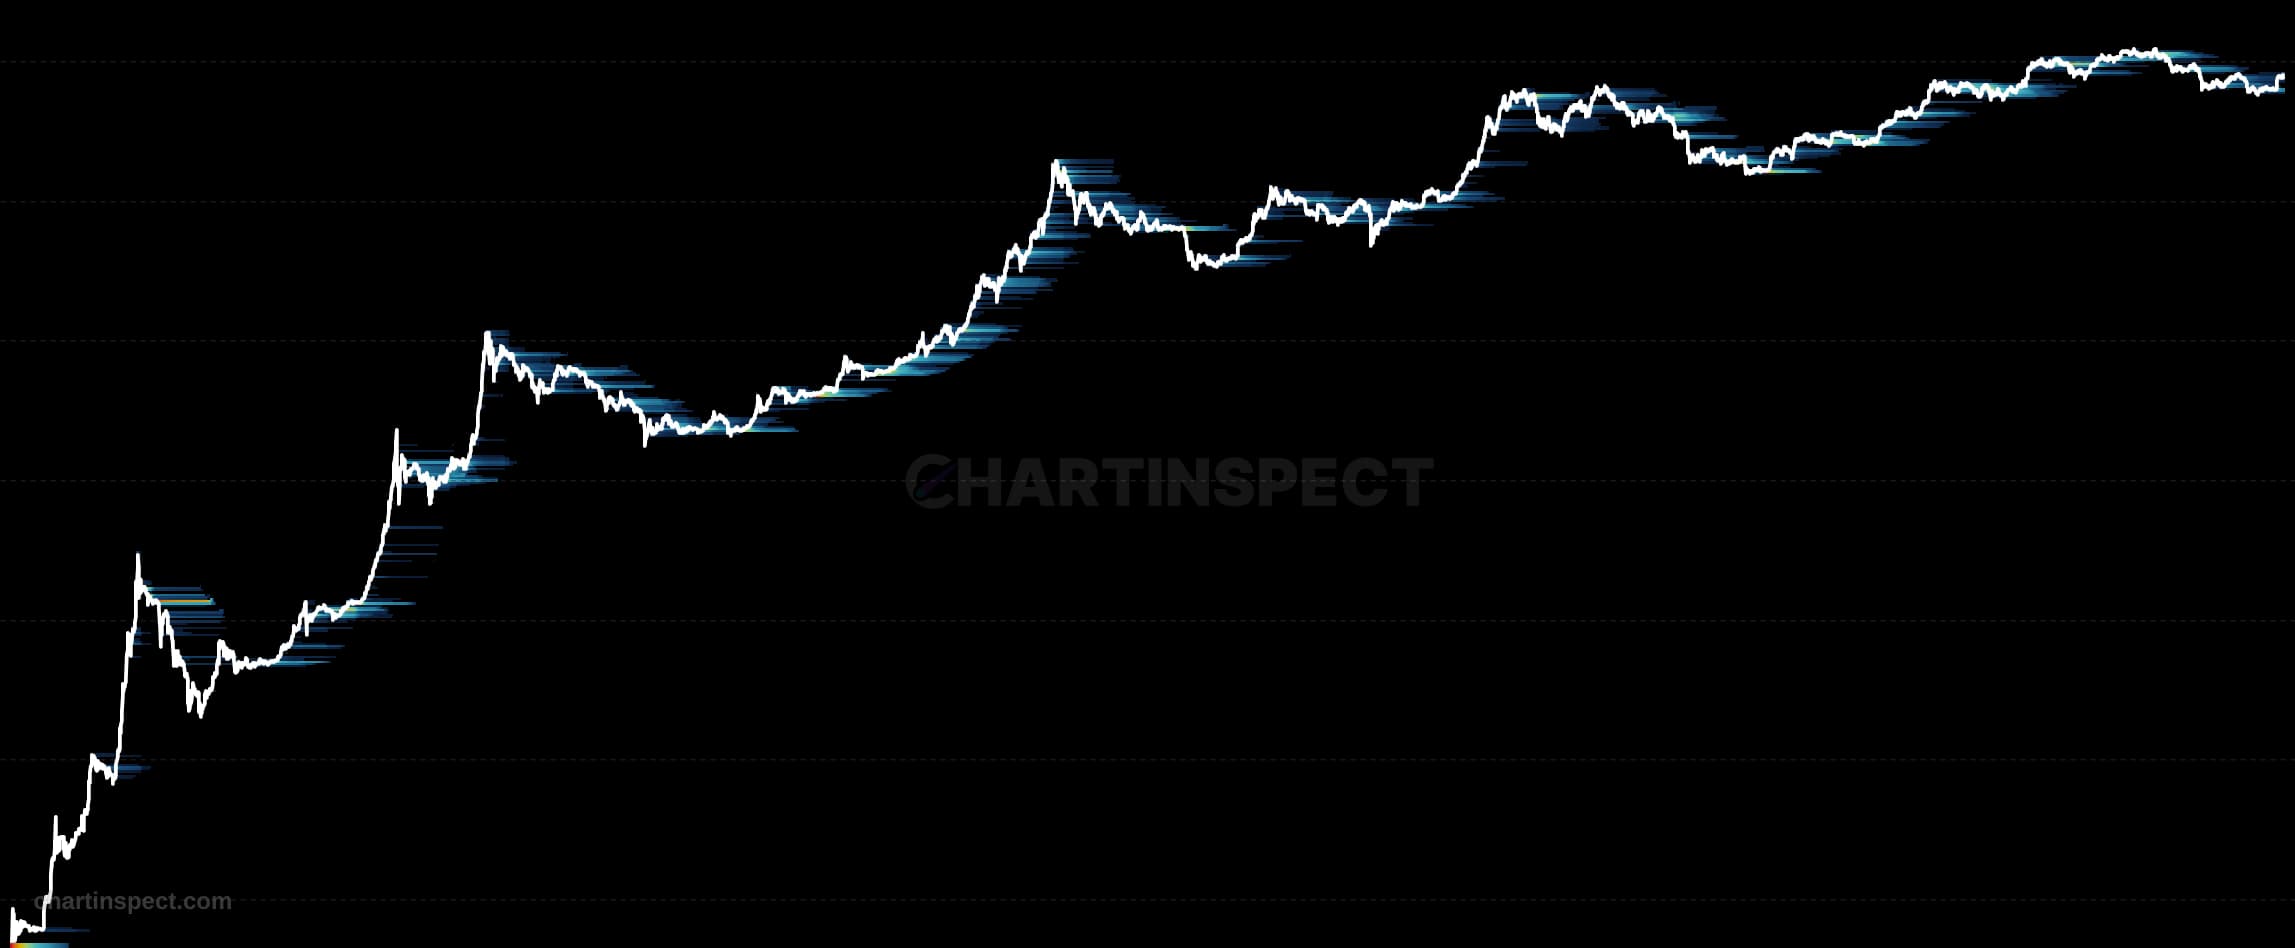
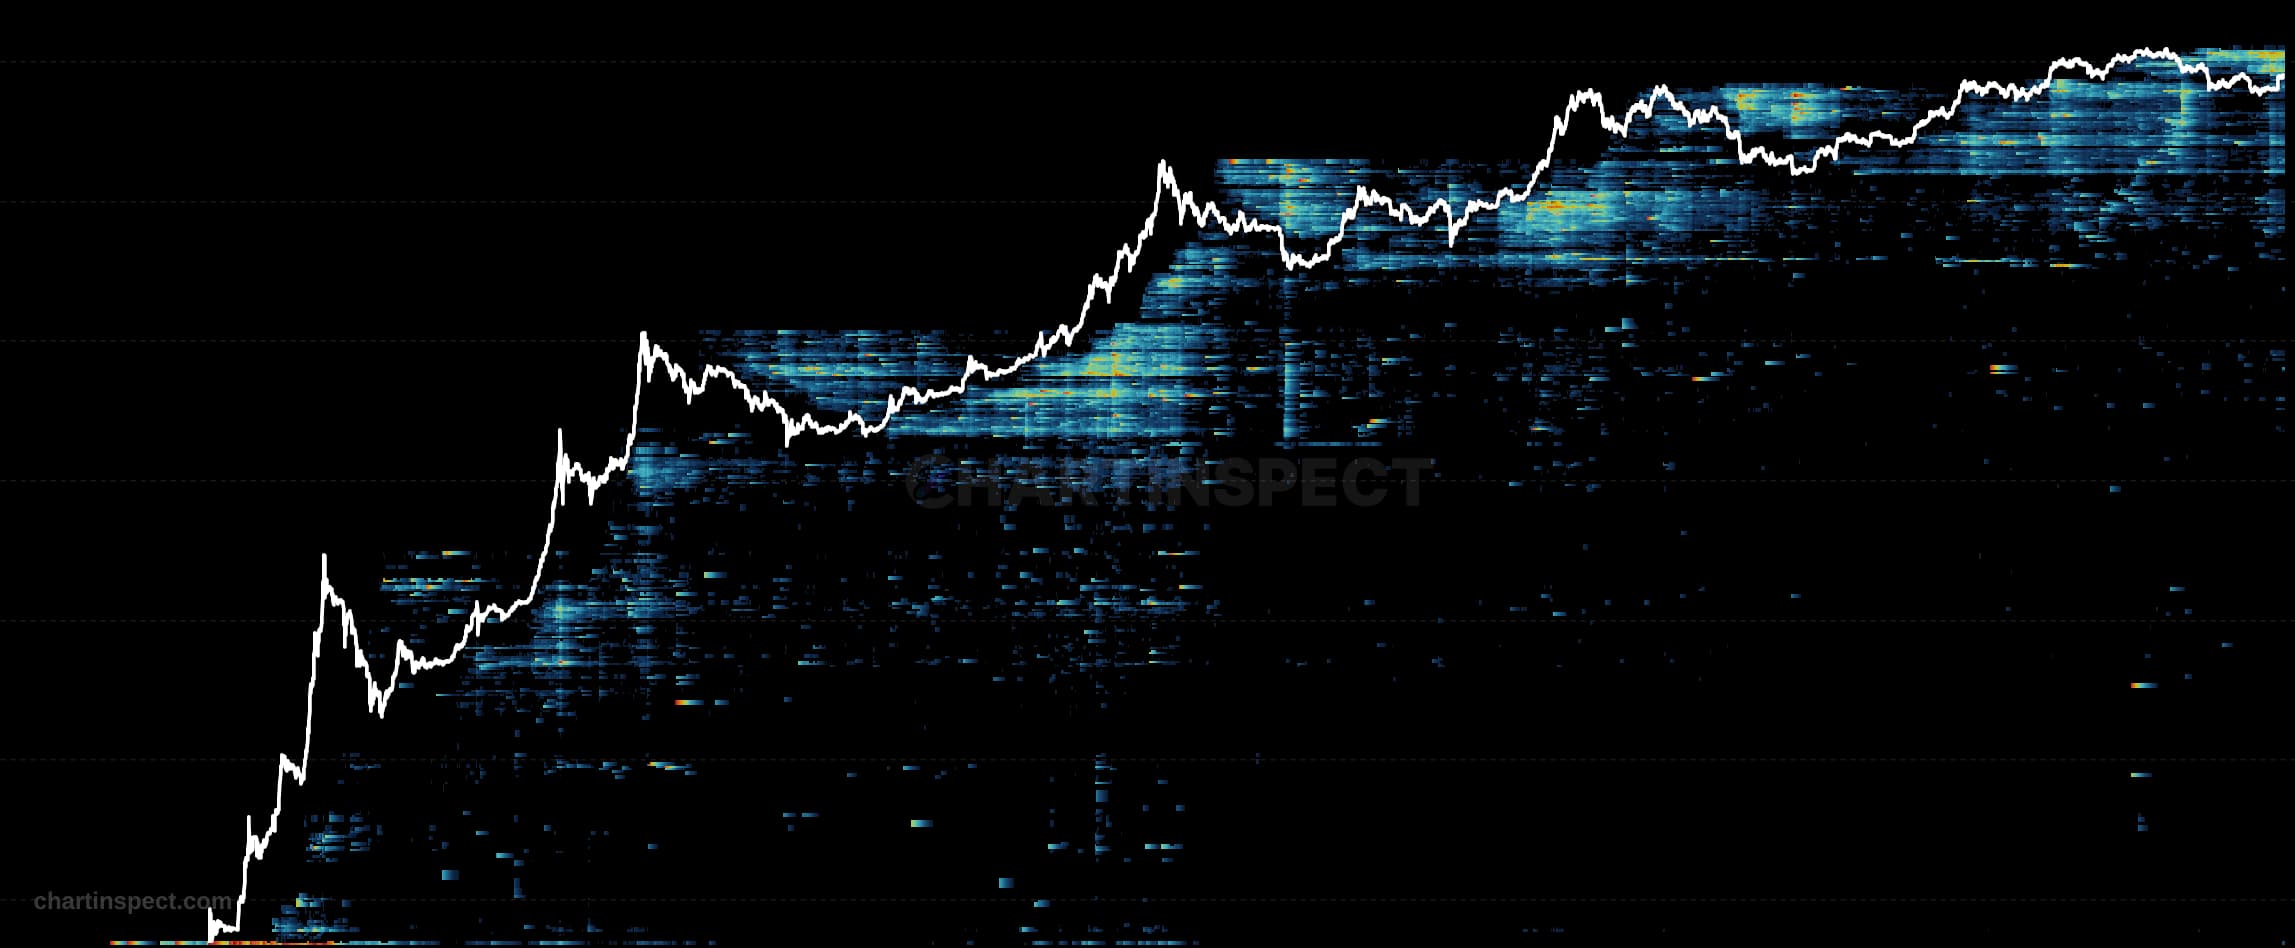
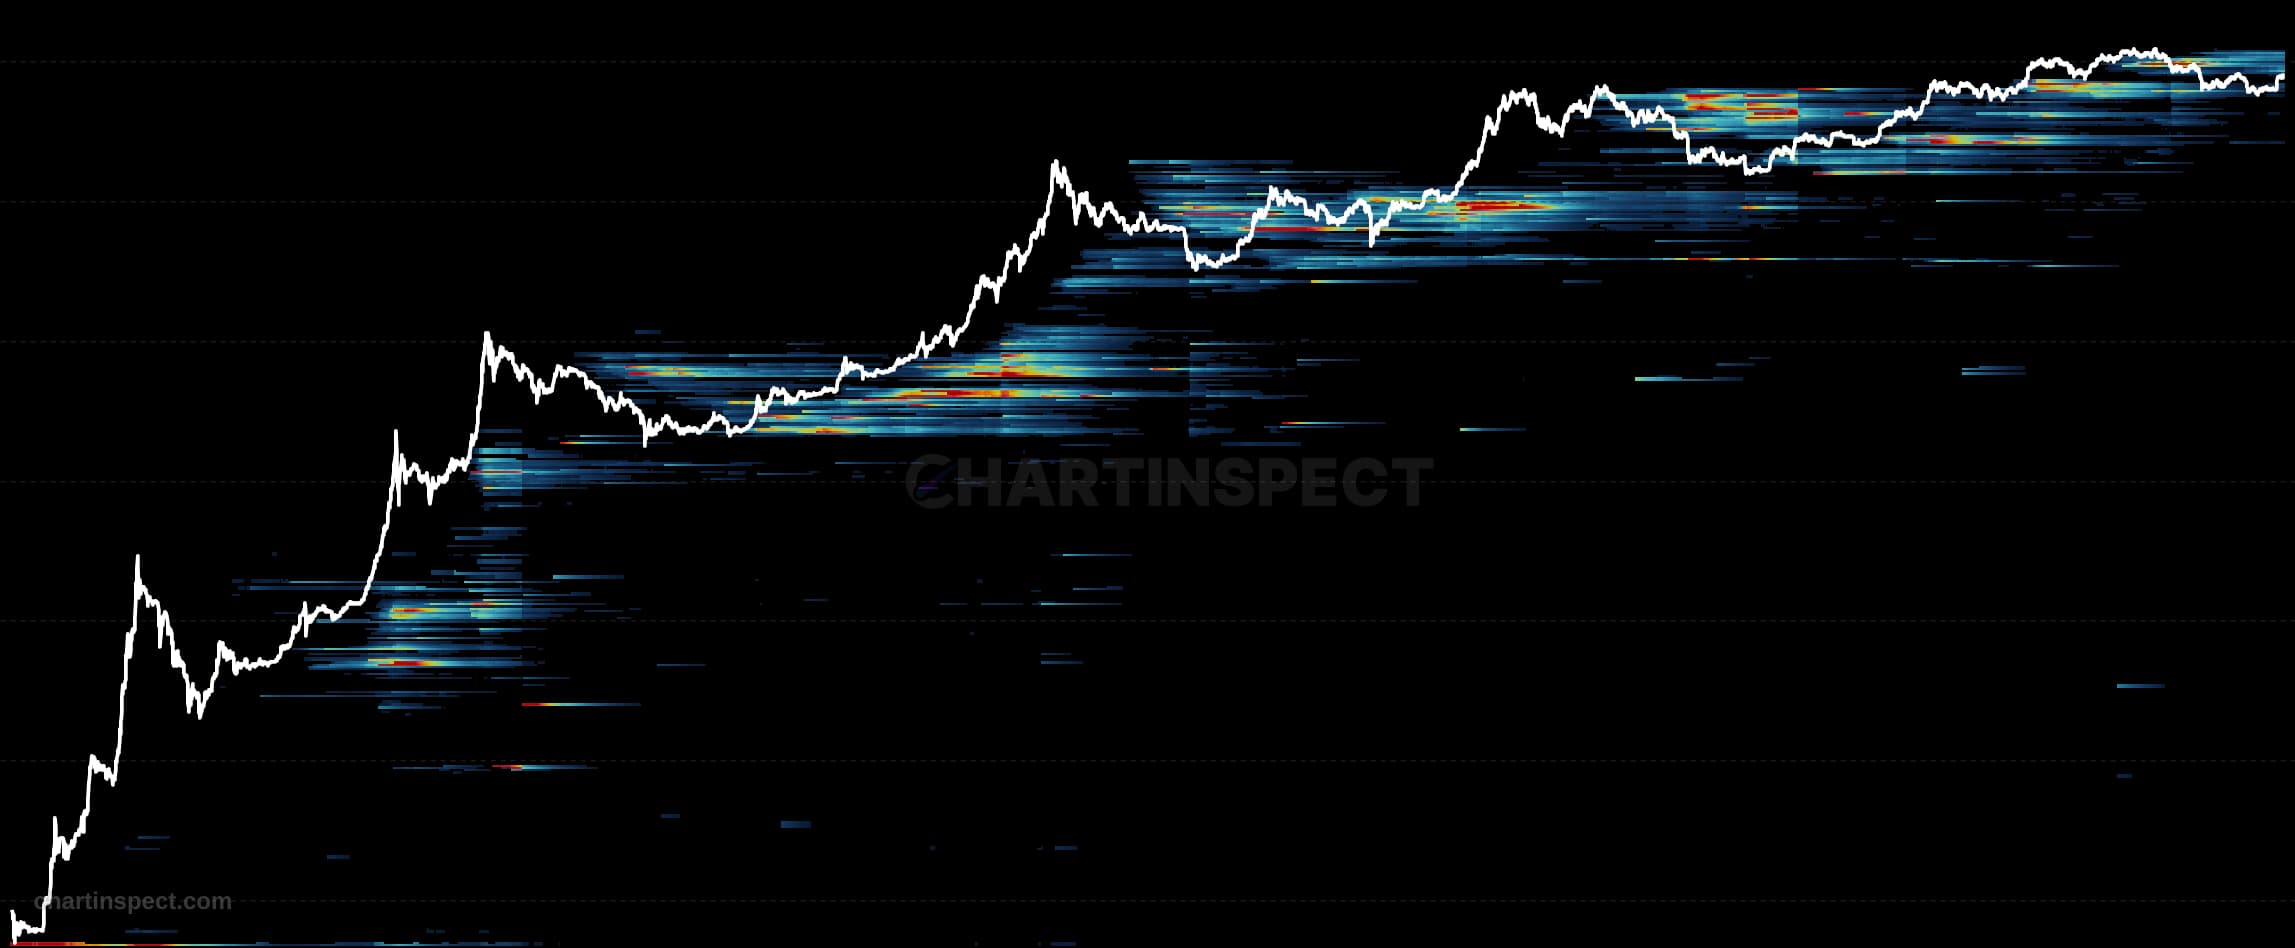
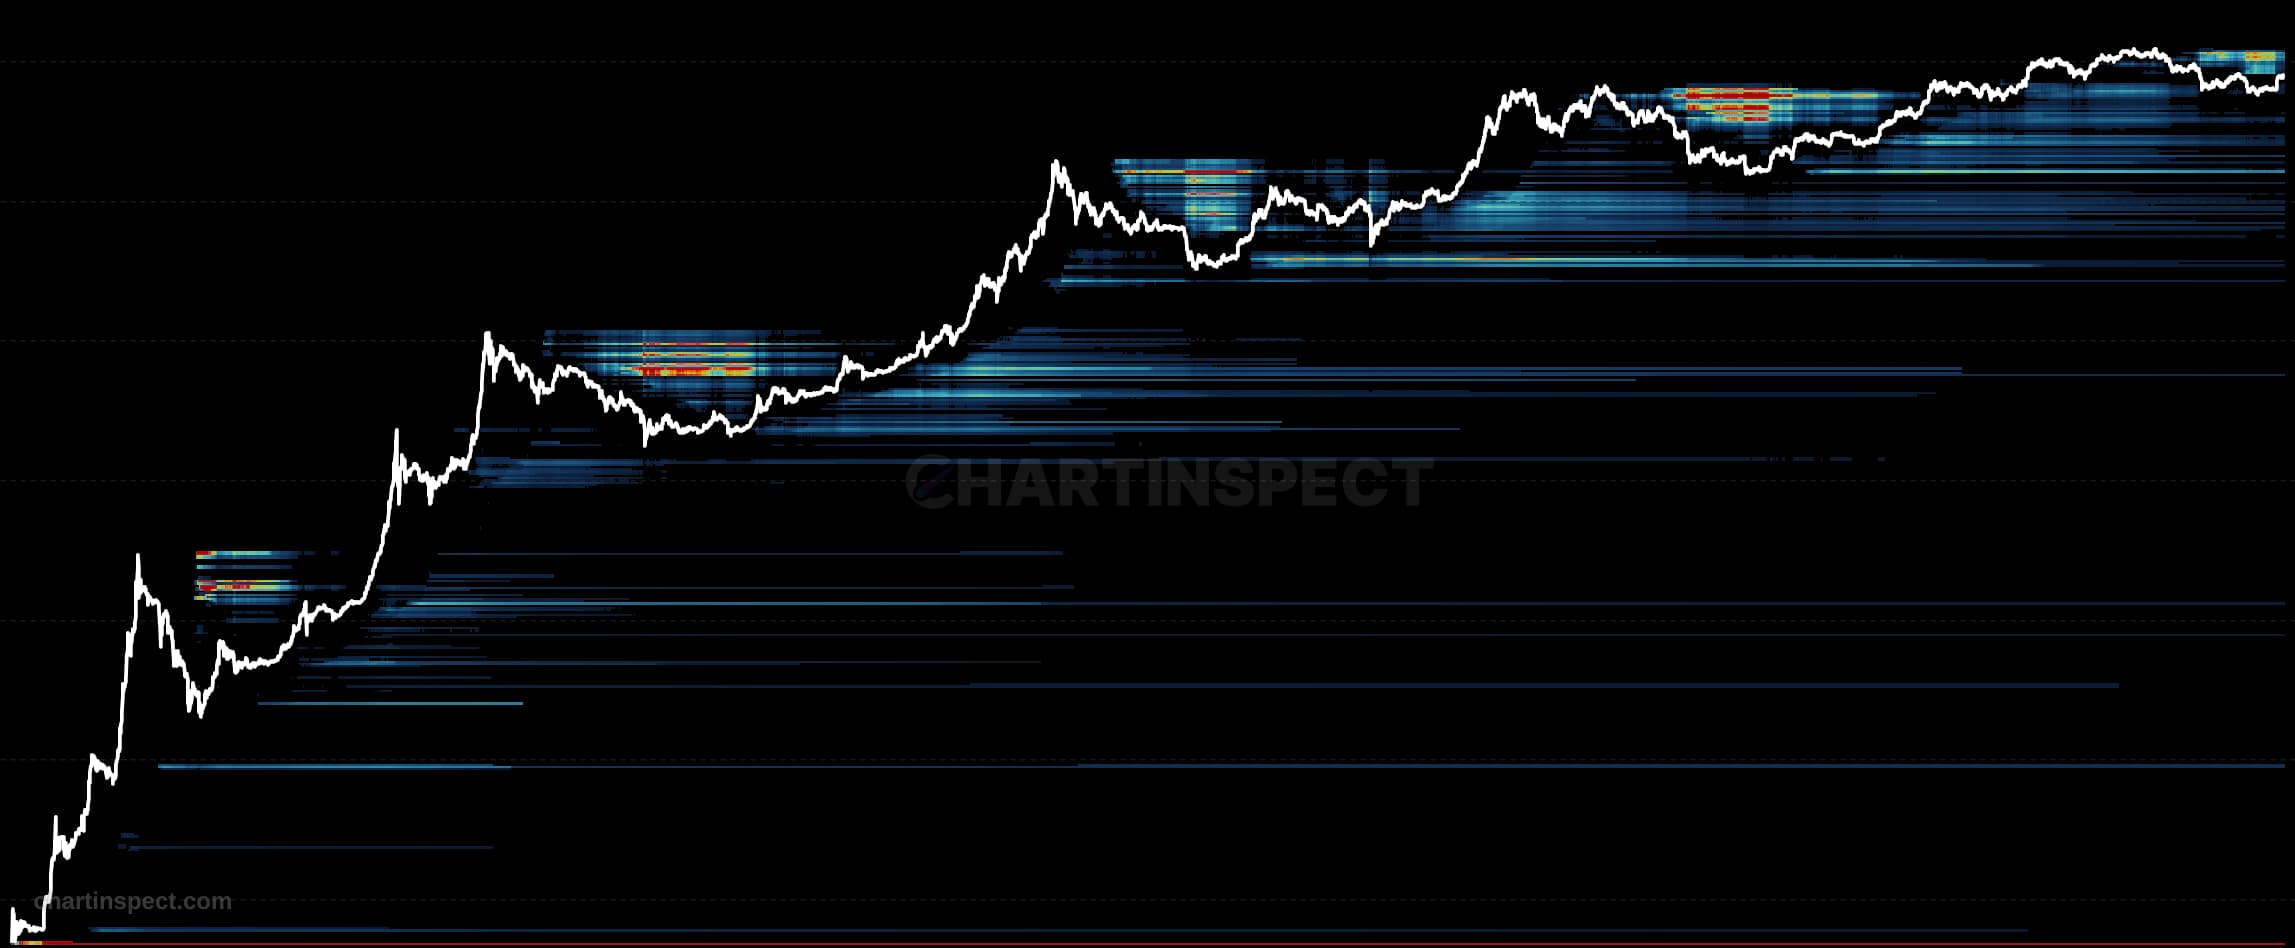
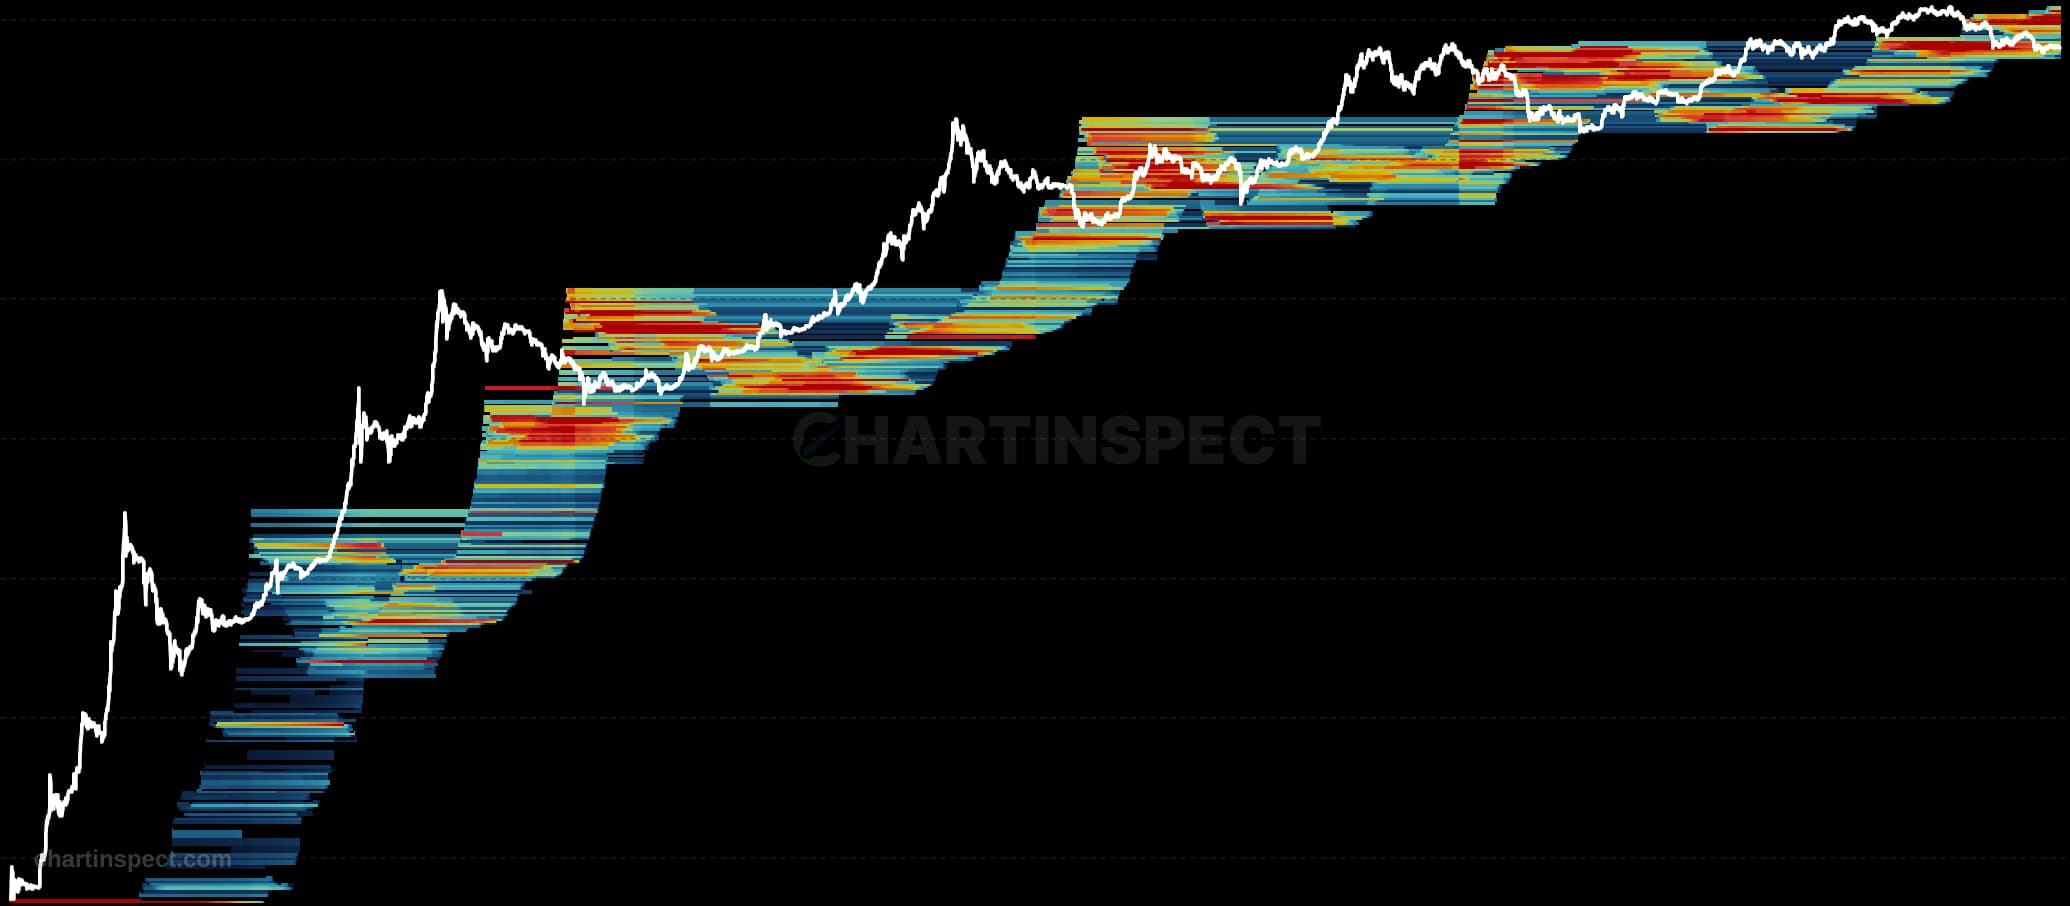
The Bitcoin LTH Address Count Heatmap counts the number of distinct Long-Term Holder addresses whose Bitcoin sits in each cost-basis bucket. Every seasoned holder's coins are grouped by the price at which they were last acquired, and the chart tallies how many such holders populate each historical acquisition-price band over time. The result is a two-dimensional map: time along the horizontal axis, cost-basis price along the vertical, and holder population encoded as color intensity in each cell.
Read the heatmap by looking for hot bands, the price levels where the largest population of long-term holders concentrated their entries. Bright horizontal clusters mark acquisition zones that many seasoned holders share, so they tend to act as memory levels for the network: prices where a large cohort first established its Bitcoin position. Cooler cells indicate price buckets holding few long-term holders, and the way bands migrate or persist across time shows whether seasoned supply is accumulating at new levels or staying anchored to older ones.
Use the chart to gauge where conviction supply is parked. Dense long-term-holder clusters sitting well below the current Bitcoin price represent deeply profitable, historically patient holders, while clusters forming near recent prices show fresh seasoned accumulation. Tracking how these population bands build or thin out helps you see where the strongest hands entered and how firmly that base is likely to hold.
Check the selected asset, units, and cohort before comparing readings. Compare the metric over consistent dates and use related measures to understand what contributes to a change.