Loading chart data
Loading chart data
About 30-Year Treasury Rate
The 30-year Treasury yield is the longest point on the curve and the most sensitive to duration risk: a 1% yield move swings its price far more than a short bond. Because expectations that far out are mostly noise, it is read as a gauge of long-run inflation credibility and fiscal risk rather than as a growth forecast. A 30-year rising while the 2-year falls (a steepening curve) often marks the market pricing both Fed cuts and persistent inflation.
Freshness: Not yet verified
Community snapshot
No community calls on 30-Year Treasury Rate yet. Be the first to share a take.
Related Analytics
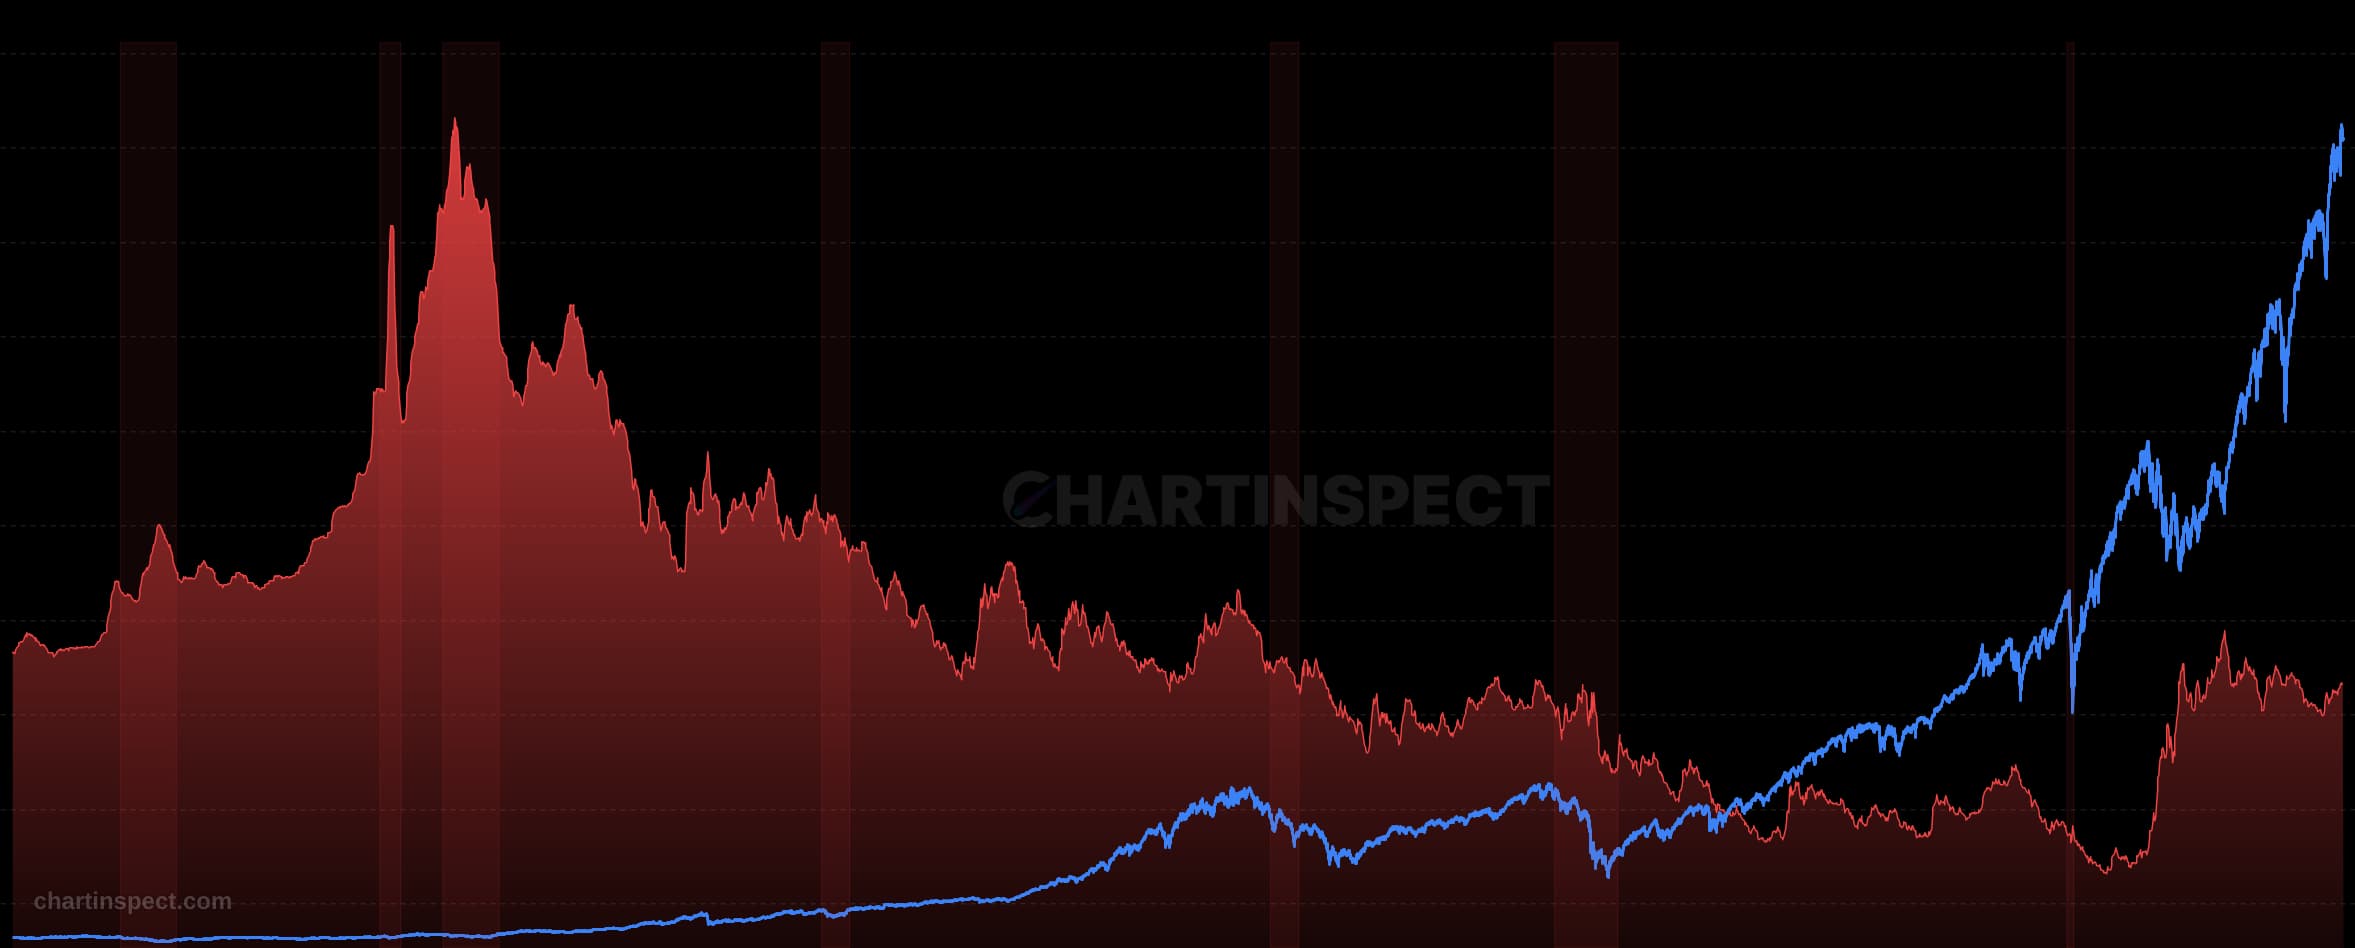
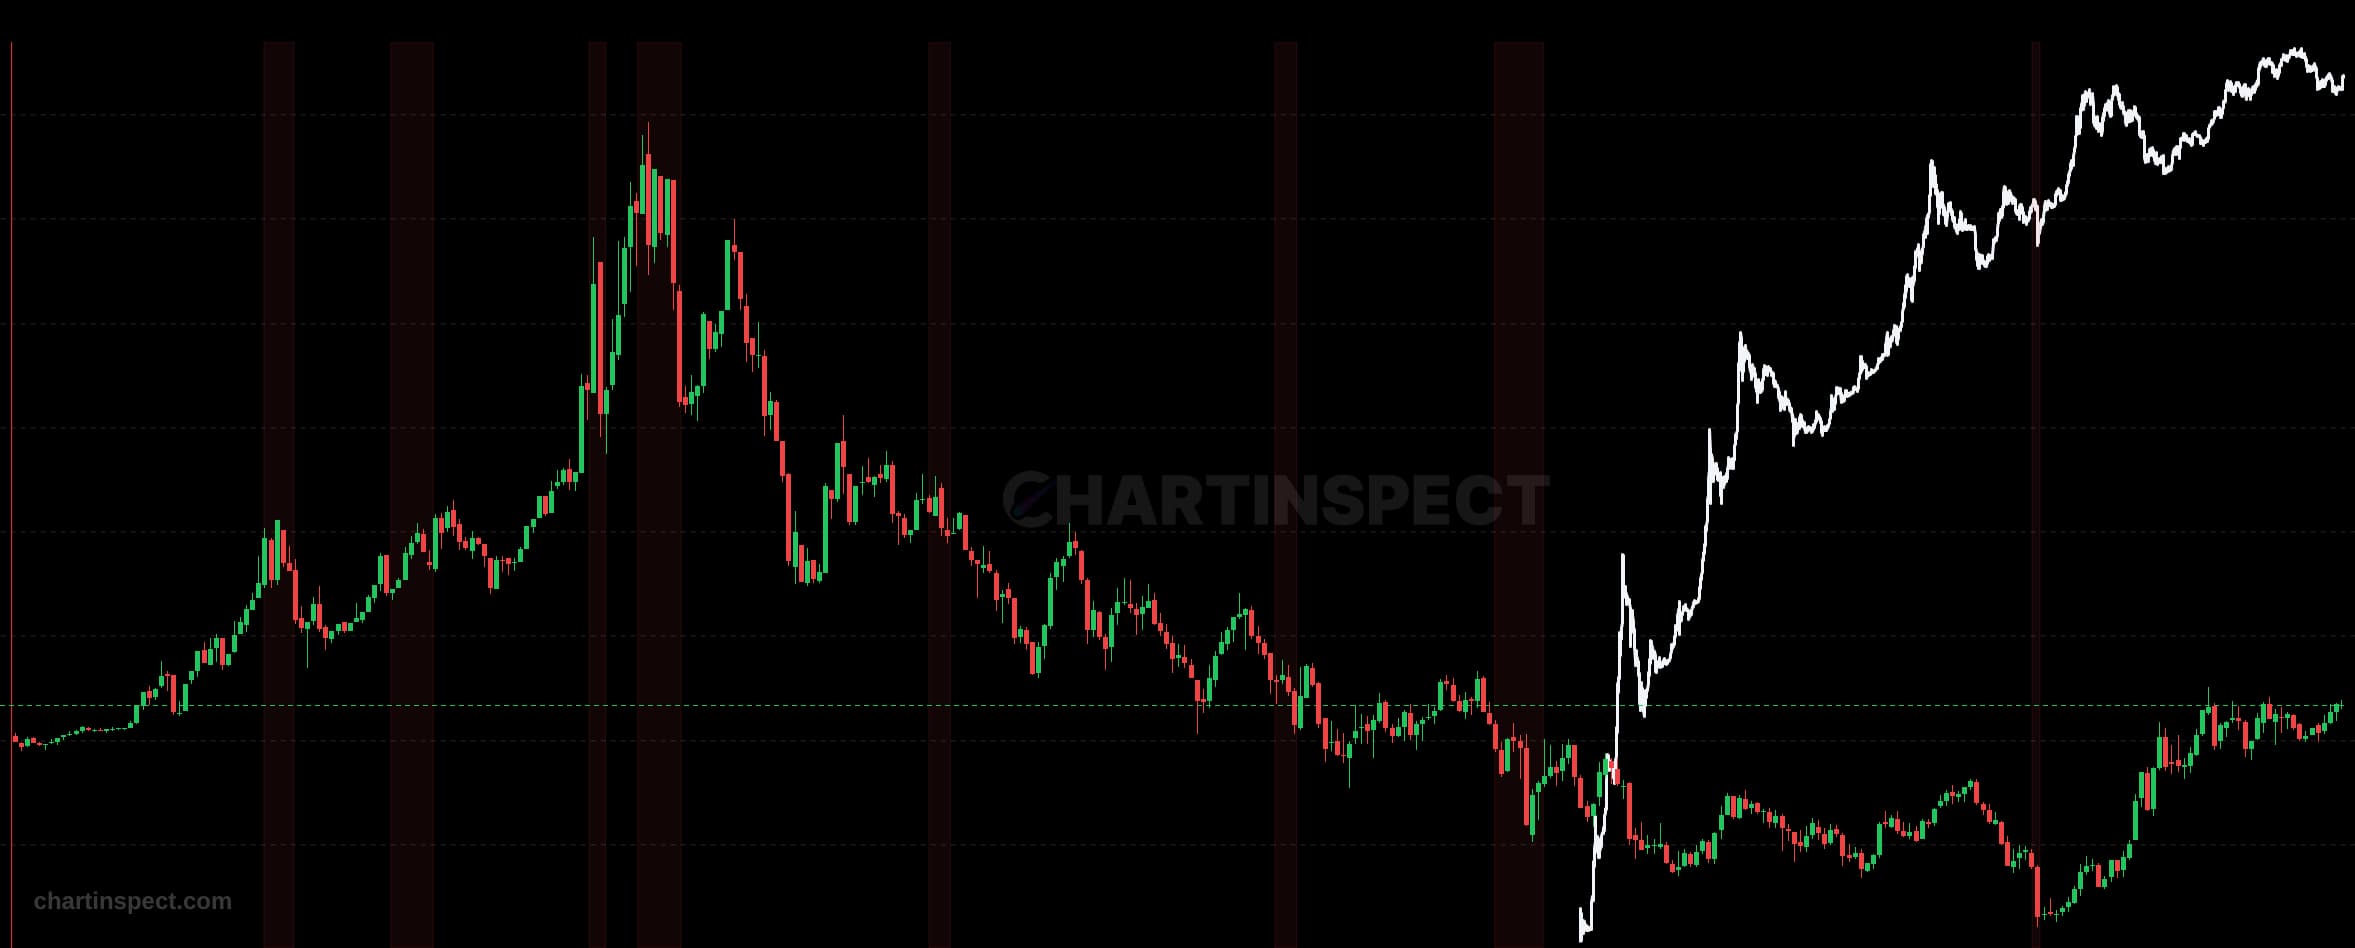
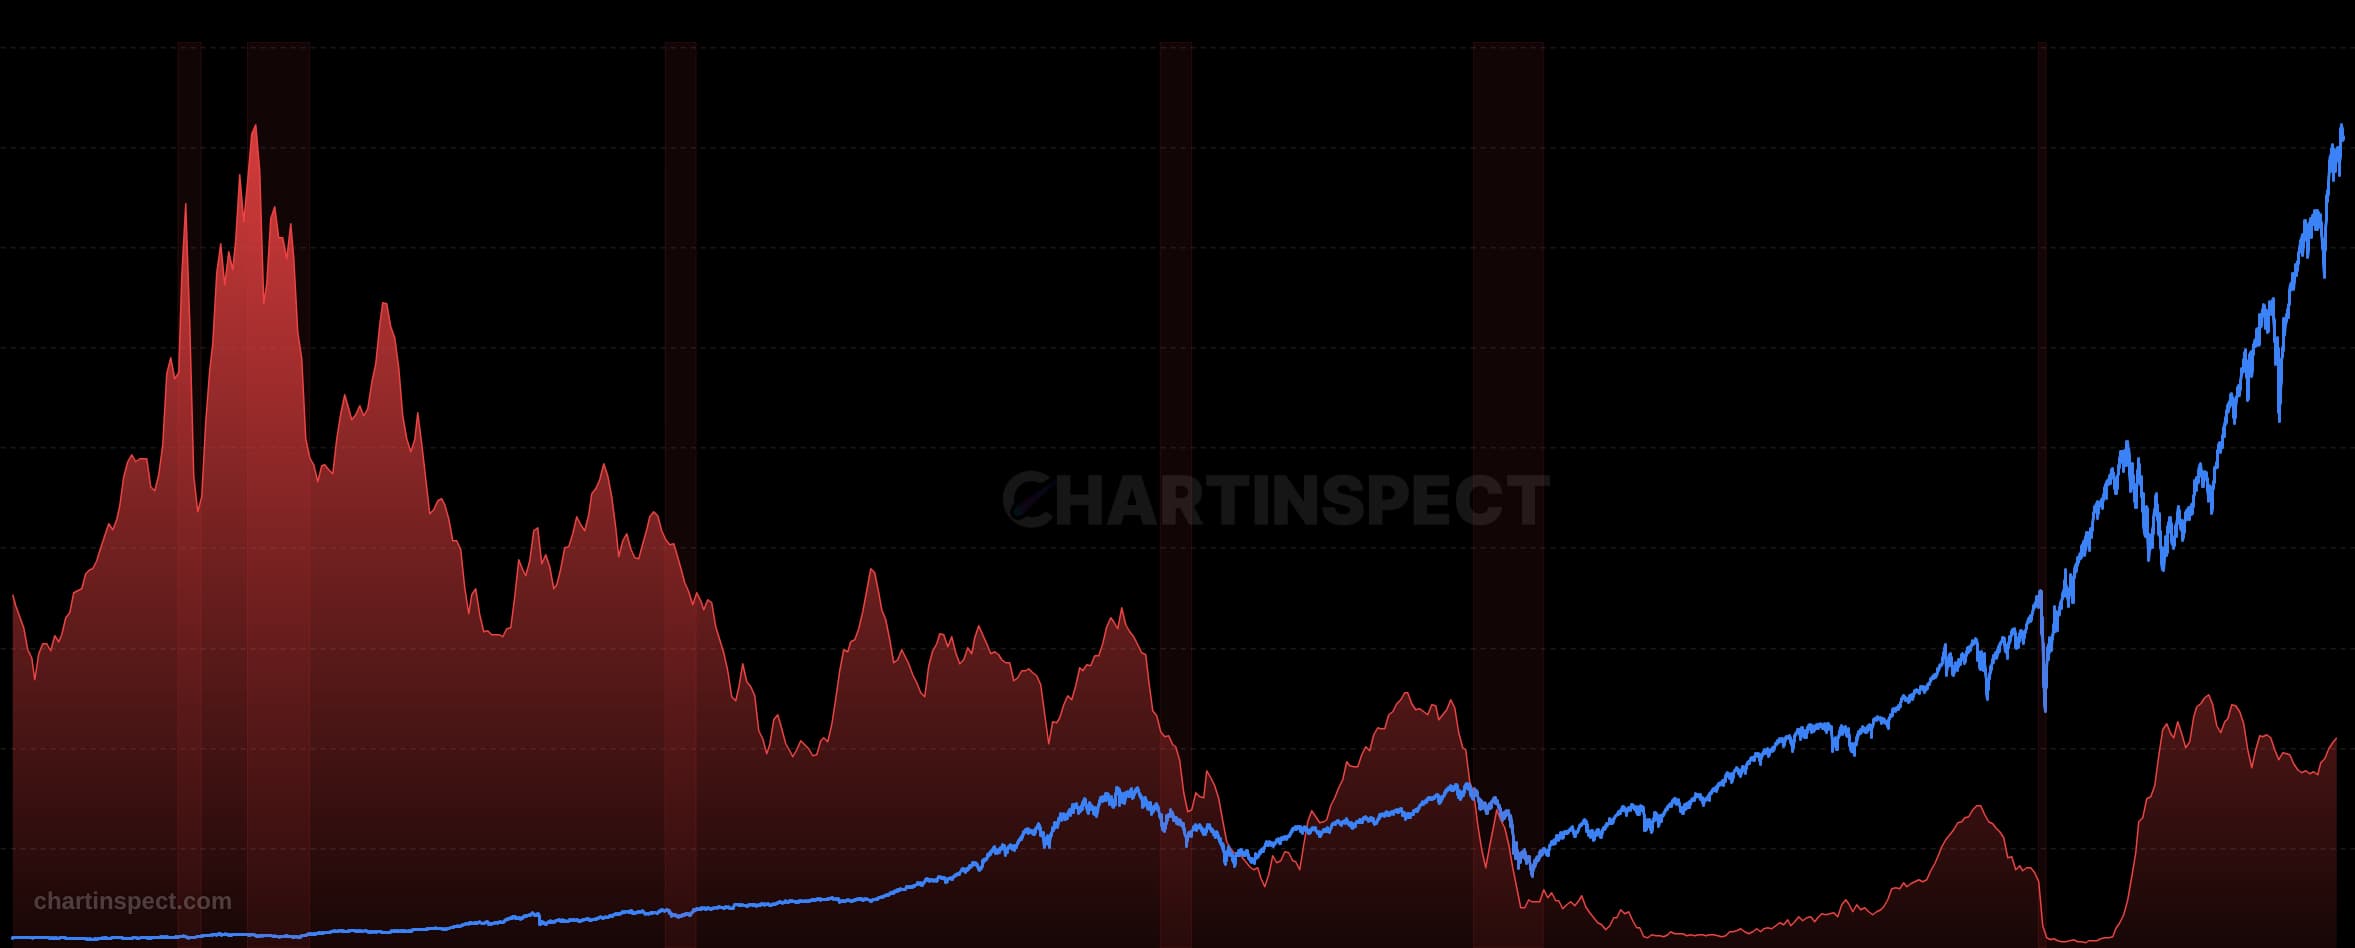
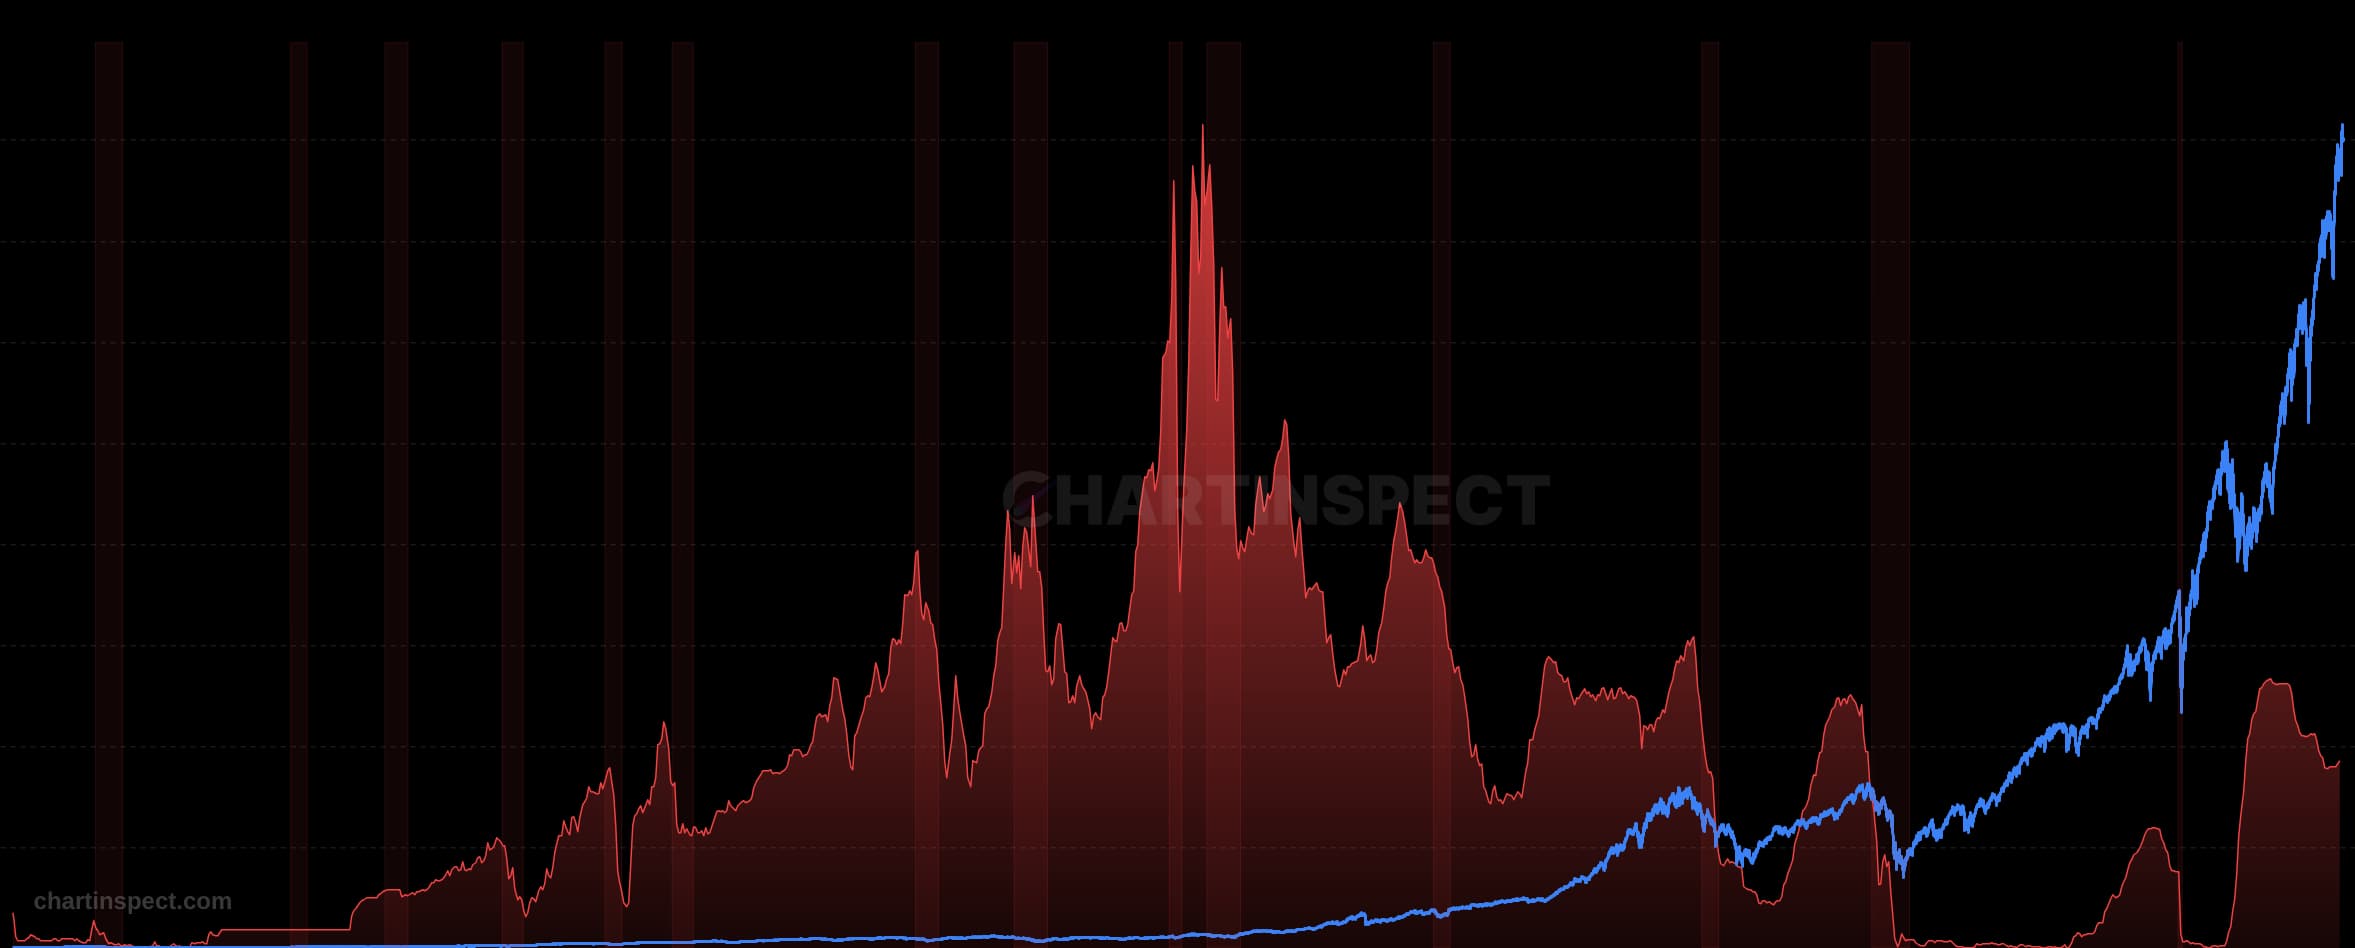
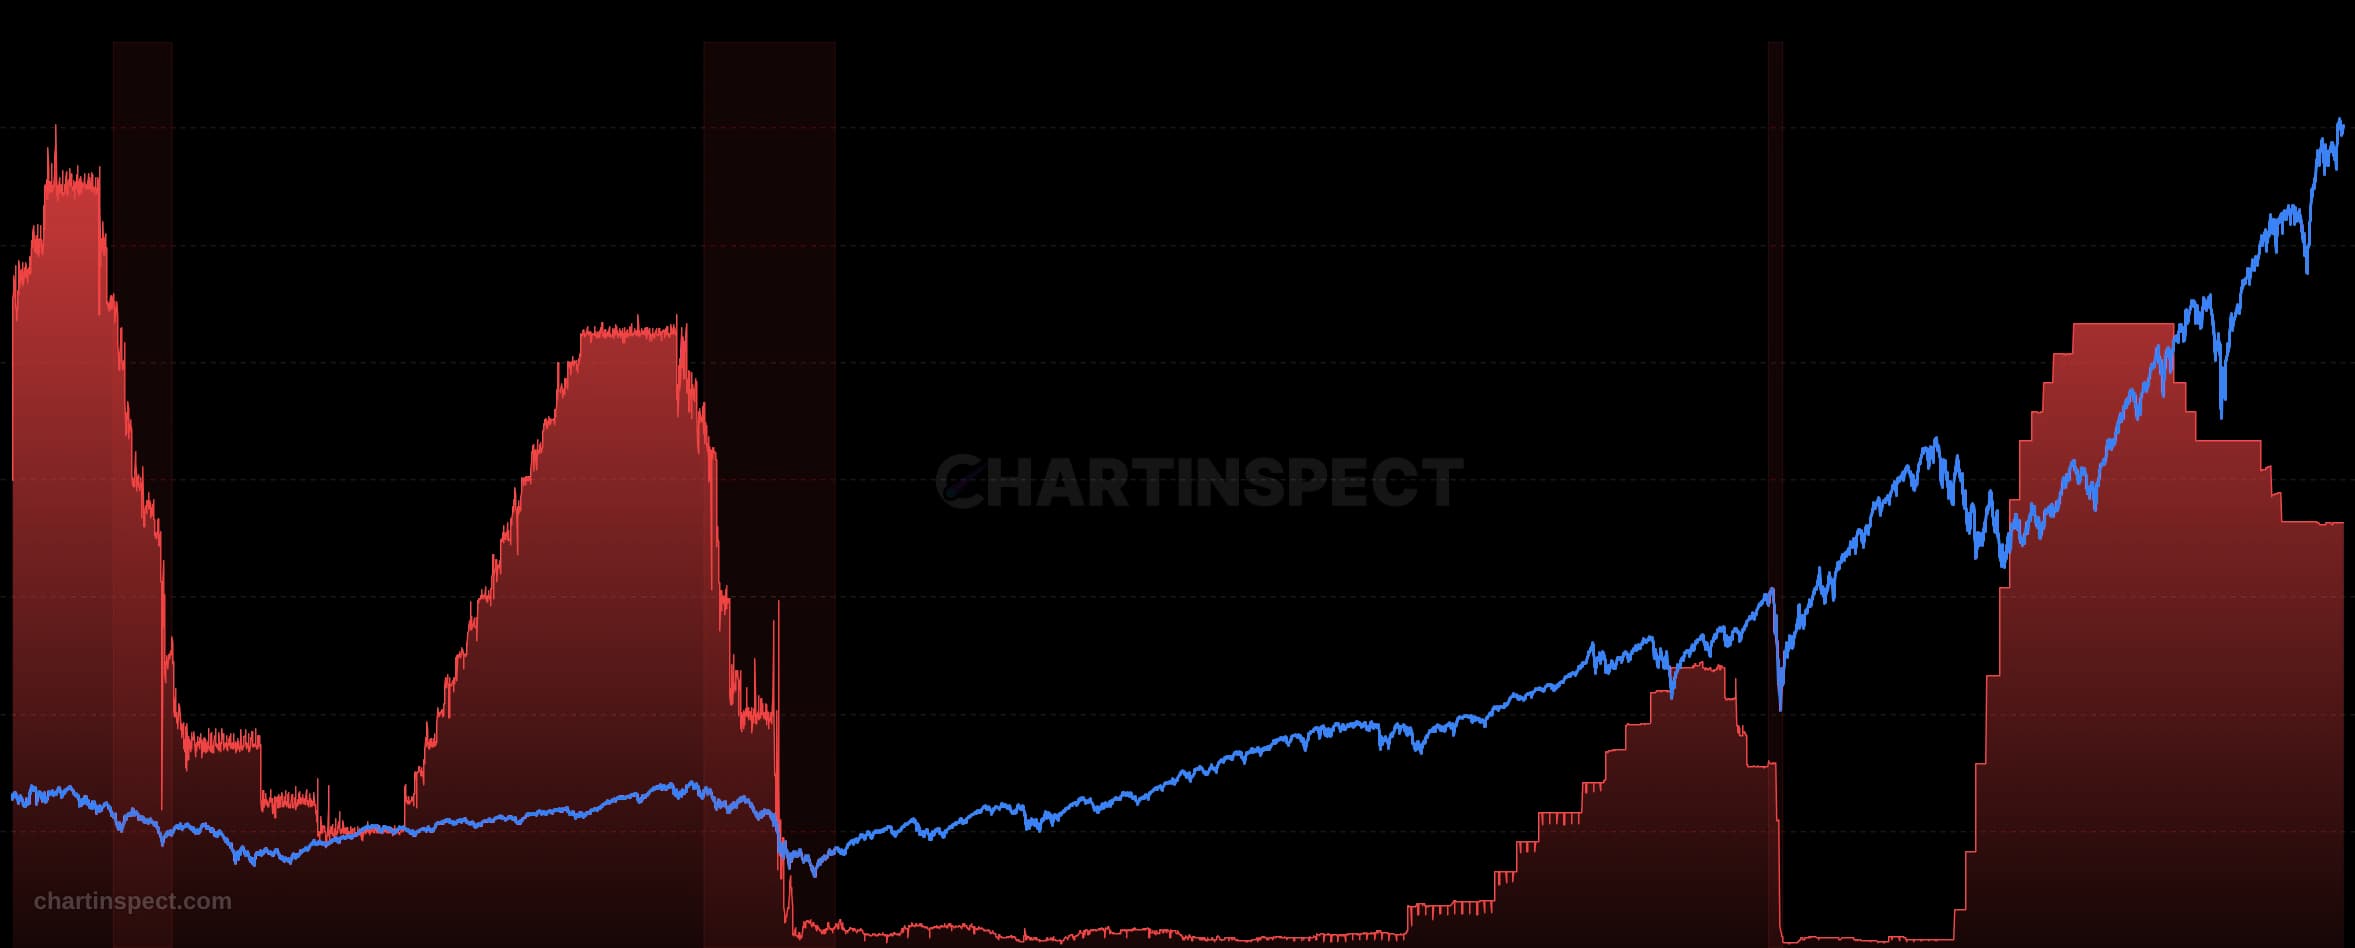
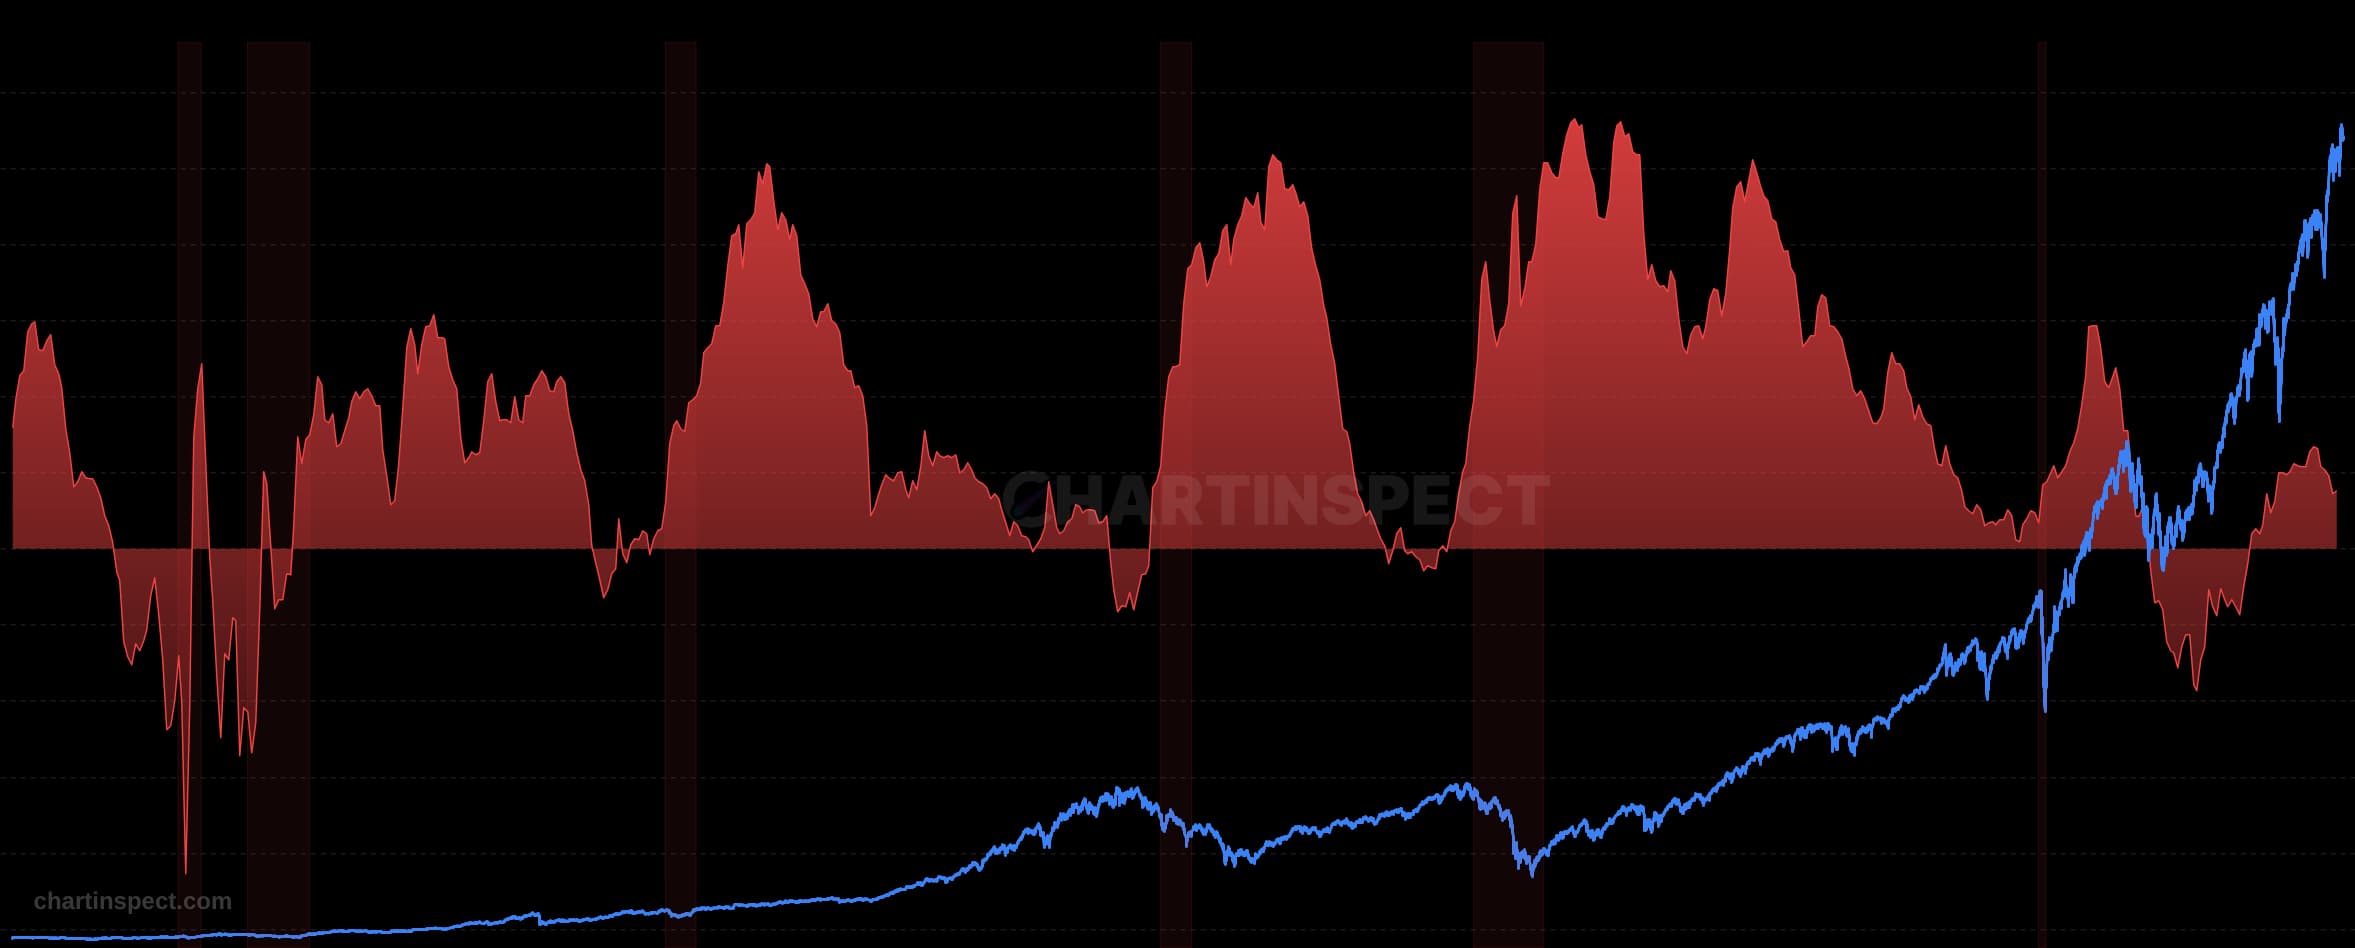
Discover more insights with our comprehensive chart collection
Explore All 9143 Charts