
Smoothing
About Market Dominance Composition
Comprehensive stacked area chart showing crypto market composition over time with BTC, ETH, Stablecoins, and Others dominance percentages. Visualize market structure evolution and identify major market cycle shifts between Bitcoin seasons and altcoin seasons.
Related Analytics
View all charts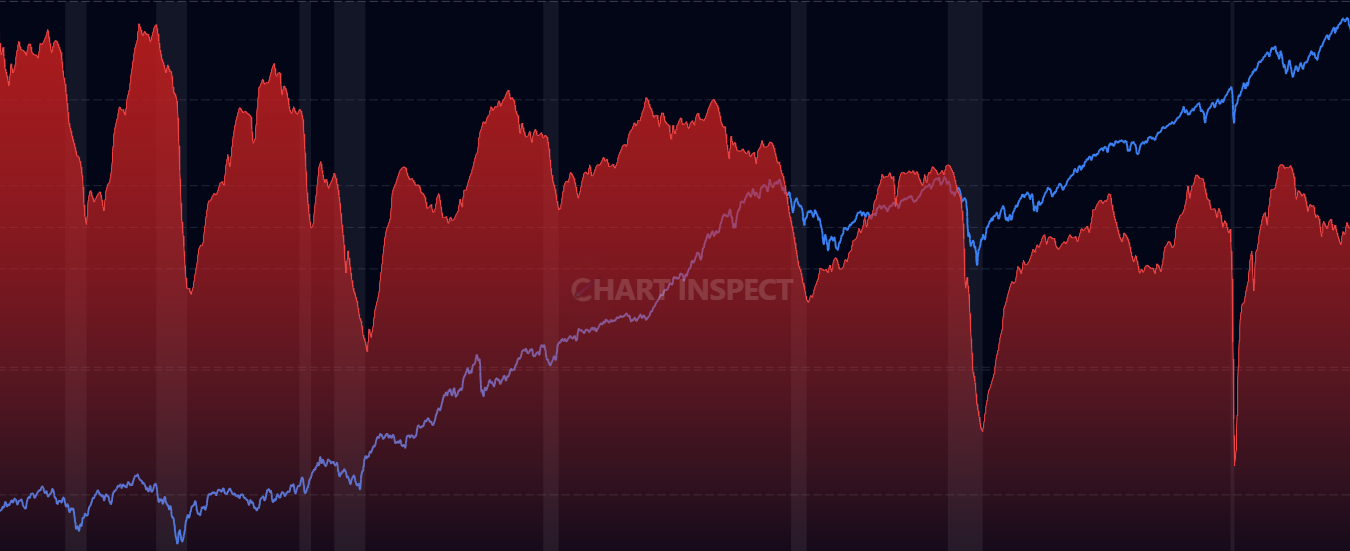
Discover more insights with our comprehensive chart collection
Explore All 224 Charts