Loading chart data
Loading chart data
About Capacity Utilization
Capacity utilization is actual industrial output divided by the maximum sustainable output of factories, mines and utilities, expressed as a percent. The post-1972 average is around 80%. Readings well above it mean plants are running hot, which historically precedes inflationary pressure and capital spending; readings in the low 70s indicate slack and idle capacity, a hallmark of recession. It is published monthly by the Federal Reserve alongside Industrial Production.
Freshness: Not yet verified
Community snapshot
No community calls on Capacity Utilization yet. Be the first to share a take.
Related Analytics
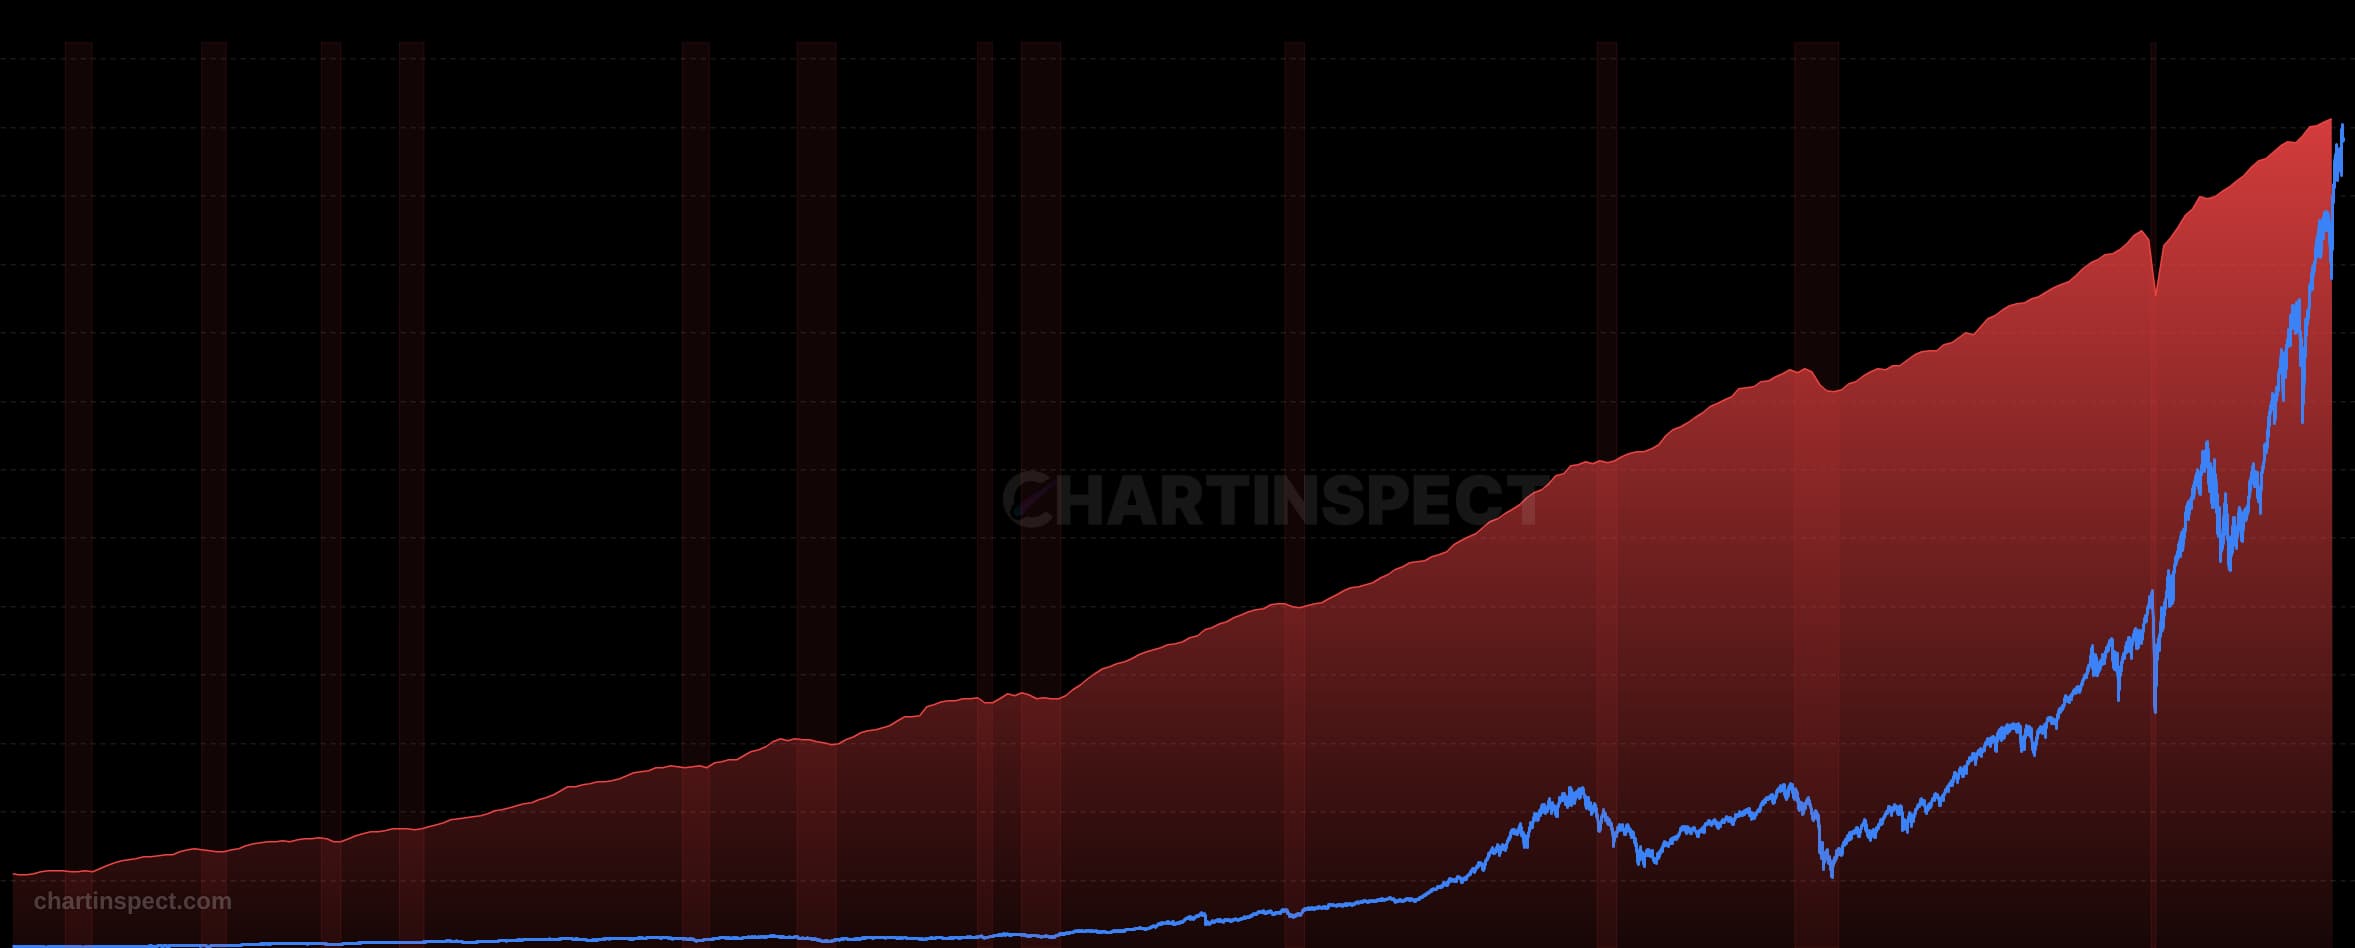
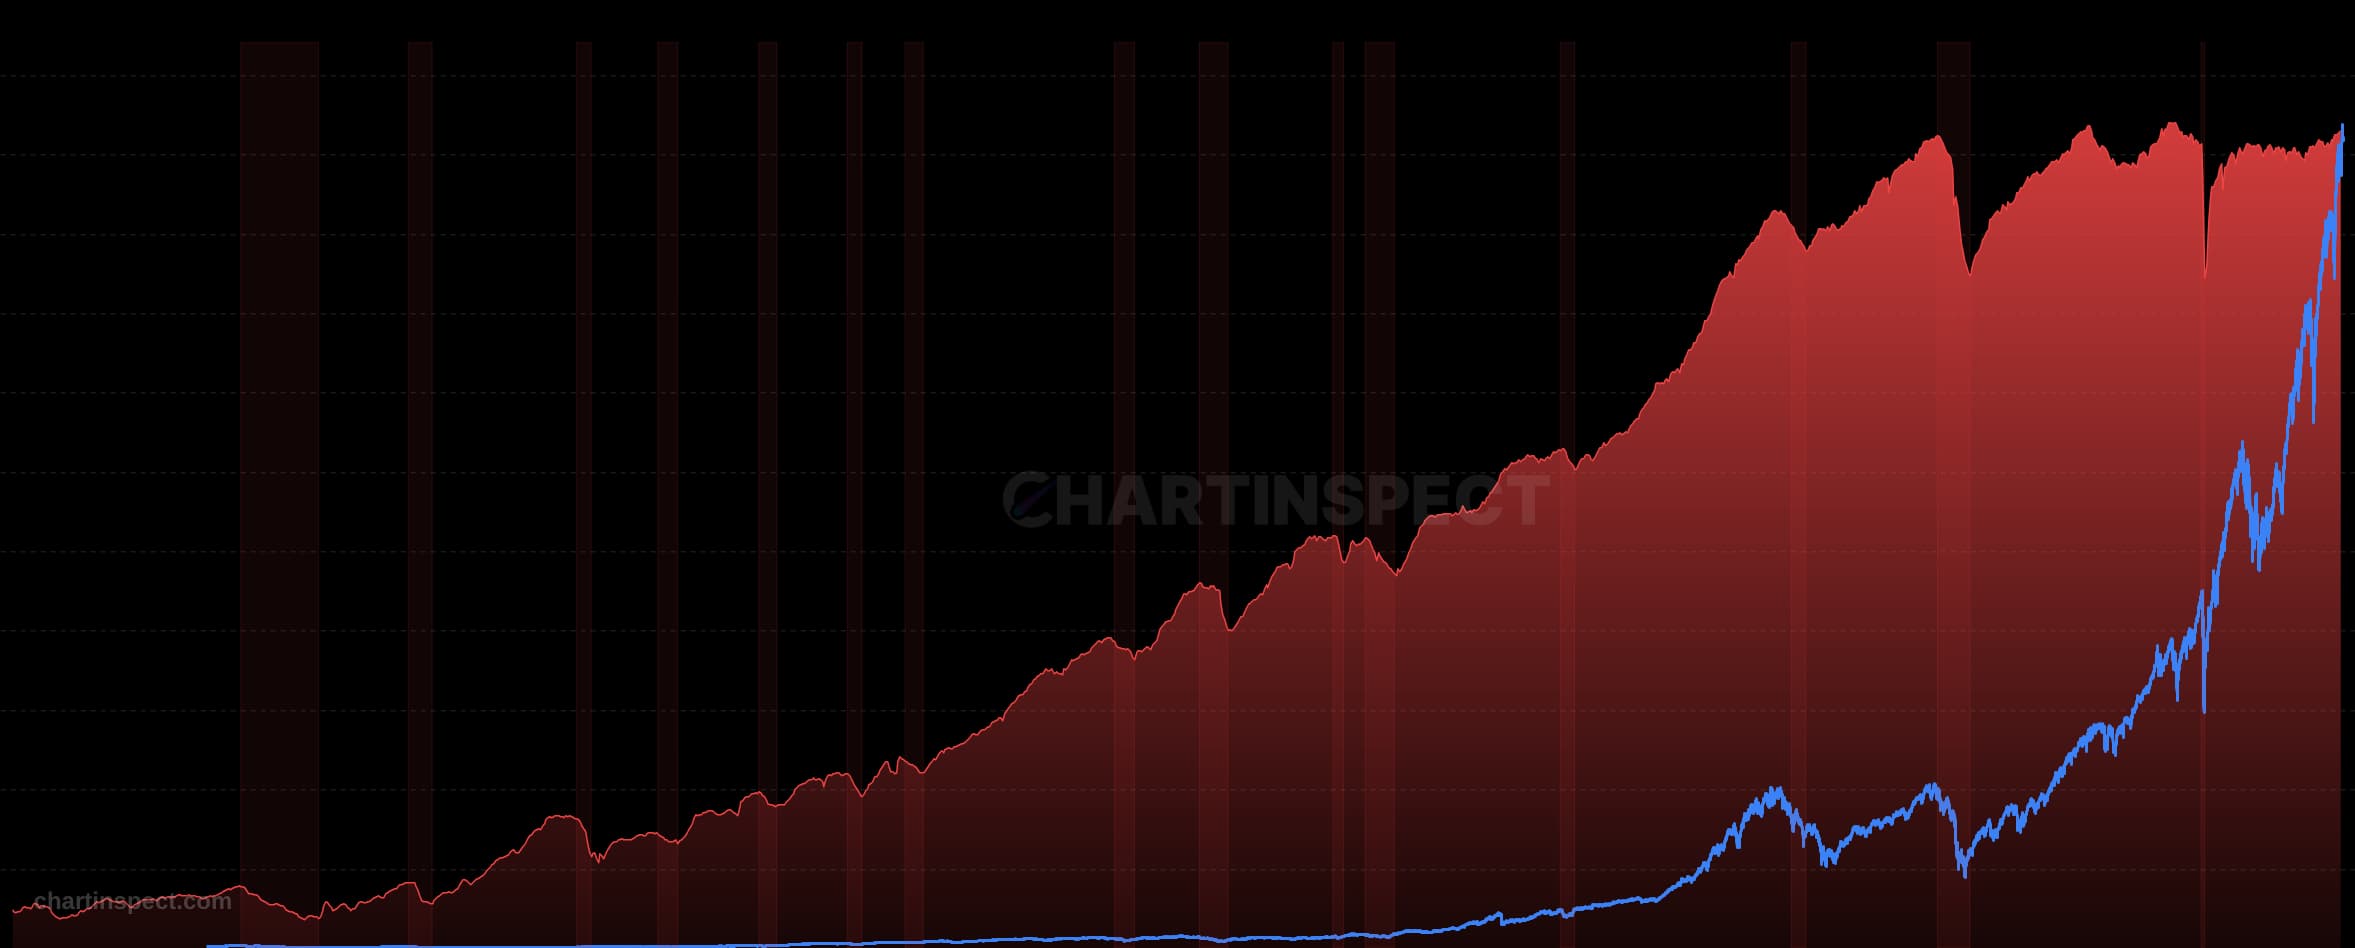
Discover more insights with our comprehensive chart collection
Explore All 8012 Charts