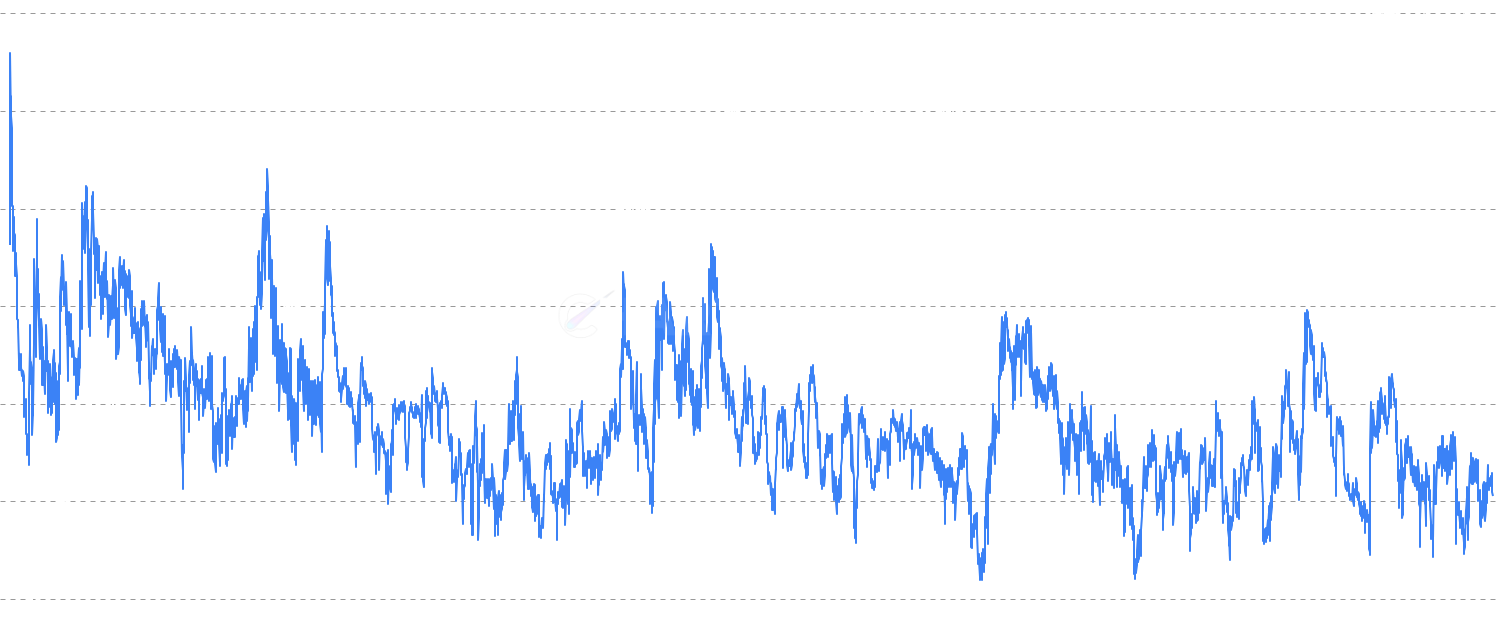
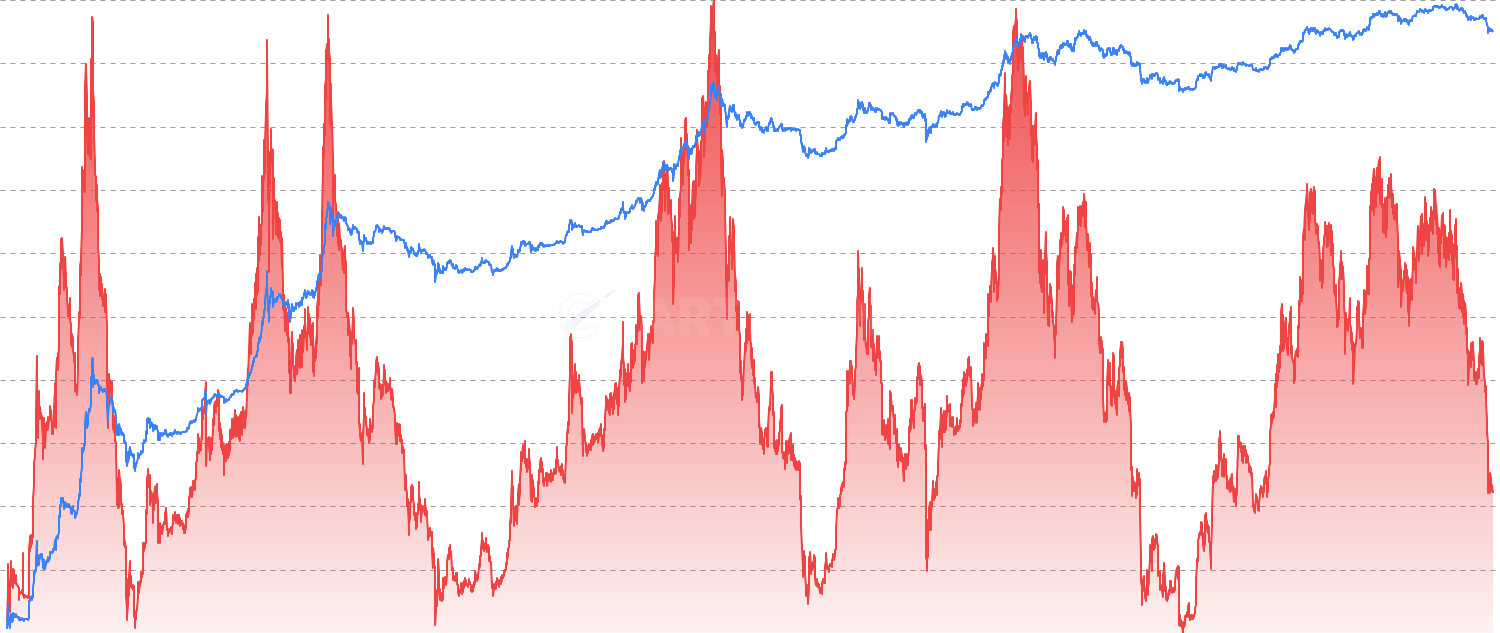
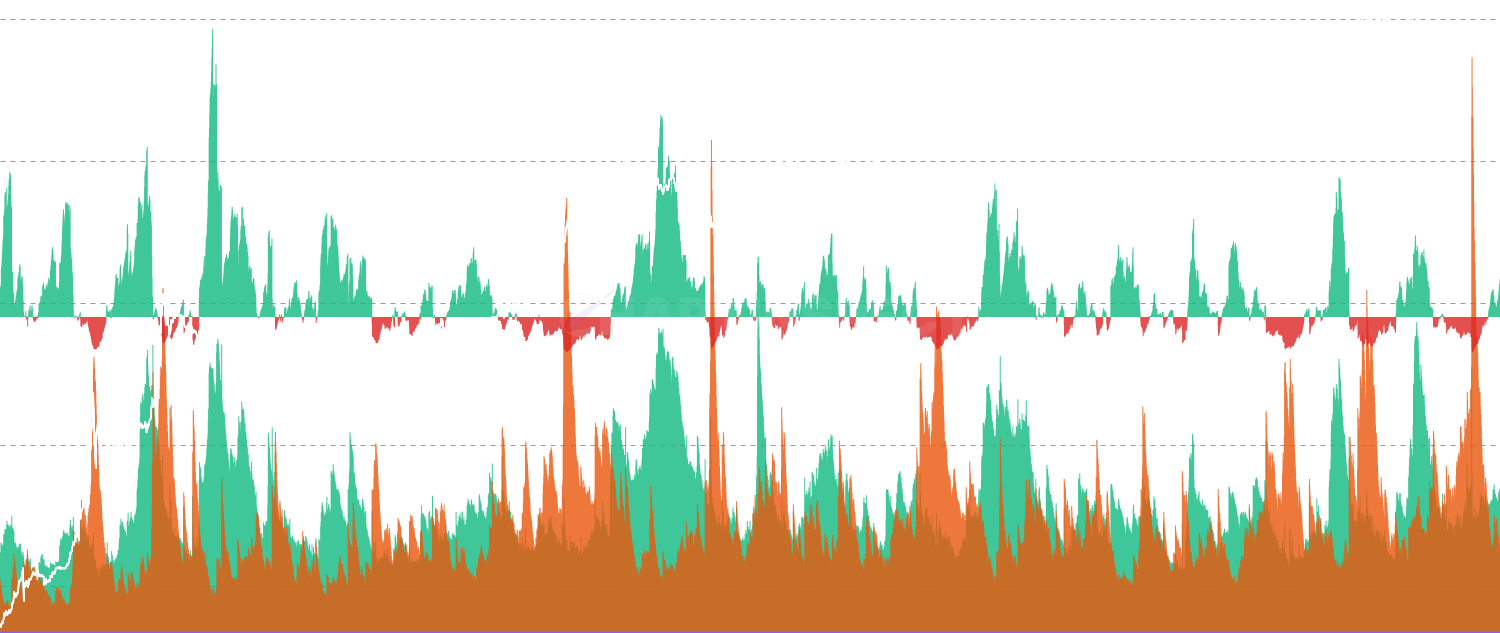
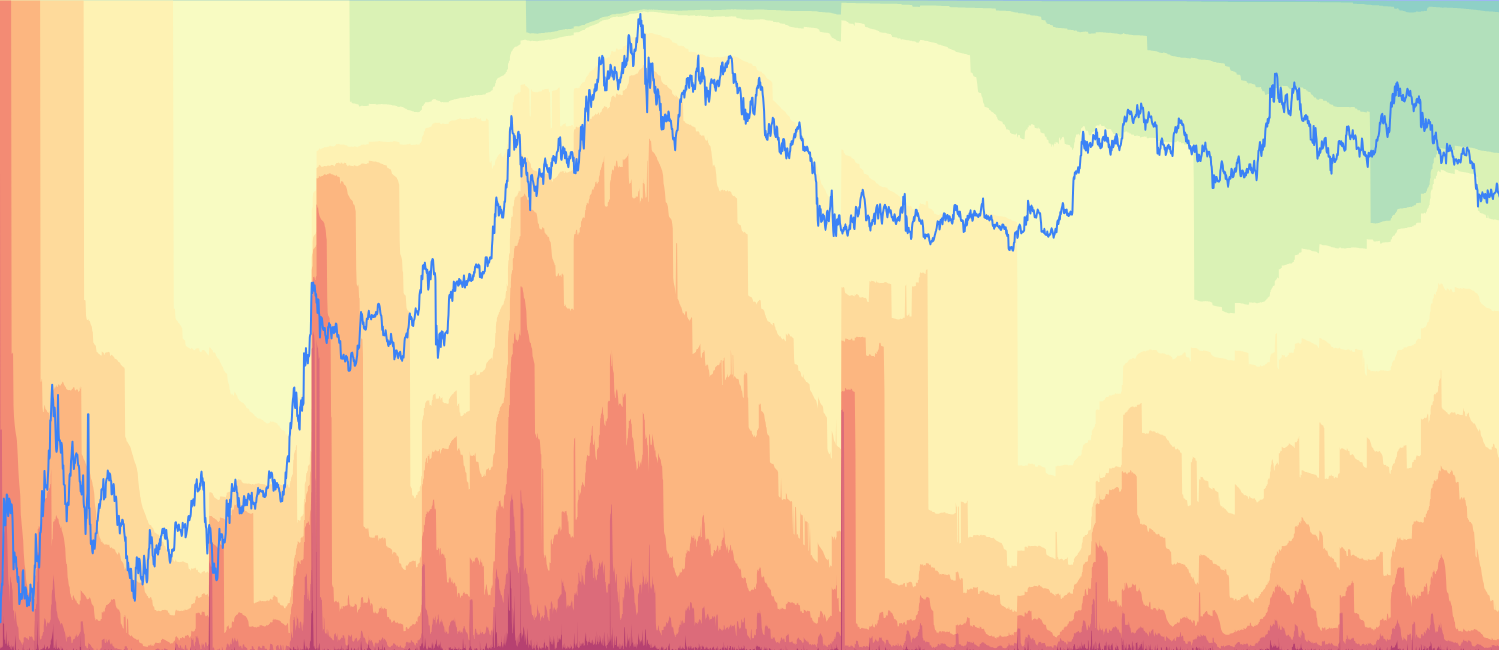
Active Supply Skew - Bitcoin On-Chain Data Analysis
Measures the divergence between broad market valuation (MVRV) and active-participant valuation (AVIV), normalized within a multi-cycle rolling window. Positive values indicate market-wide overvaluation relative to active participants, while negative values suggest active holders are more overvalued than the broader market.
About Active Supply Skew Indicator
This on-chain metrics chart provides professional-grade analysis for Bitcoin and cryptocurrency markets. The active supply skew indicator is part of ChartInspect's comprehensive suite of blockchain analytics tools, designed to help traders and investors make informed decisions based on on-chain blockchain data.
Key Features of Active Supply Skew
- Real-time on-chain metrics data visualization
- Historical Bitcoin and cryptocurrency market analysis
- Interactive charting with zoom and timeframe selection
- Premium-grade institutional analytics
- Mobile-responsive design for trading on the go
How to Use Active Supply Skew for Bitcoin Trading
Navigate through different timeframes to analyze Bitcoin market cycles. Use the interactive features to zoom into specific periods and identify key on-chain signalsthat can inform your cryptocurrency investment strategy.
Bitcoin On-Chain Data Analysis
Bitcoin on-chain data analysis provides unique insights into market dynamics that traditional technical analysis cannot offer. By examining blockchain data with the active supply skew, we can understand holder behavior, network usage, and market sentiment to identify potential trend changes and investment opportunities in the cryptocurrency market.