On-Chain Metrics
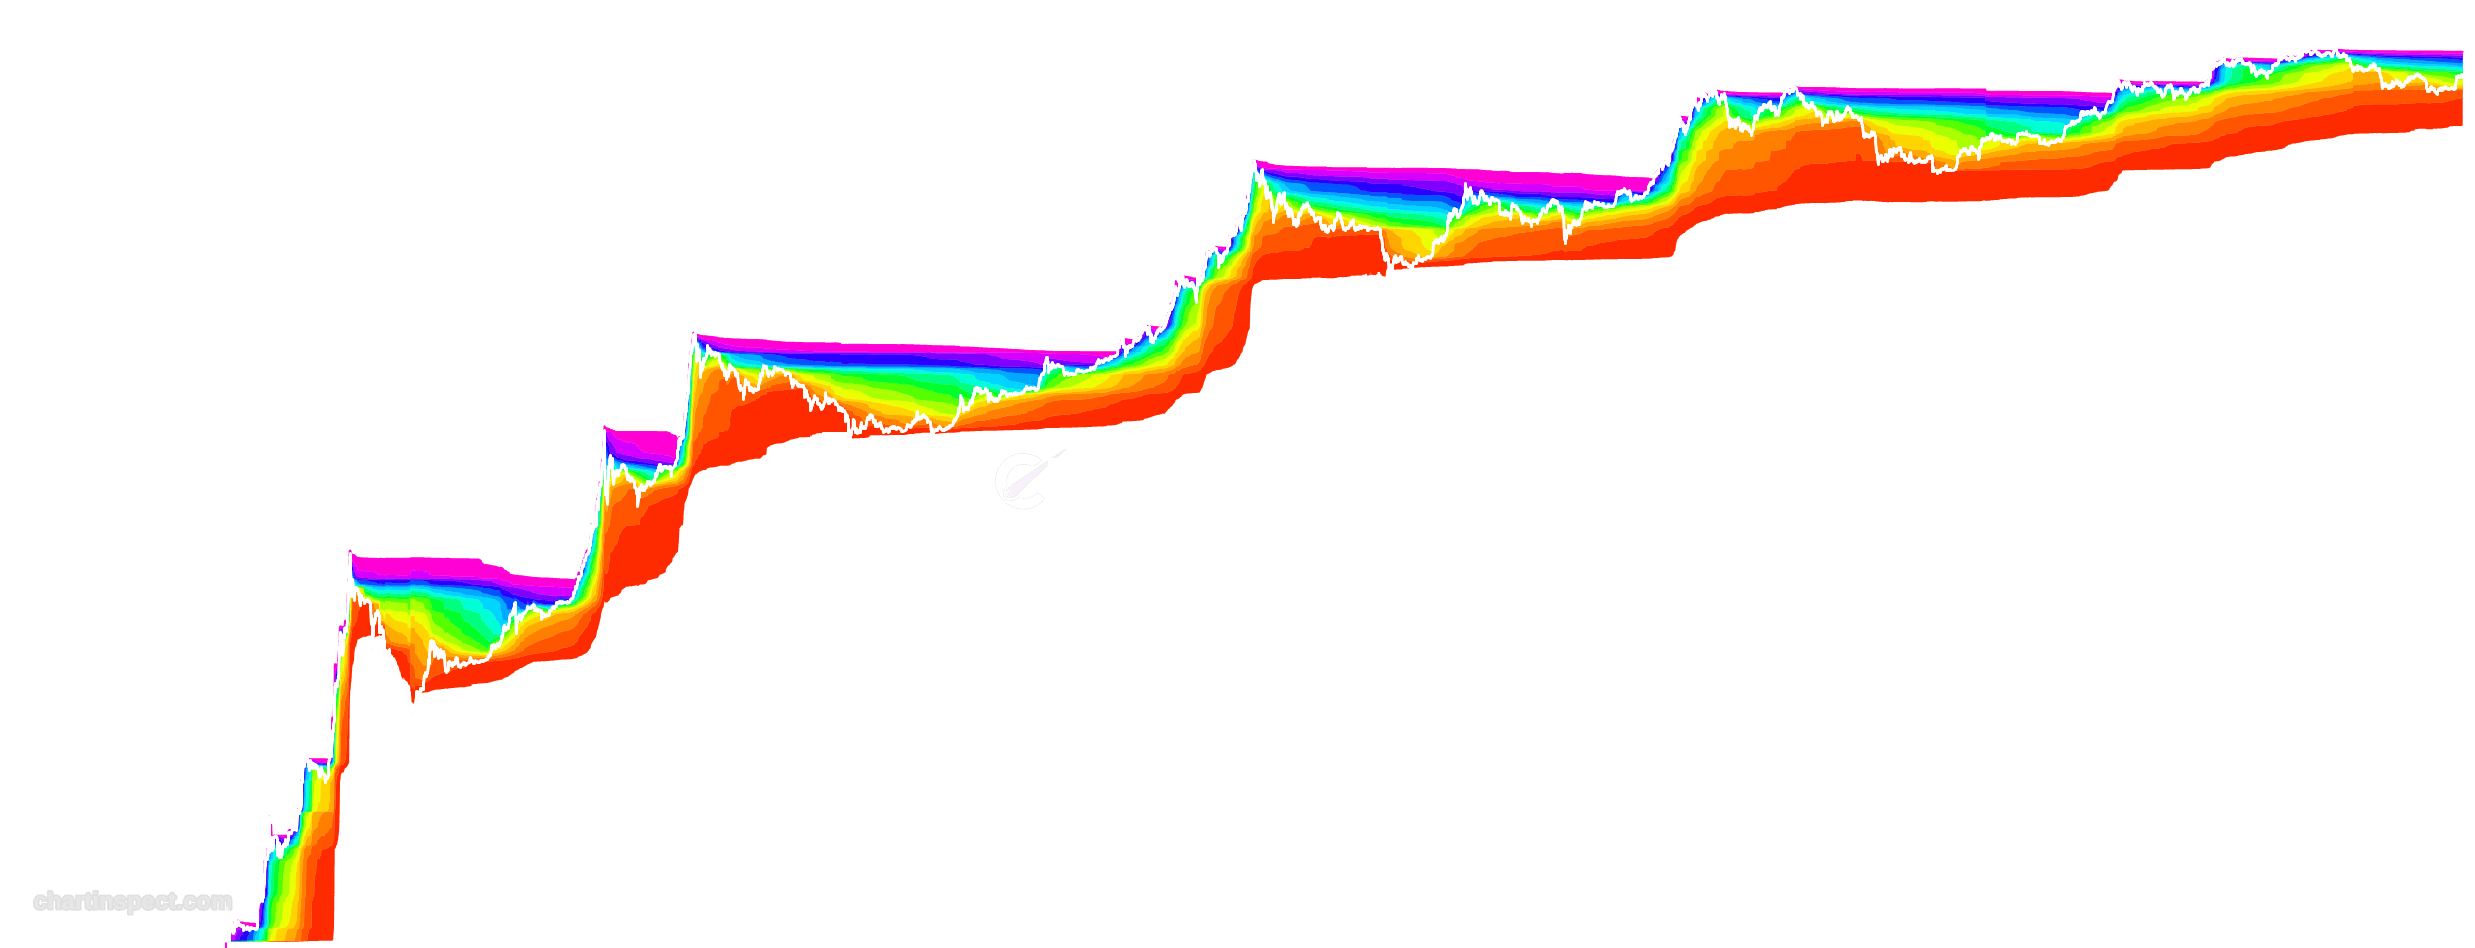
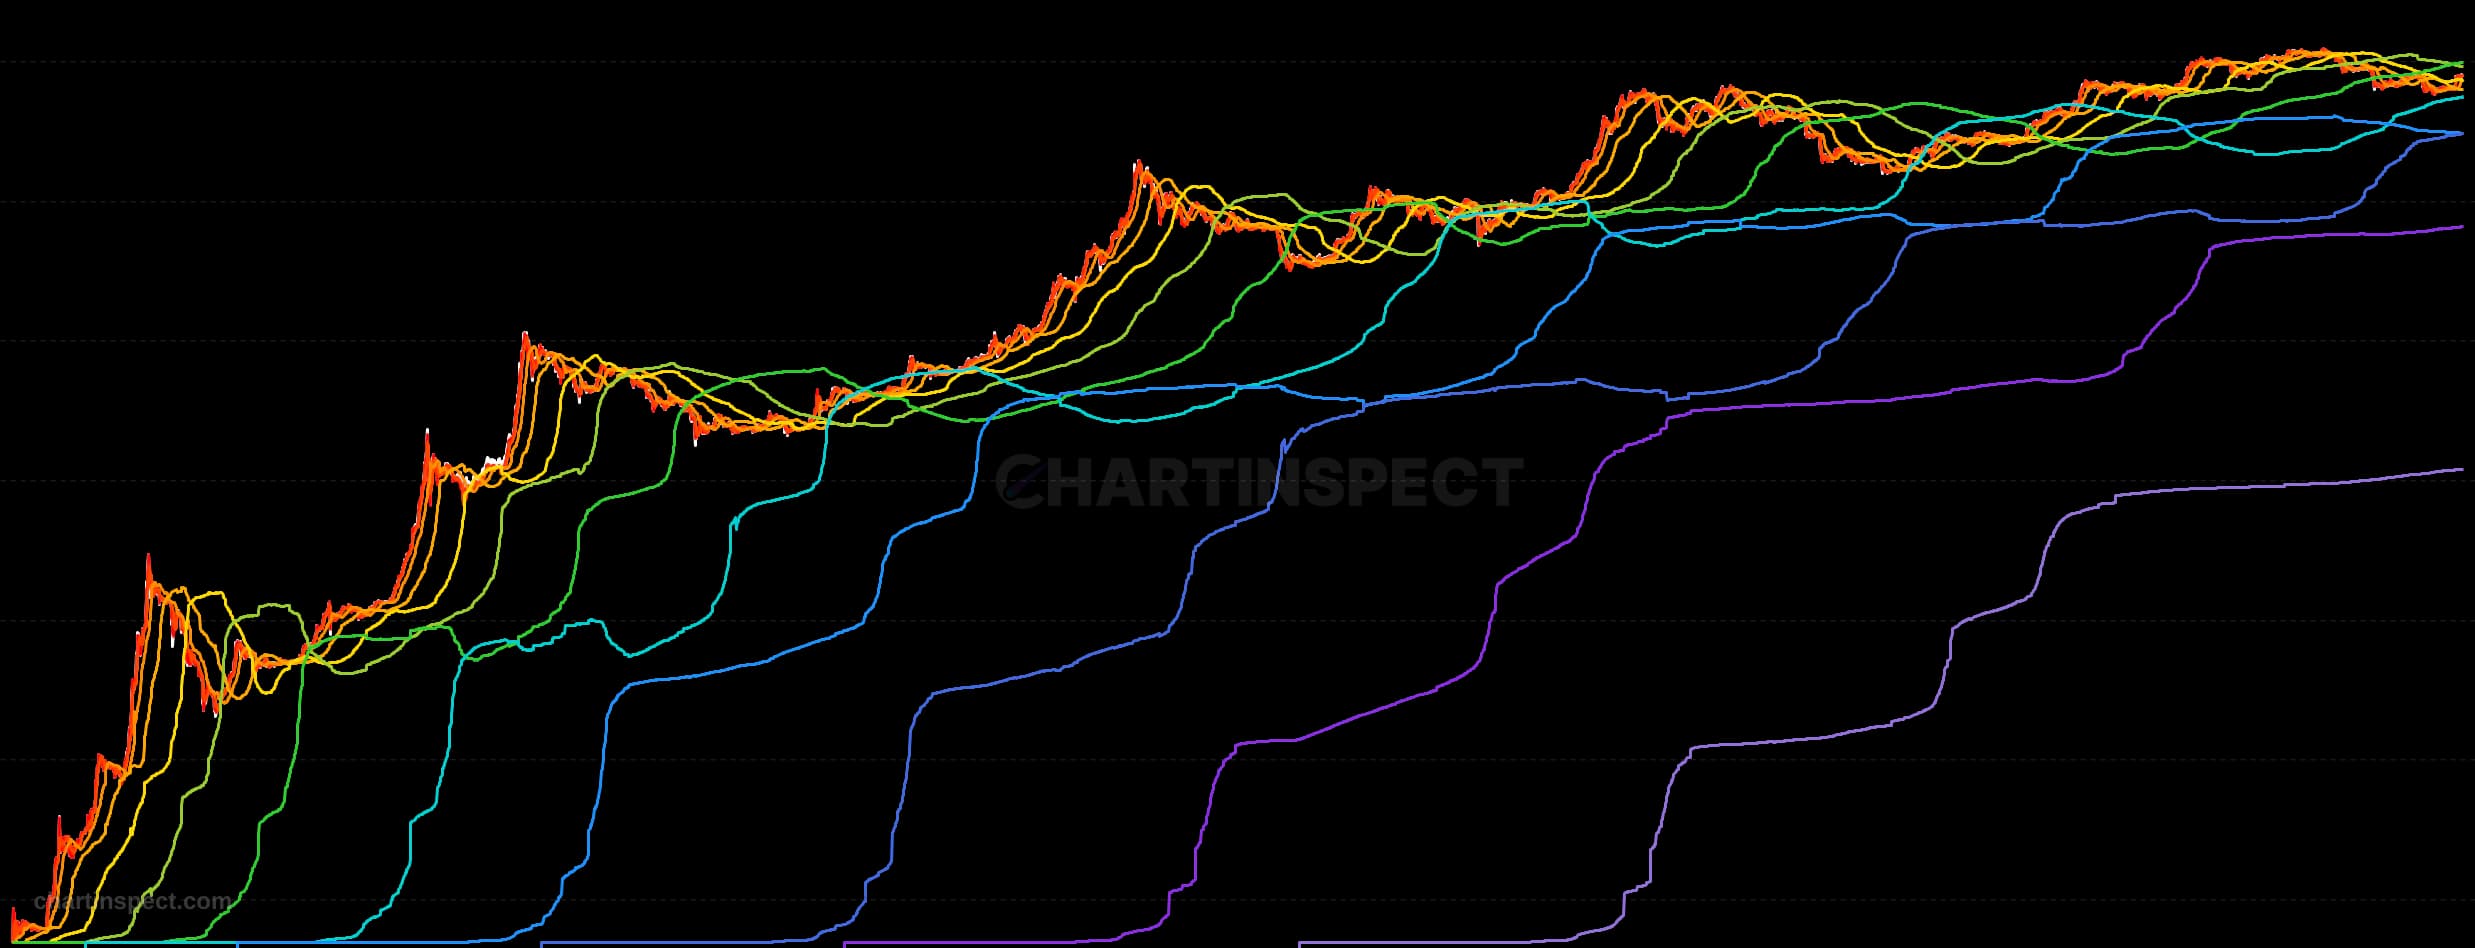
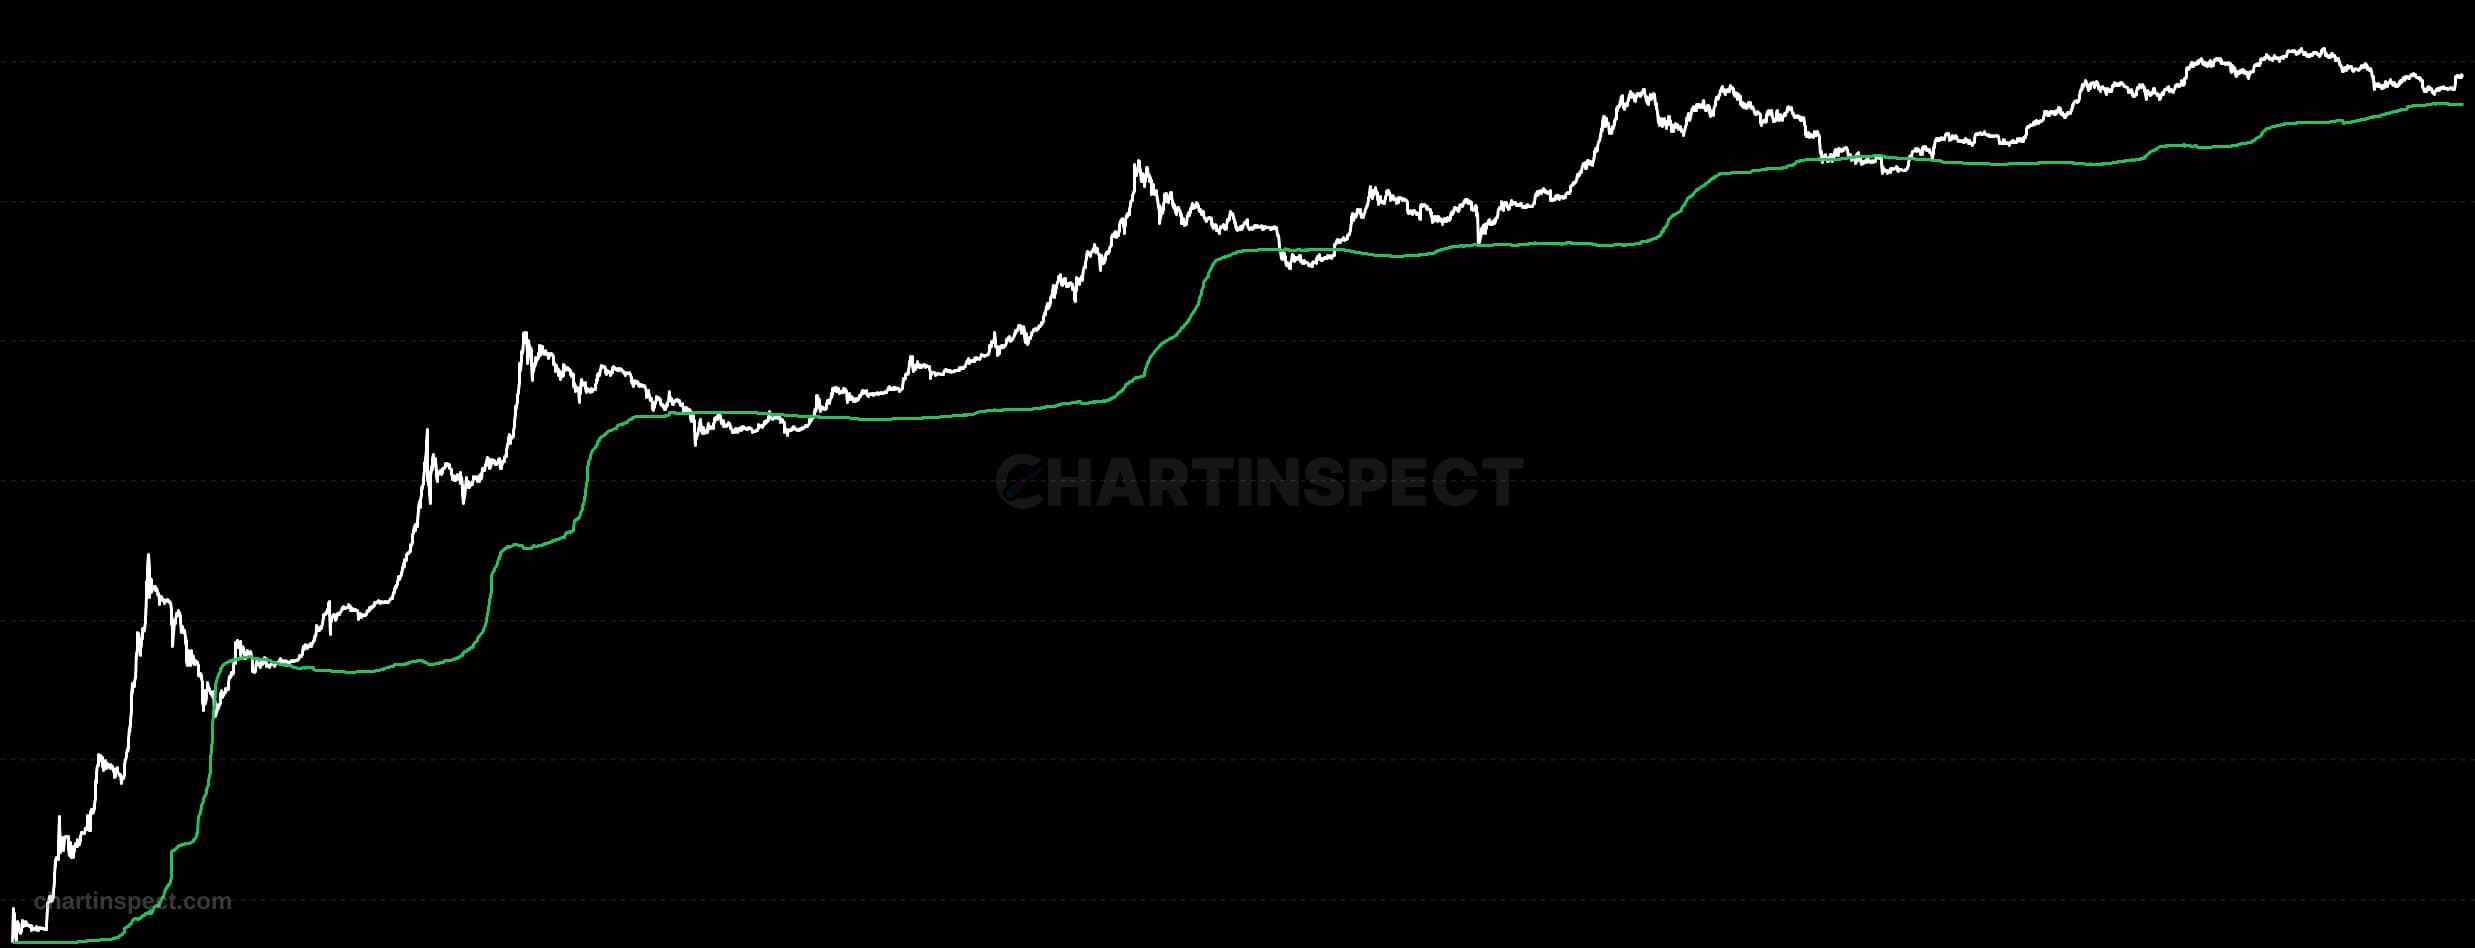
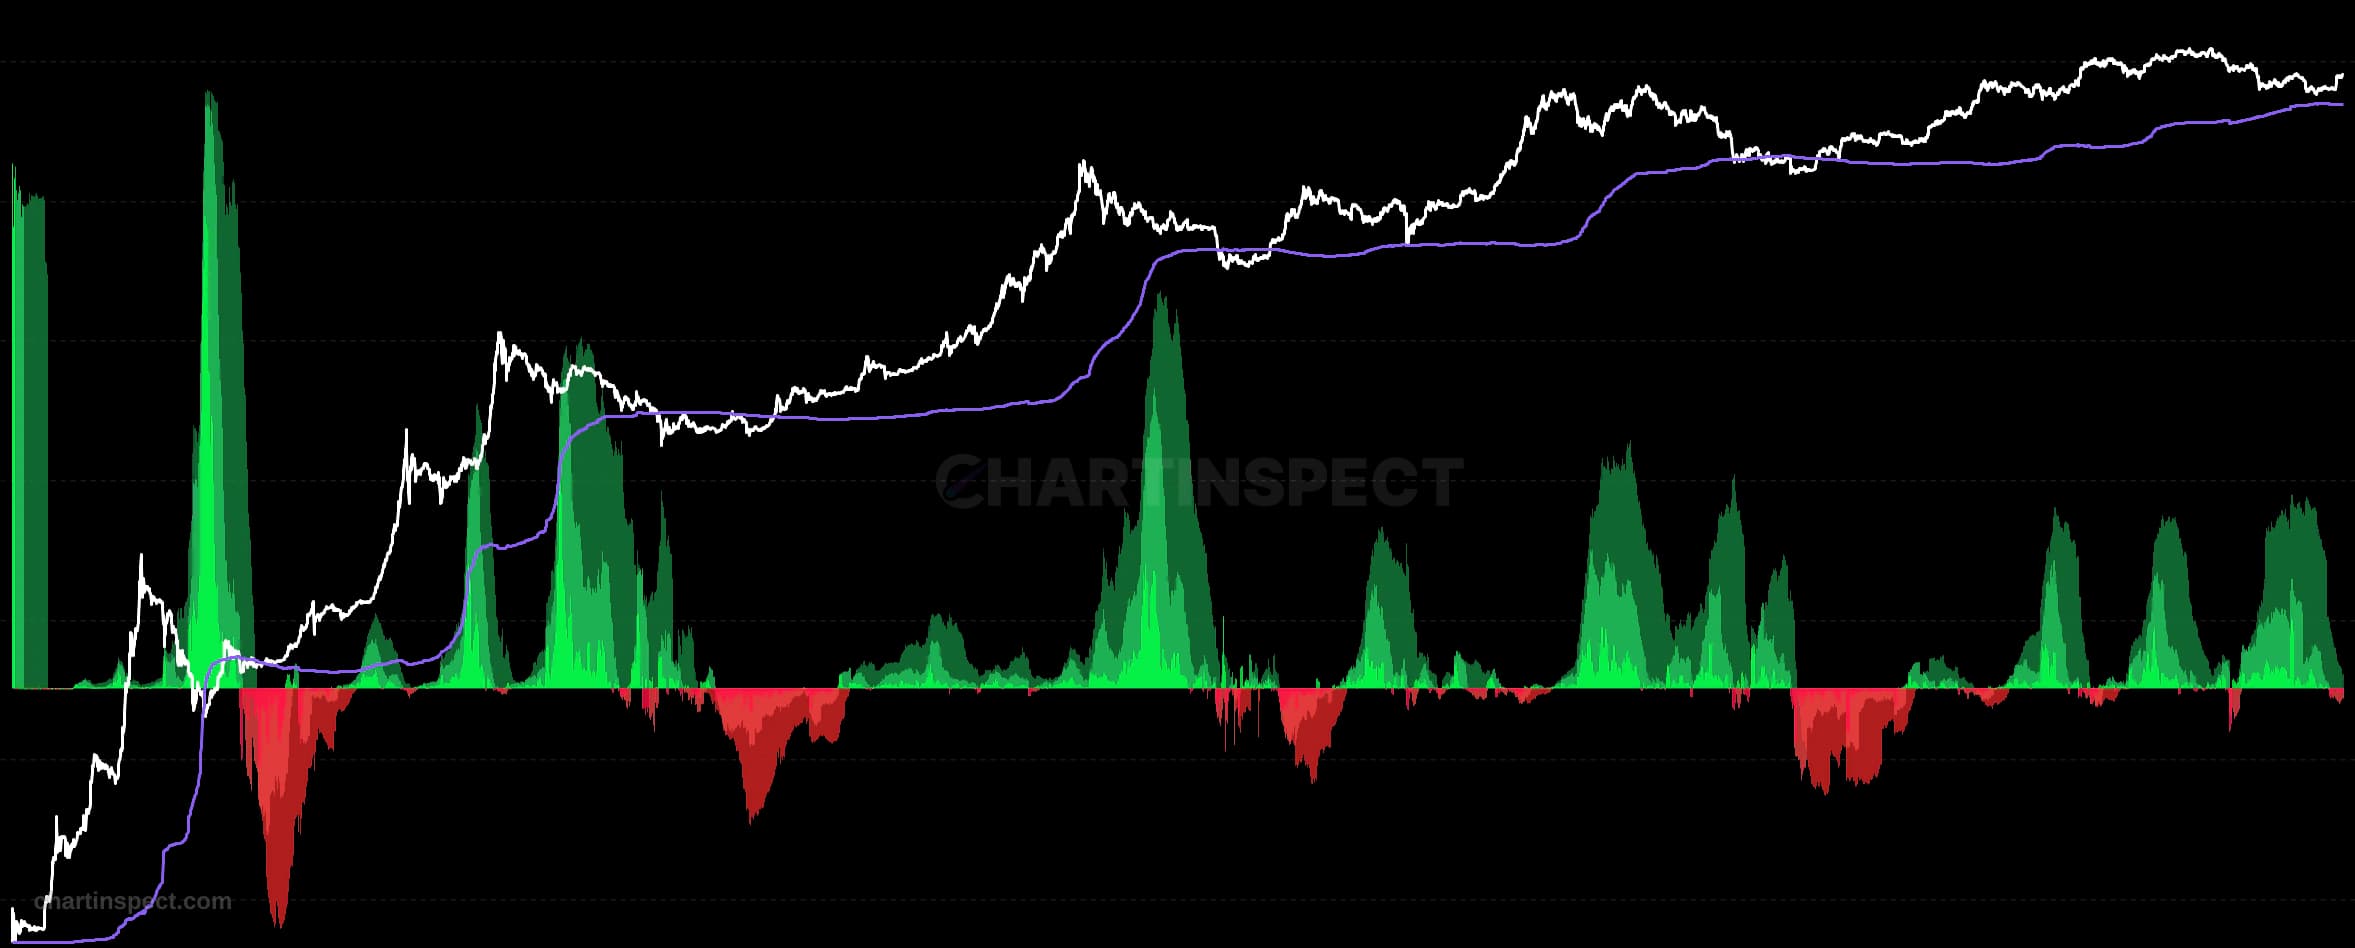
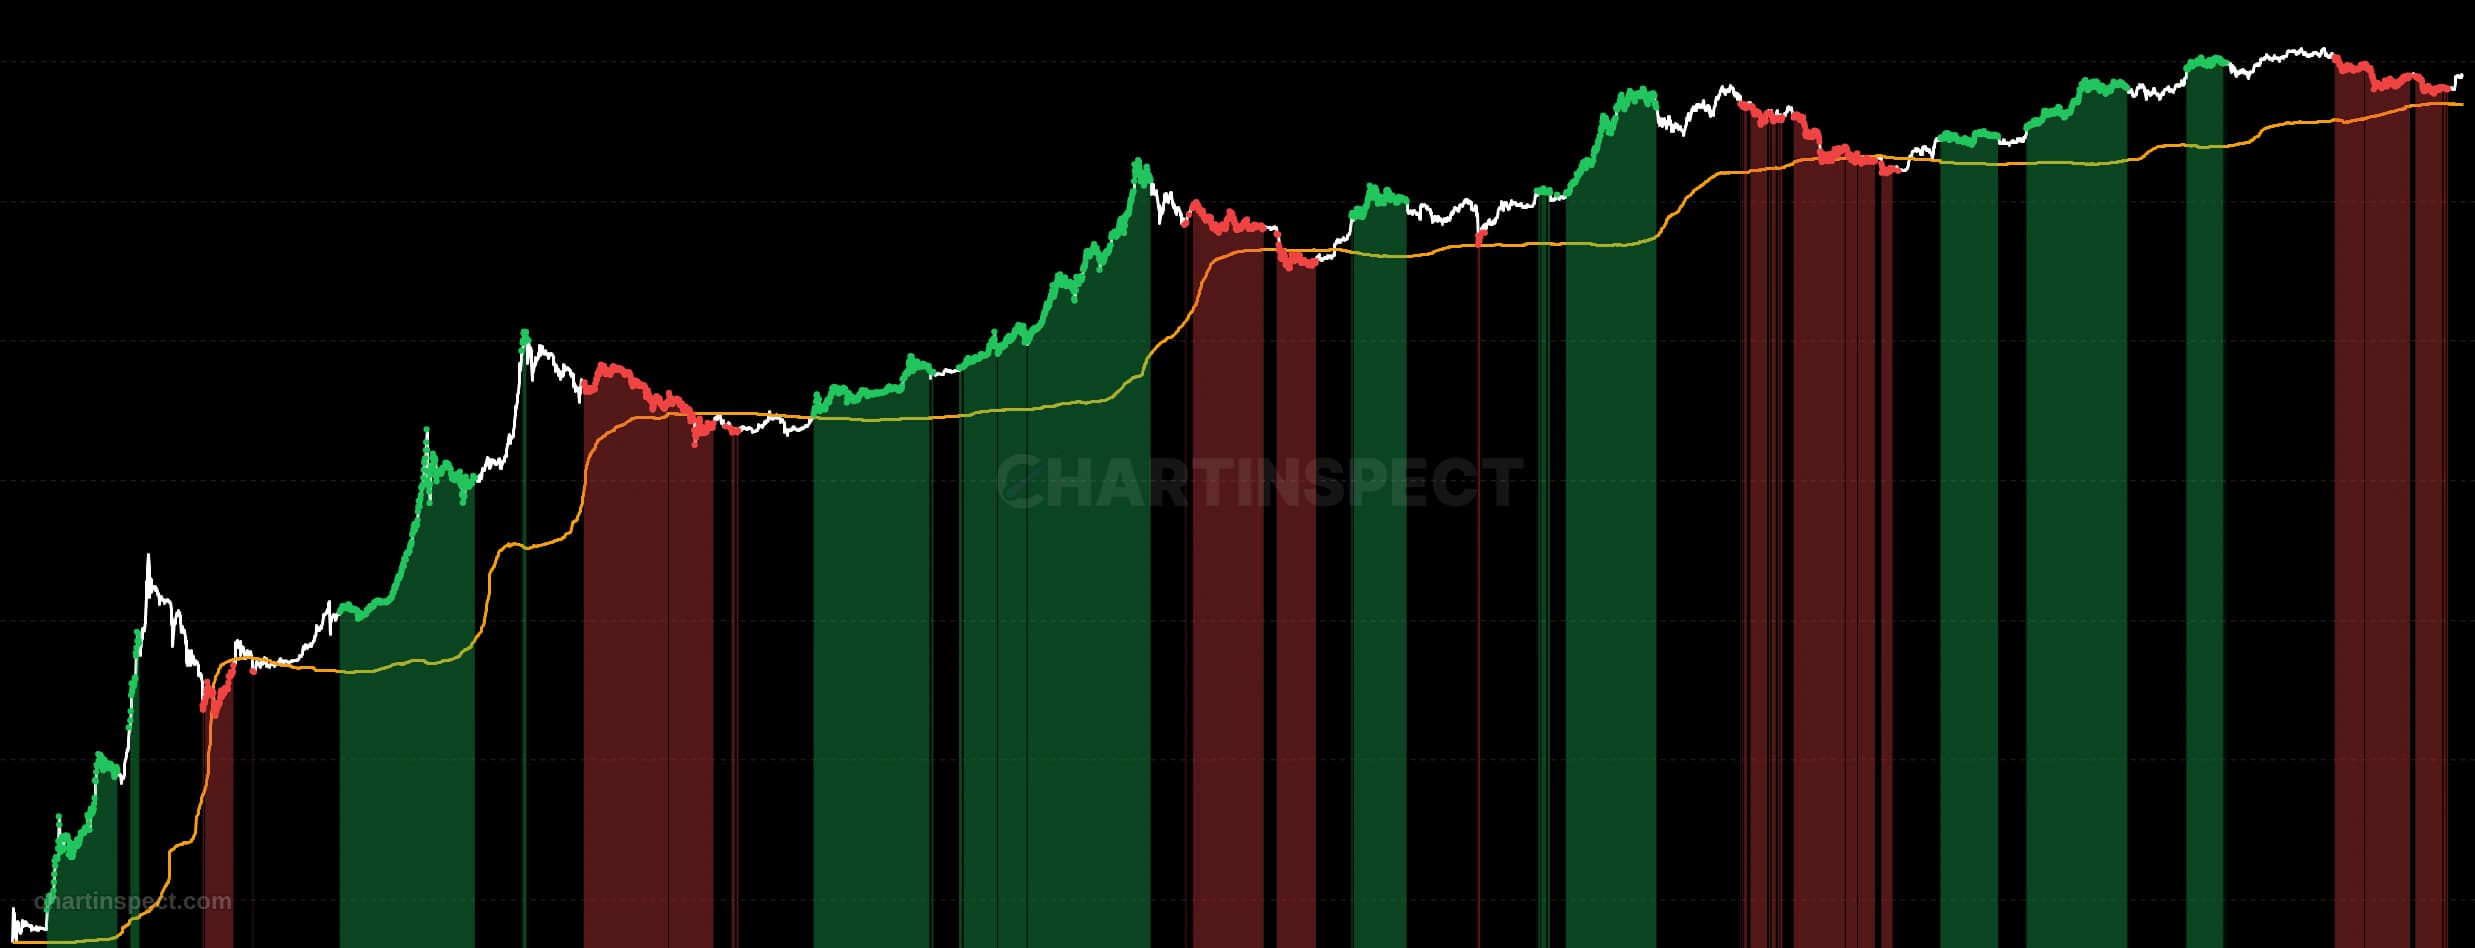
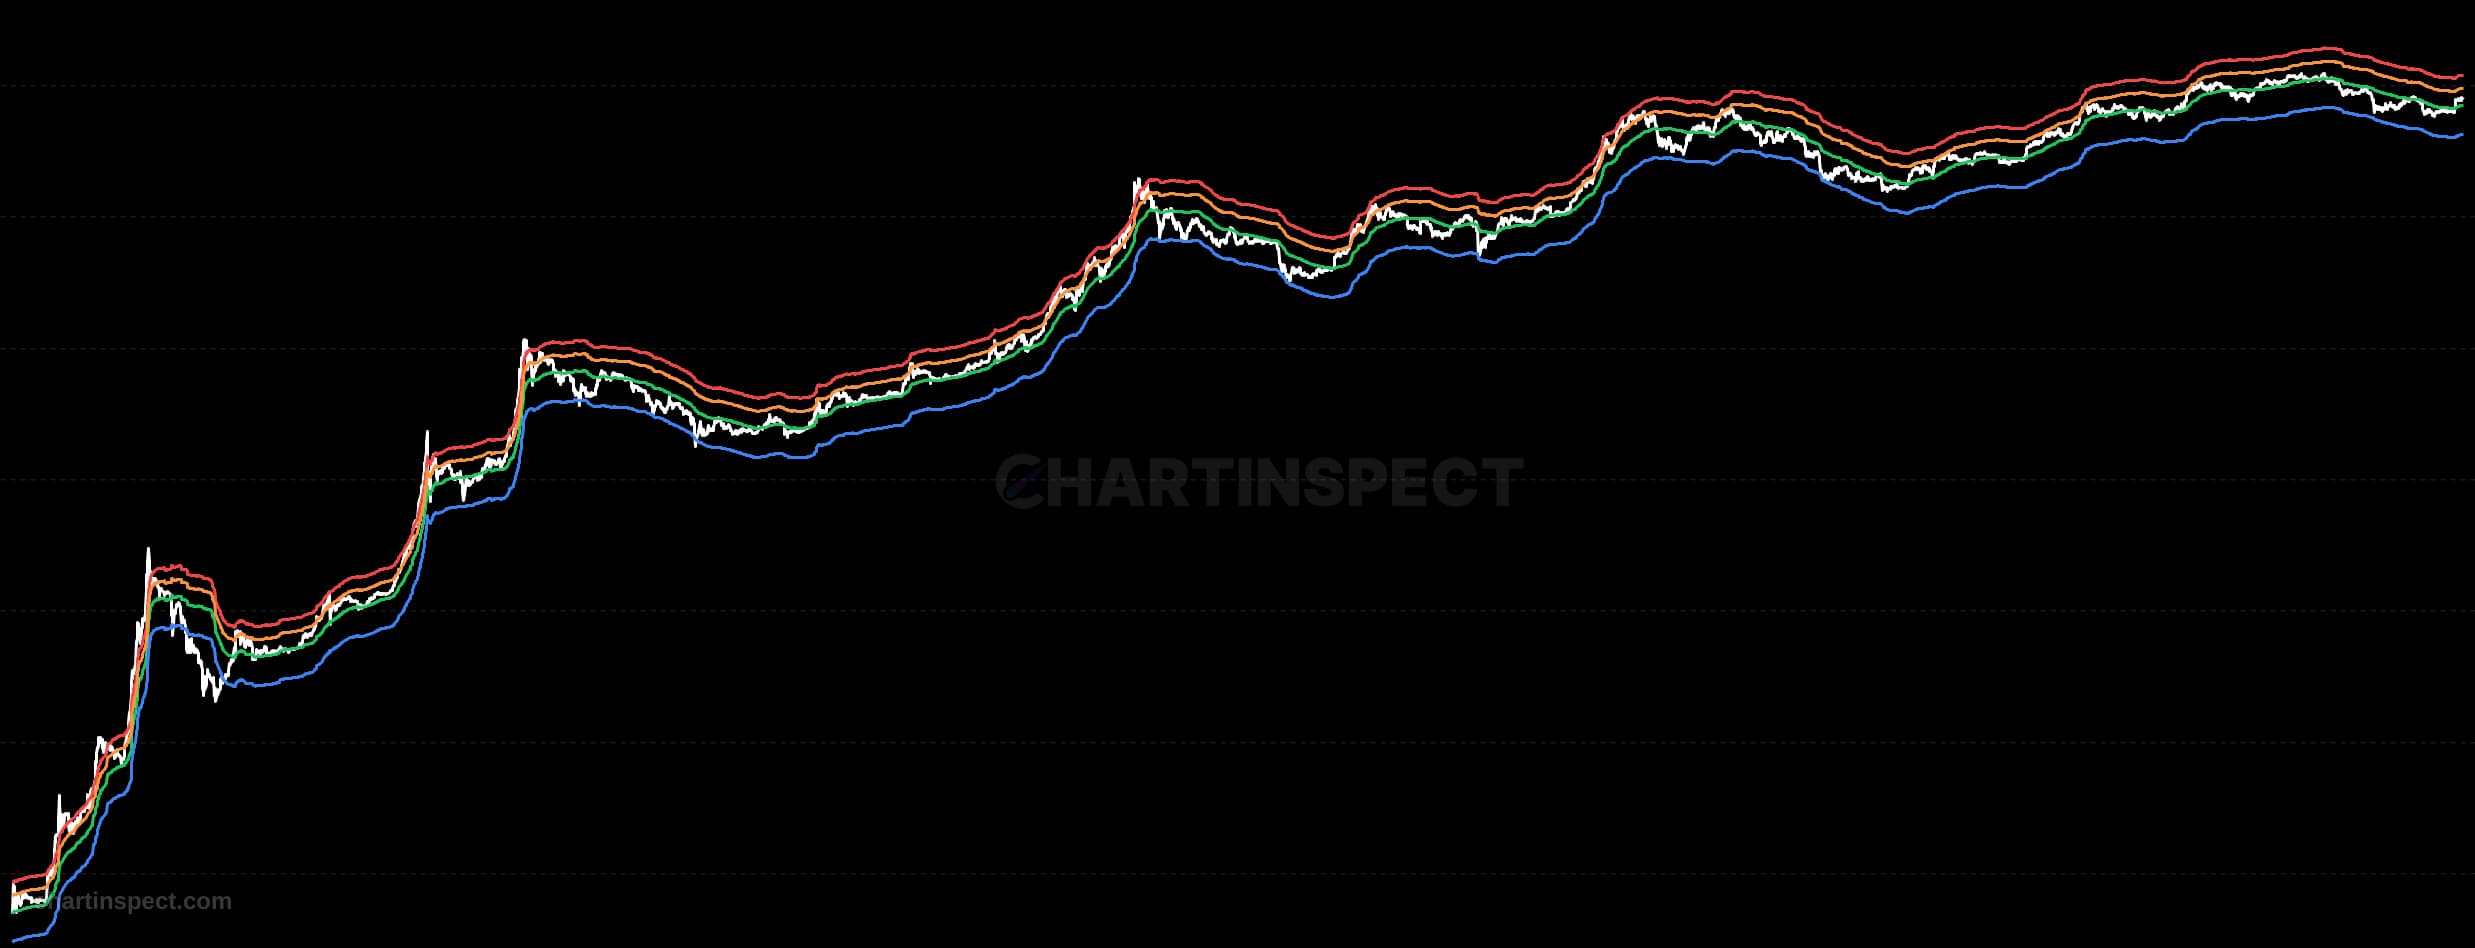
The cost basis distribution of the coins spent each day, drawn as 19 quantile bands. Where the cost-basis rainbow shows what the whole supply paid, this shows what the day's sellers paid, so you can see whether cheap long-held coins or recently-bought coins are the ones changing hands.
The cost-basis rainbow describes the standing supply. This chart describes the flow: every day, some coins move, and each of those coins has an acquisition price. Collect the acquisition prices of just the coins spent that day and you get a distribution, and this chart plots that spending distribution over time as 19 quantile bands.
Read it against the price line. When the lower bands sit far below spot, the coins being sold were acquired cheaply and long ago: long-term holders distributing into strength. When the bands crowd up against spot, recent buyers are the ones selling, which is what short-term capitulation looks like. The spread between the bands tells you whether a single tight cohort or a broad cross-section of the market did the selling.
Weighting and scope let you refine the view: value-weighting makes the bands hug price the way nym21's charts do, and the STH/LTH scope isolates spends by short-term versus long-term holders. The quantiles are exact order statistics read from the live spend histogram, precise to about a dollar at spot.
Check the selected asset, units, and cohort before comparing readings. Compare the metric over consistent dates and use related measures to understand what contributes to a change.
Addresses and on-chain cohorts do not identify individual people. Network designs and available histories differ, so a threshold observed on one asset may not transfer to another.
The cost basis distribution of the coins spent each day, drawn as 19 quantile bands. Where the cost-basis rainbow shows what the whole supply paid, this shows what the day's sellers paid, so you can see whether cheap long-held coins or recently-bought coins are the ones changing hands.
Freshness: Not yet verified
No community calls on Spending Rainbow yet. Be the first to share a take.
Discover more insights with our comprehensive chart collection
Explore All 8010 Charts