Loading chart data
Loading chart data
About S&P 500 50/200-Day Trend
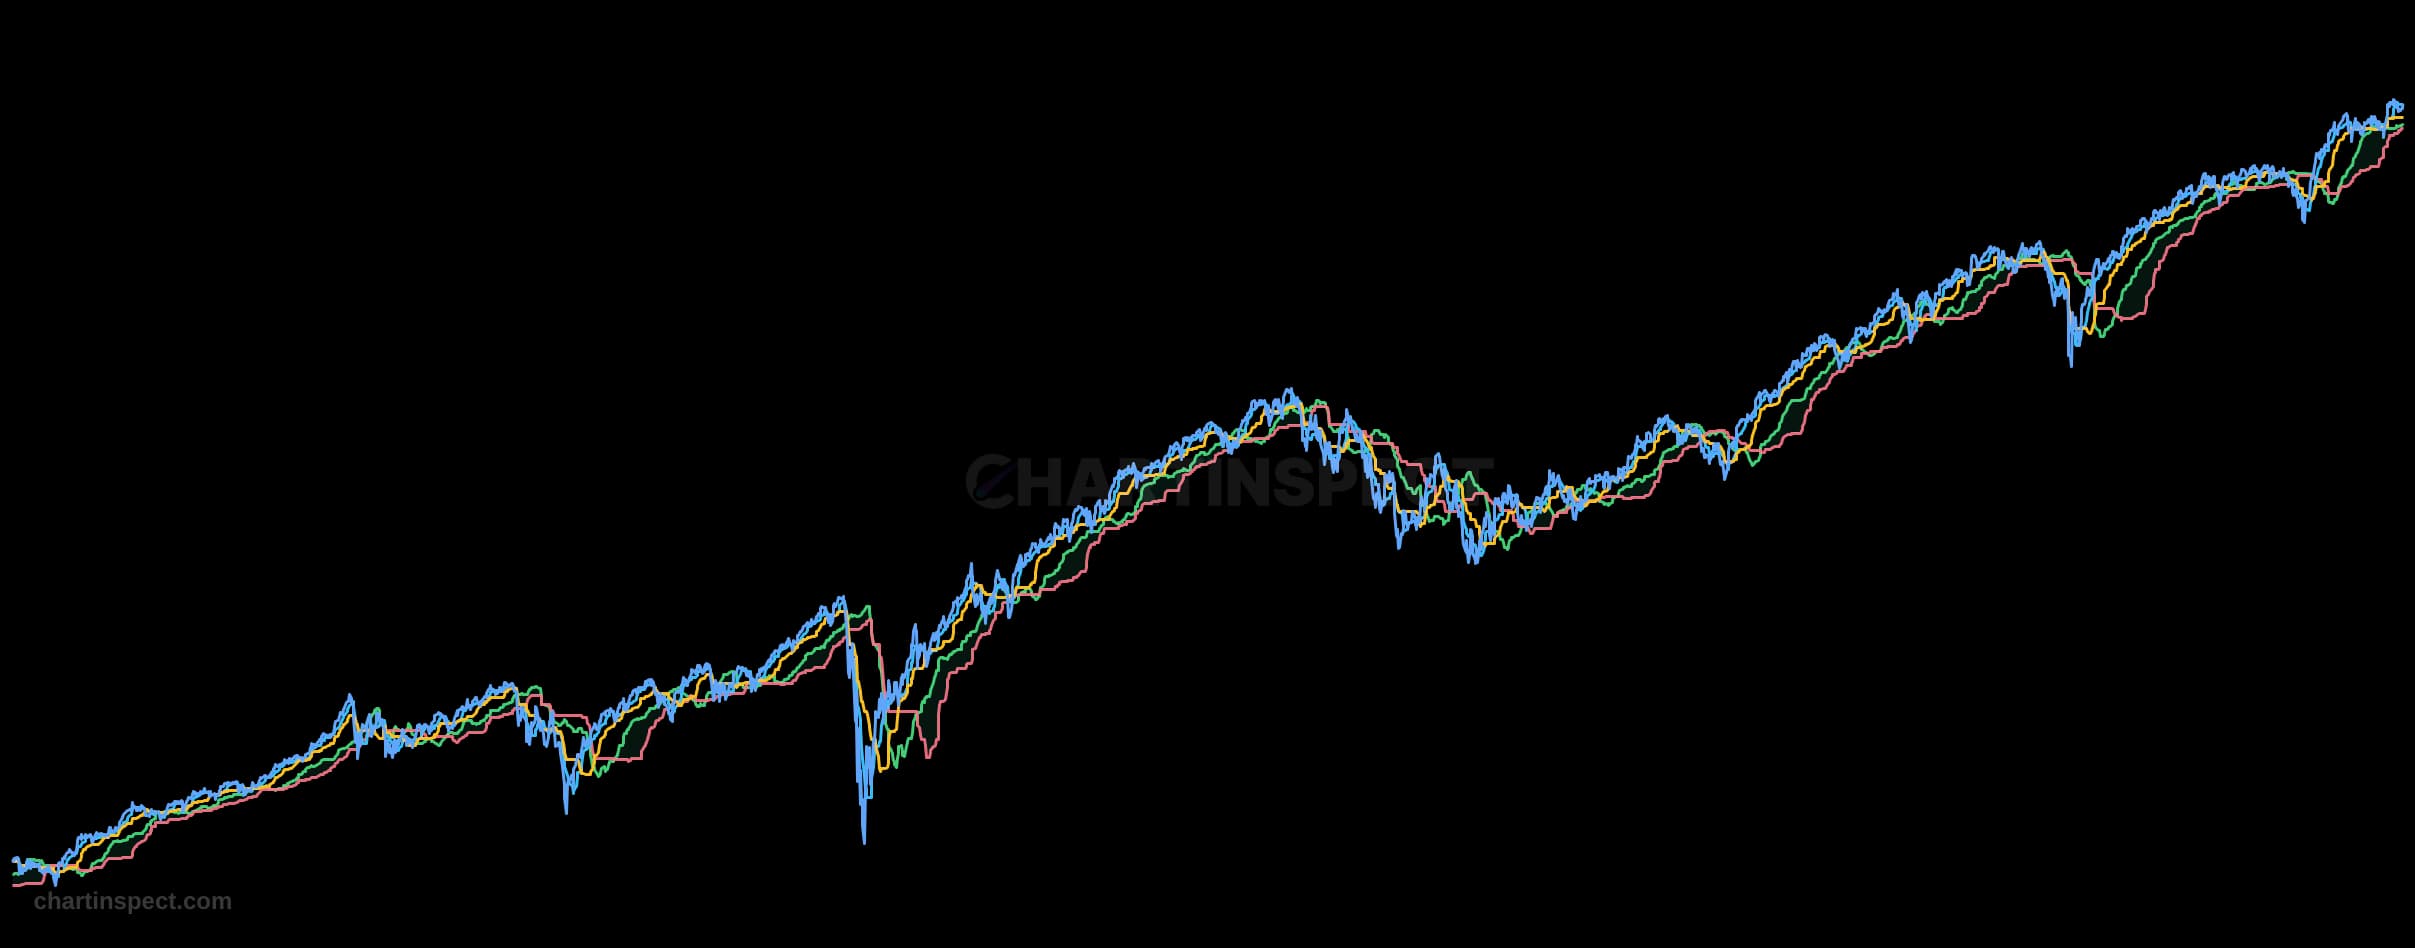
S&P 500 closing price with its 50-day and 200-day simple moving averages. The pair highlights medium- and long-term trend direction, including golden-cross and death-cross regimes, without treating a crossover as a standalone trading signal.
Freshness: Not yet verified
Community snapshot
No community calls on S&P 500 50/200-Day Trend yet. Be the first to share a take.
Related Analytics
Discover more insights with our comprehensive chart collection
Explore All 9143 Charts