Loading chart data
Loading chart data
About S&P 500 Bollinger Bands
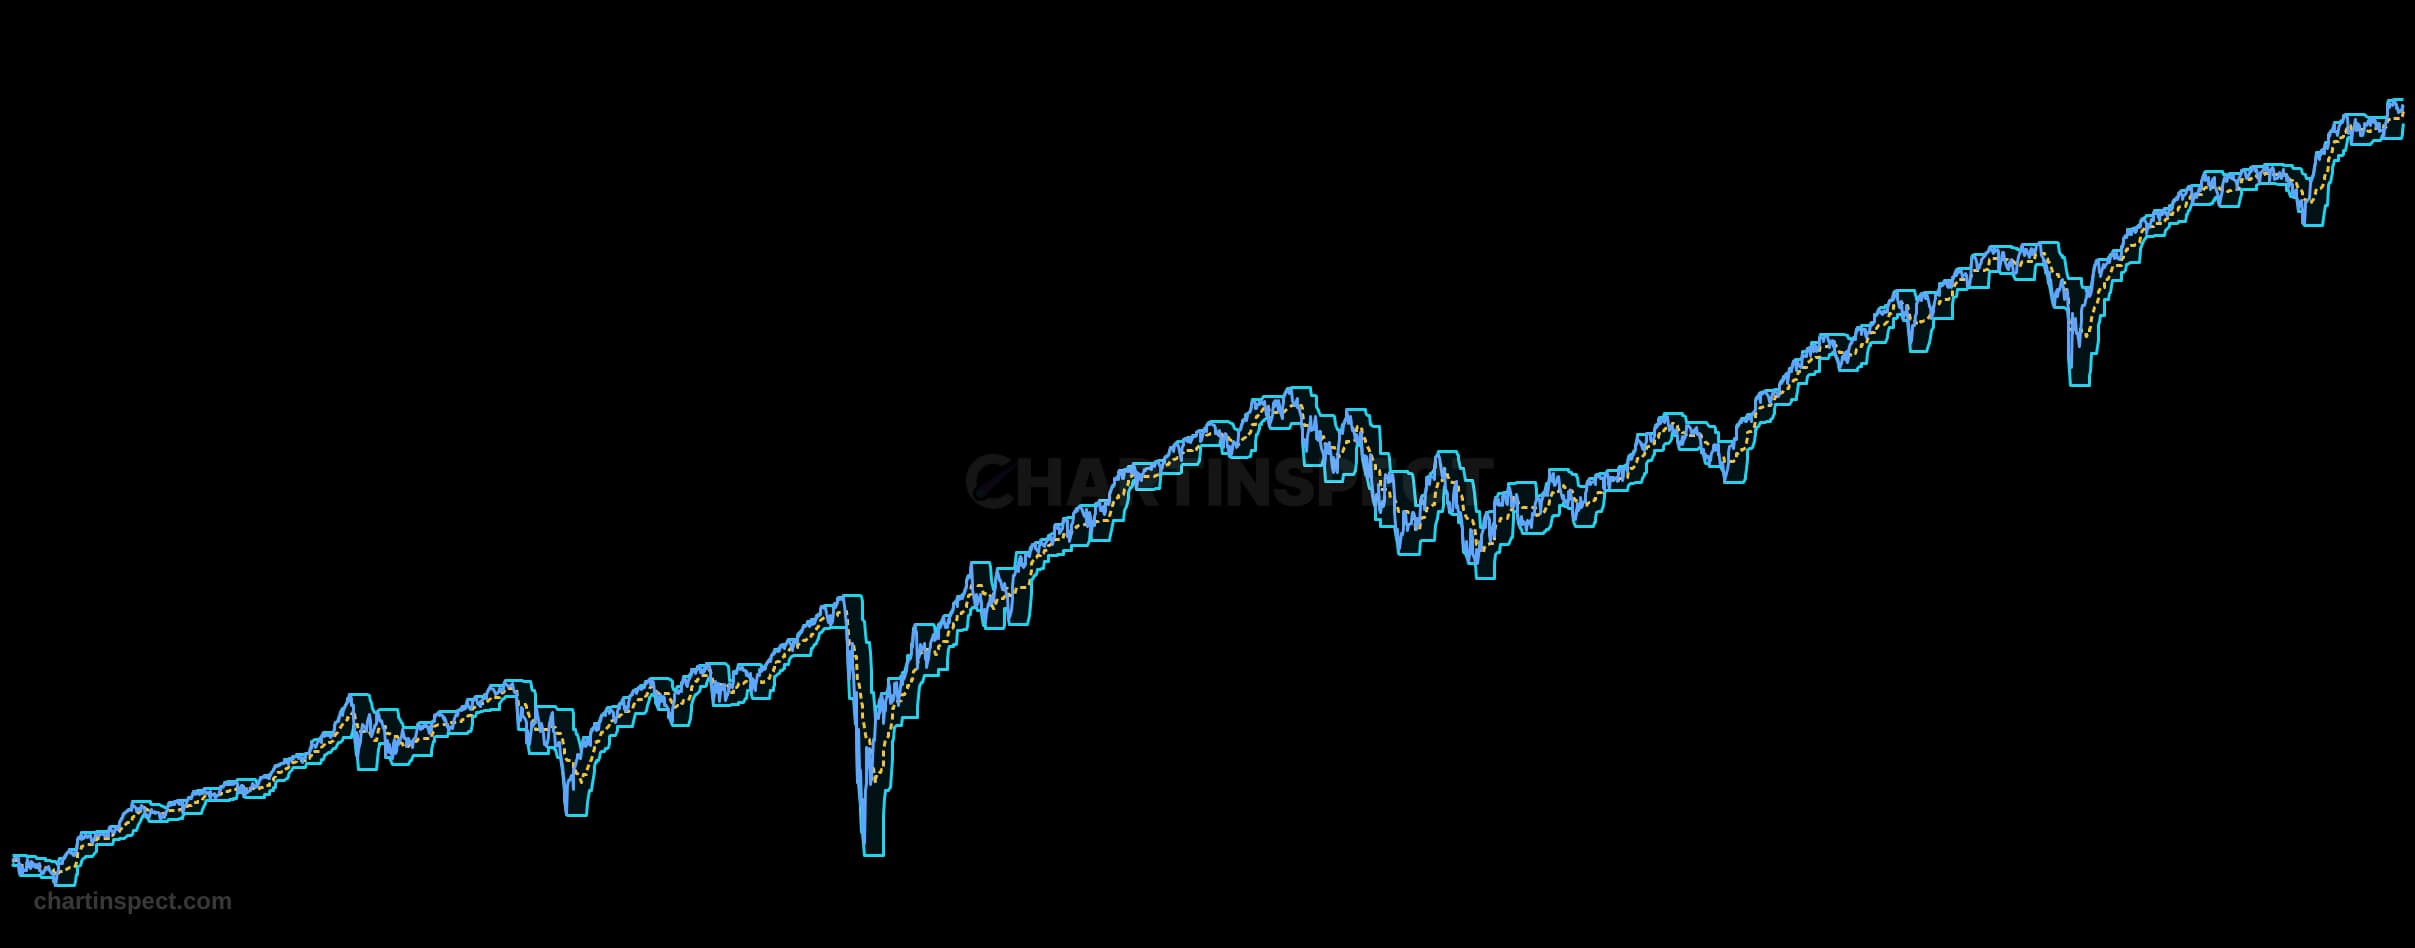
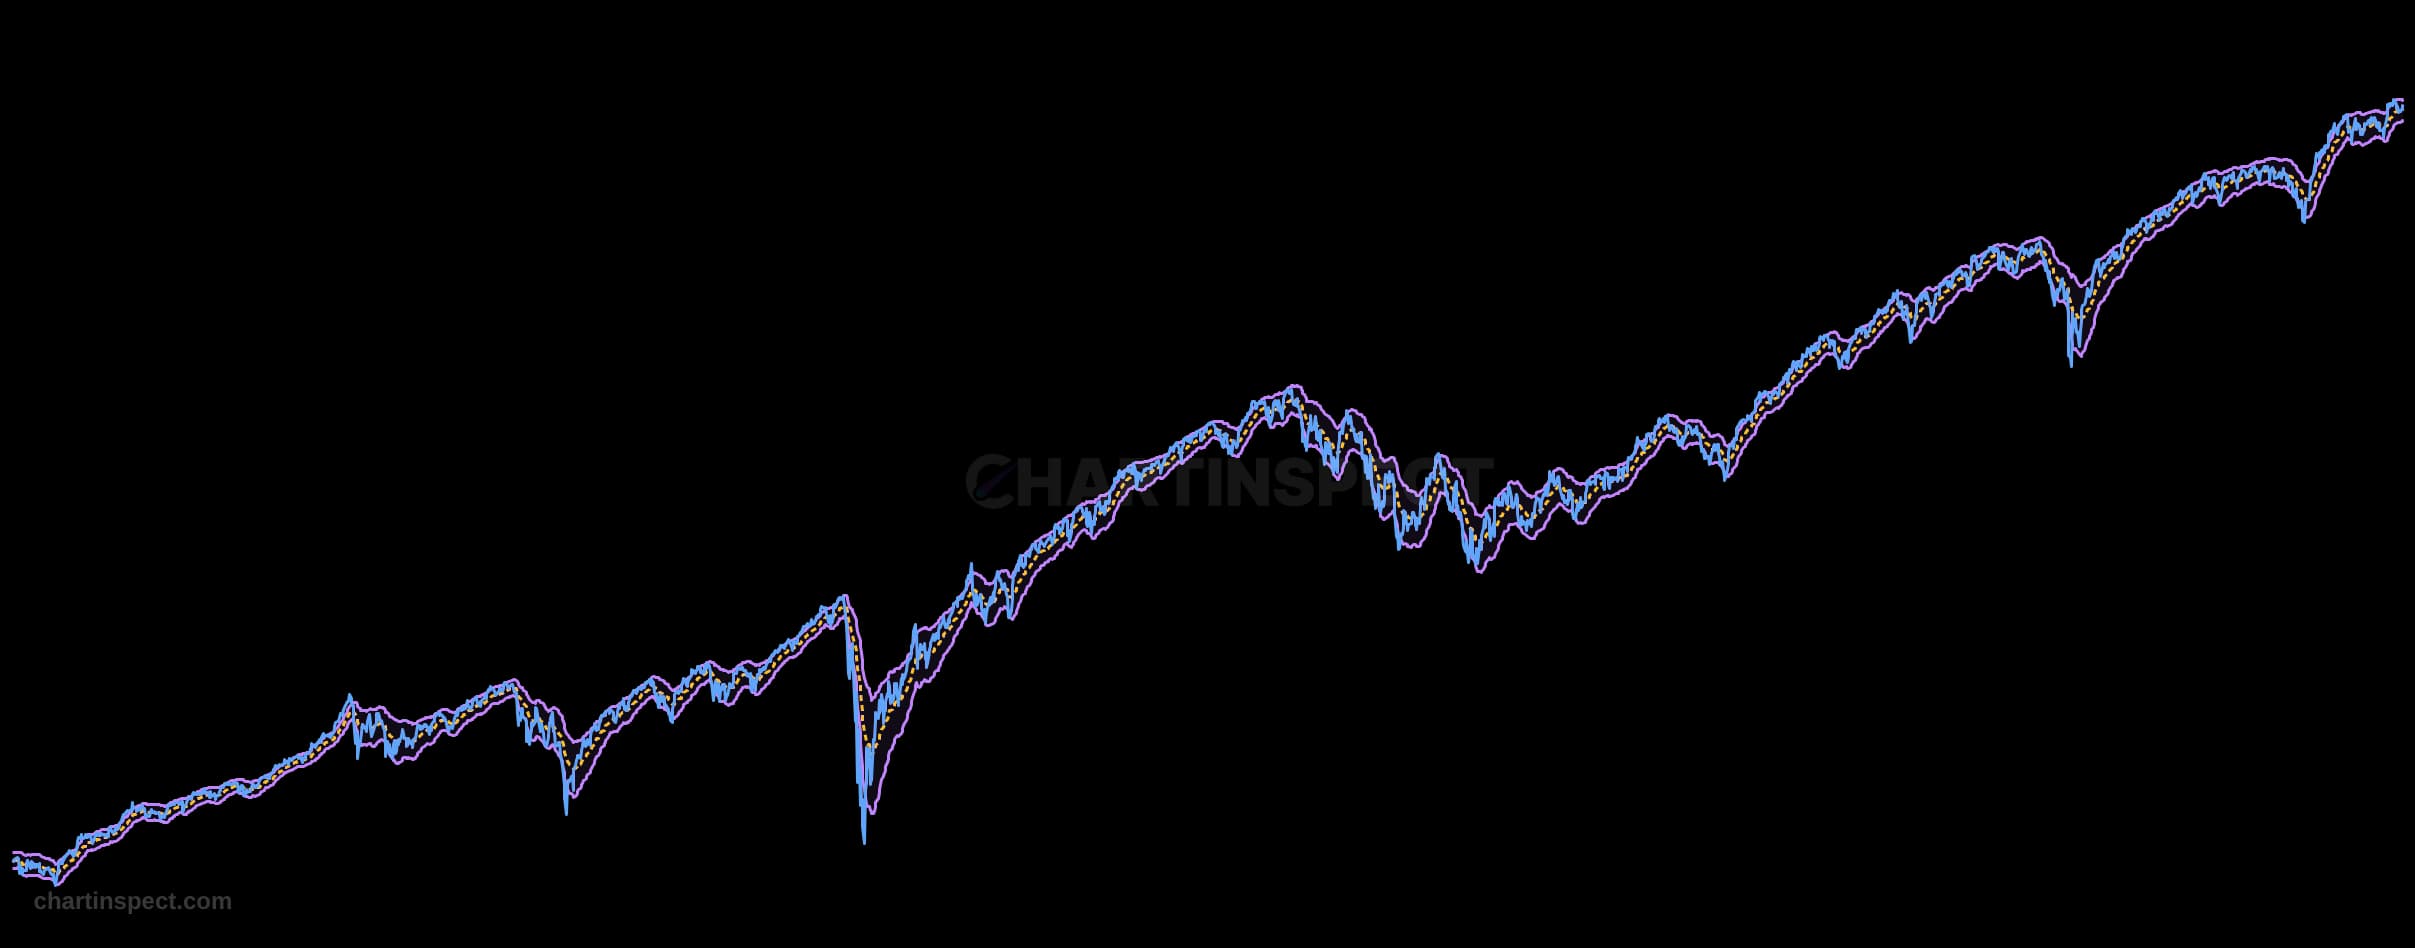
S&P 500 price inside 20-day Bollinger Bands set two population standard deviations above and below the moving average. Band expansion shows rising realized variability, while contraction marks quieter price regimes.
Freshness: Not yet verified
Community snapshot
No community calls on S&P 500 Bollinger Bands yet. Be the first to share a take.
Related Analytics
Discover more insights with our comprehensive chart collection
Explore All 9143 Charts