Loading chart data
Range
Scale
Loading chart data
About S&P 500 RSI
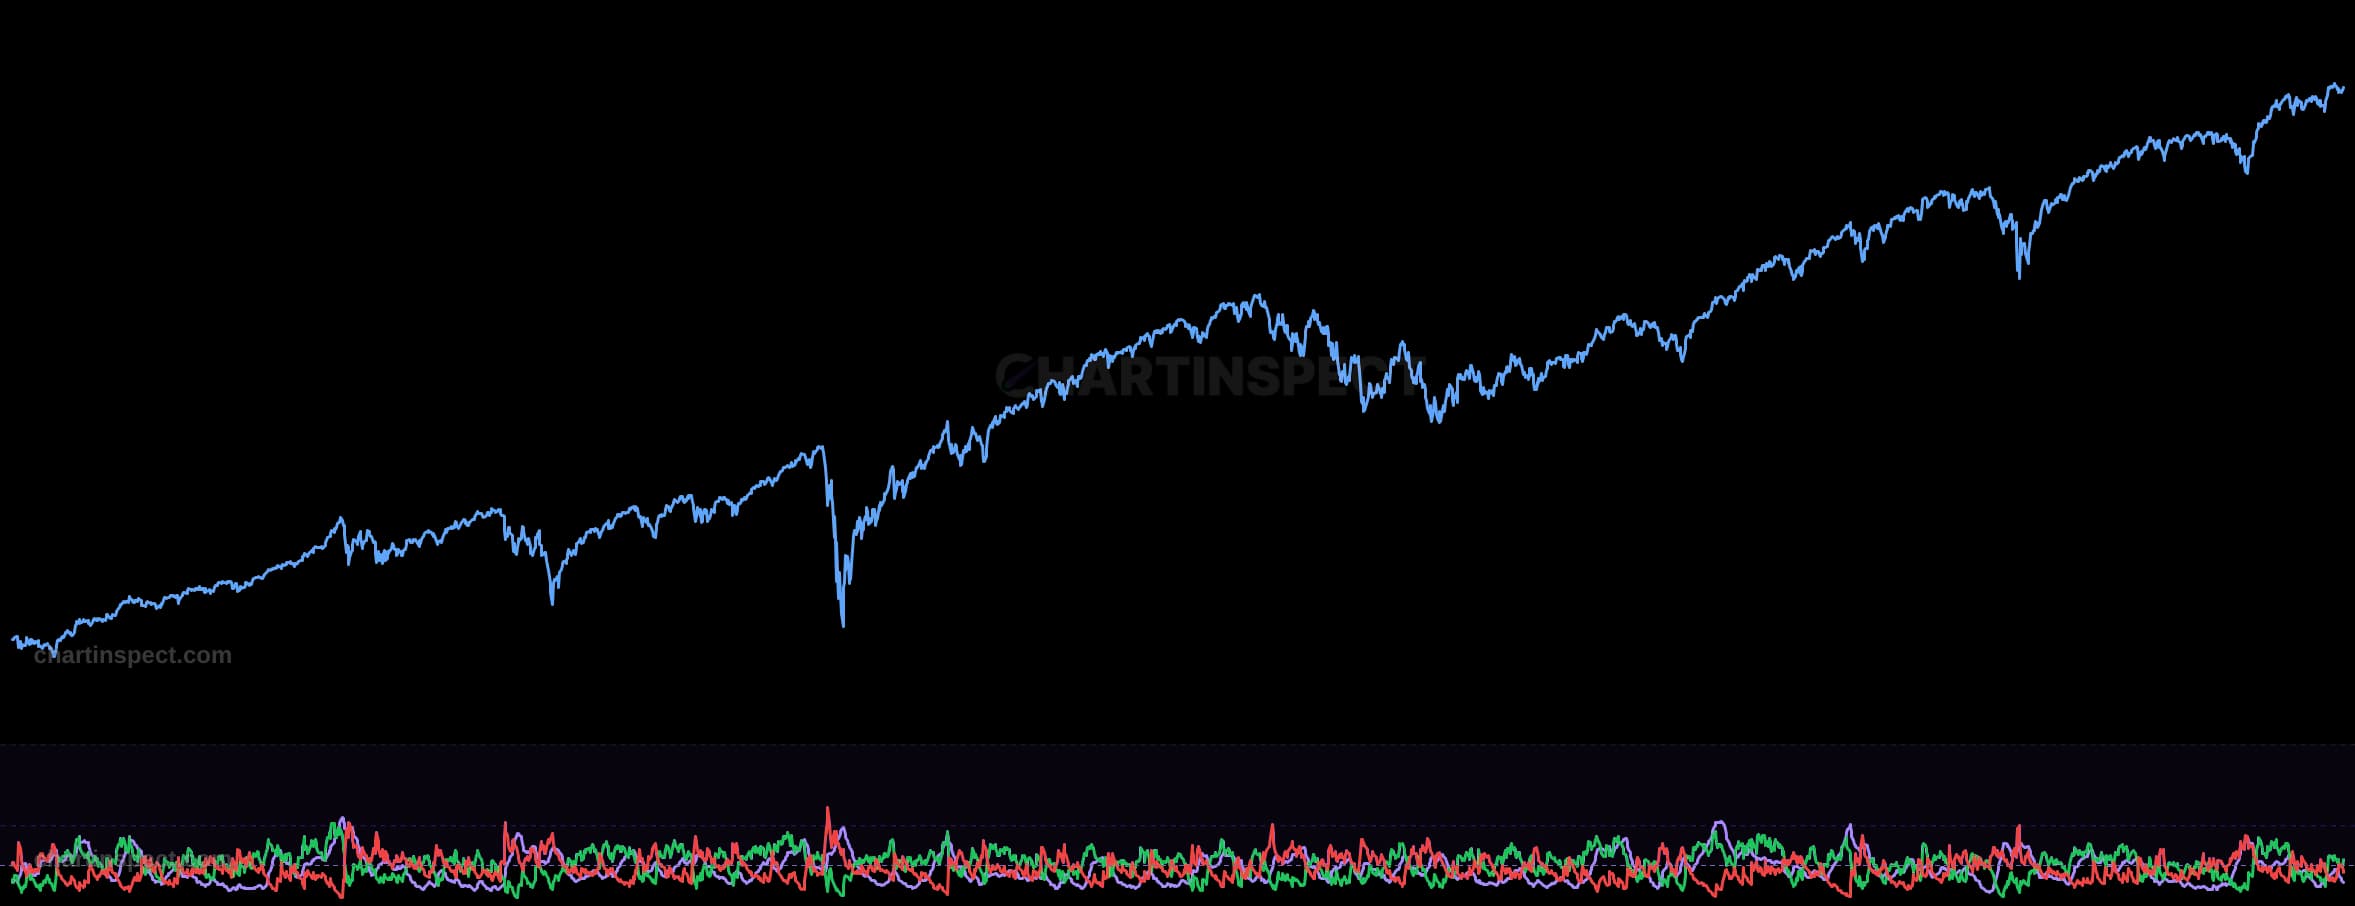
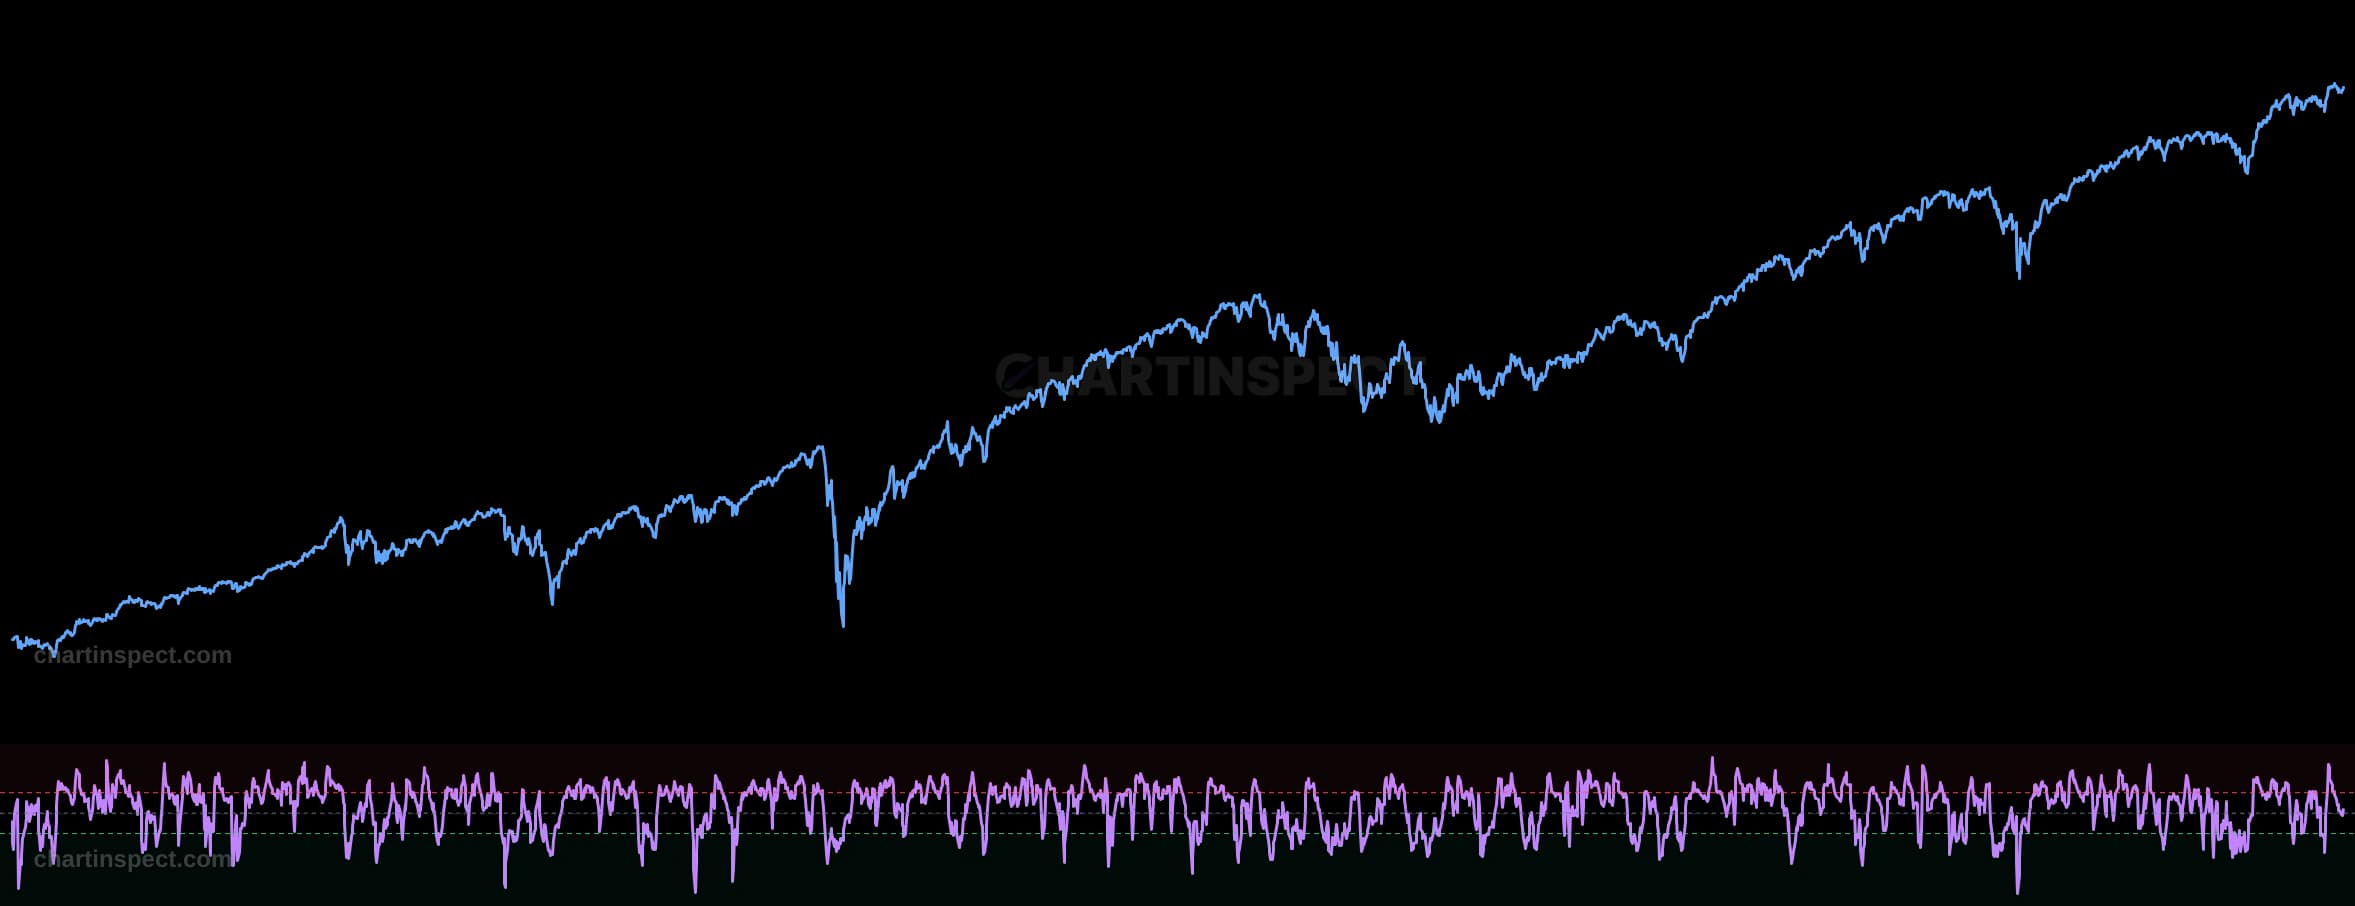
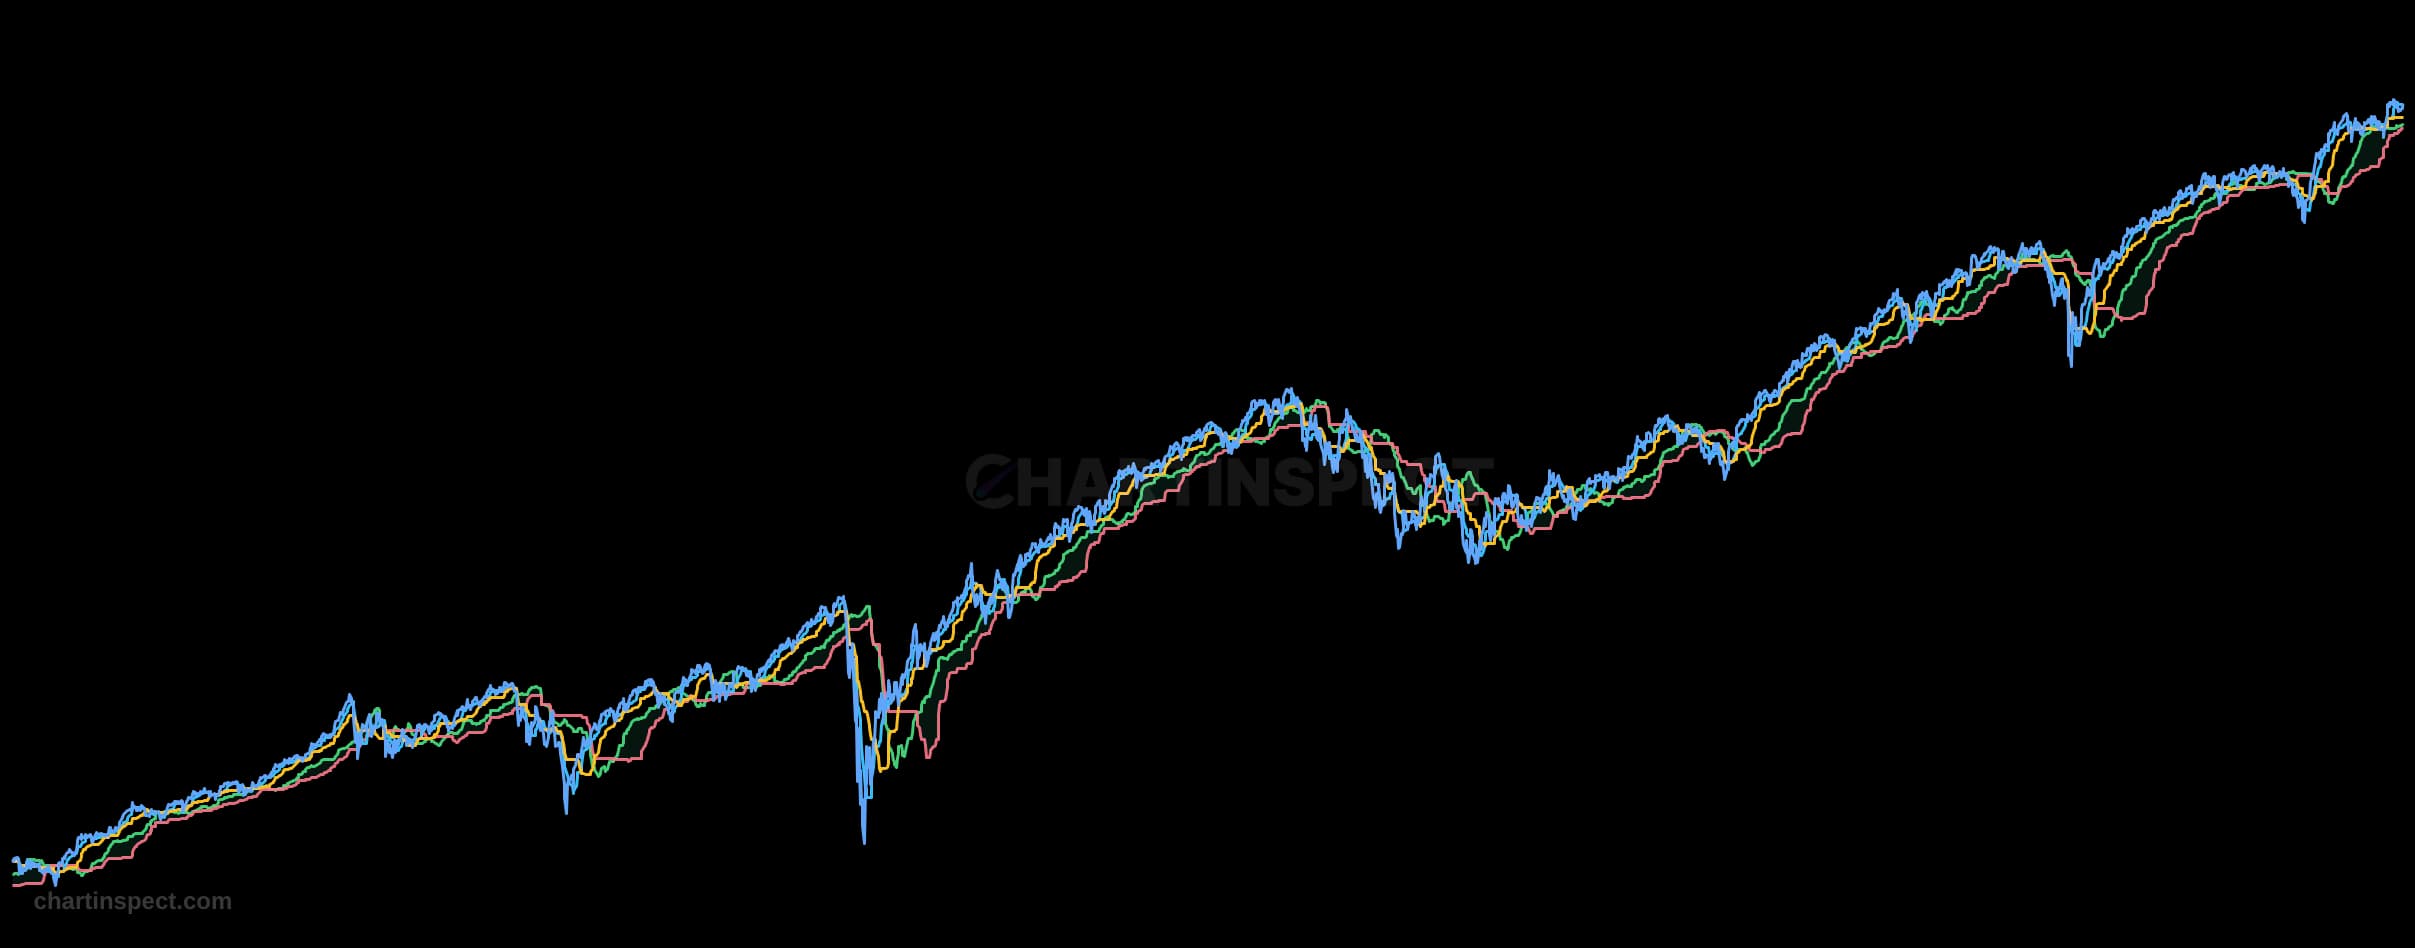
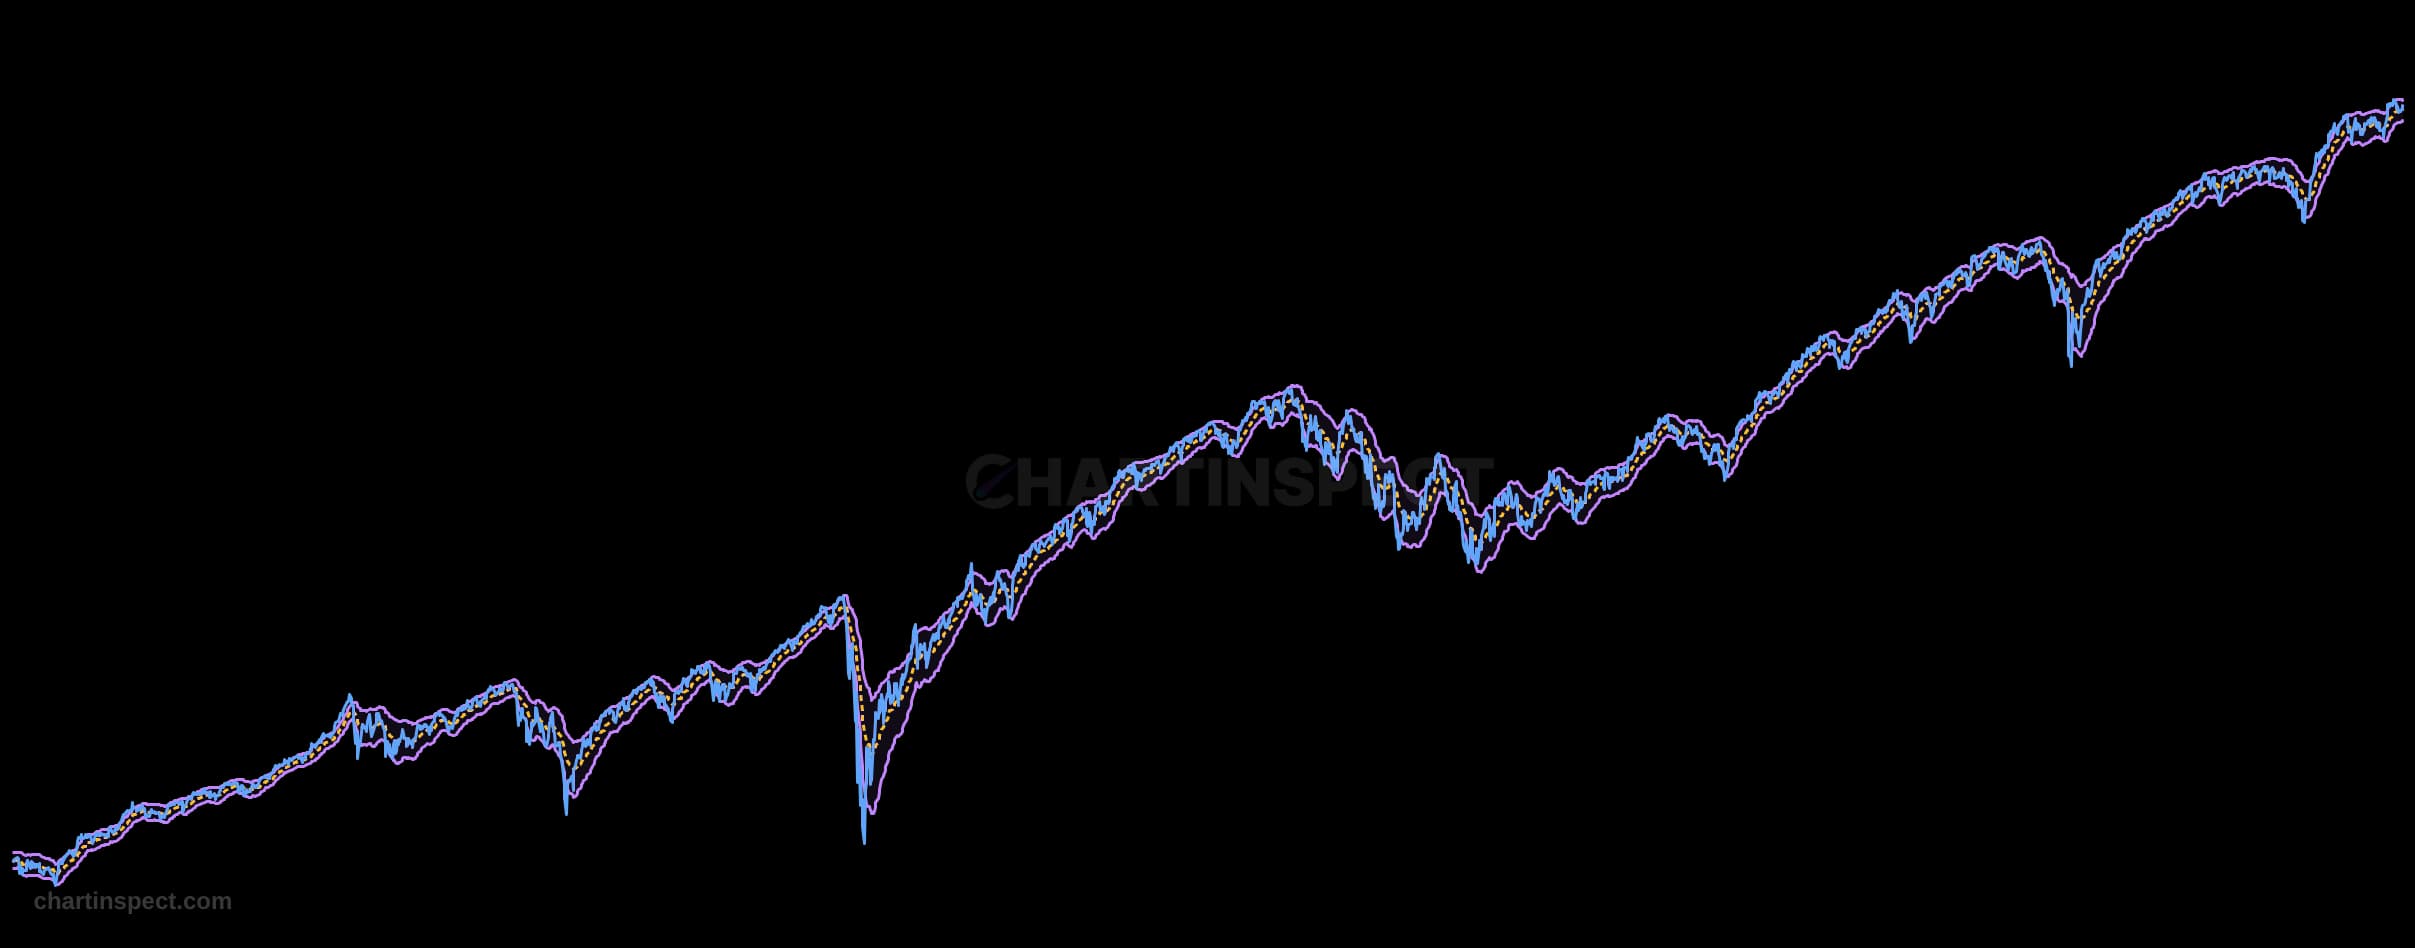
S&P 500 price with Wilder’s 14-day Relative Strength Index in a synchronized lower pane. The fixed 30 and 70 guides identify historically stretched momentum while preserving the price context above.
Freshness: Not yet verified
Community snapshot
No community calls on S&P 500 RSI yet. Be the first to share a take.
Related Analytics
Discover more insights with our comprehensive chart collection
Explore All 9143 Charts