Loading chart data
Loading chart data
About M2 Liquidity Regime
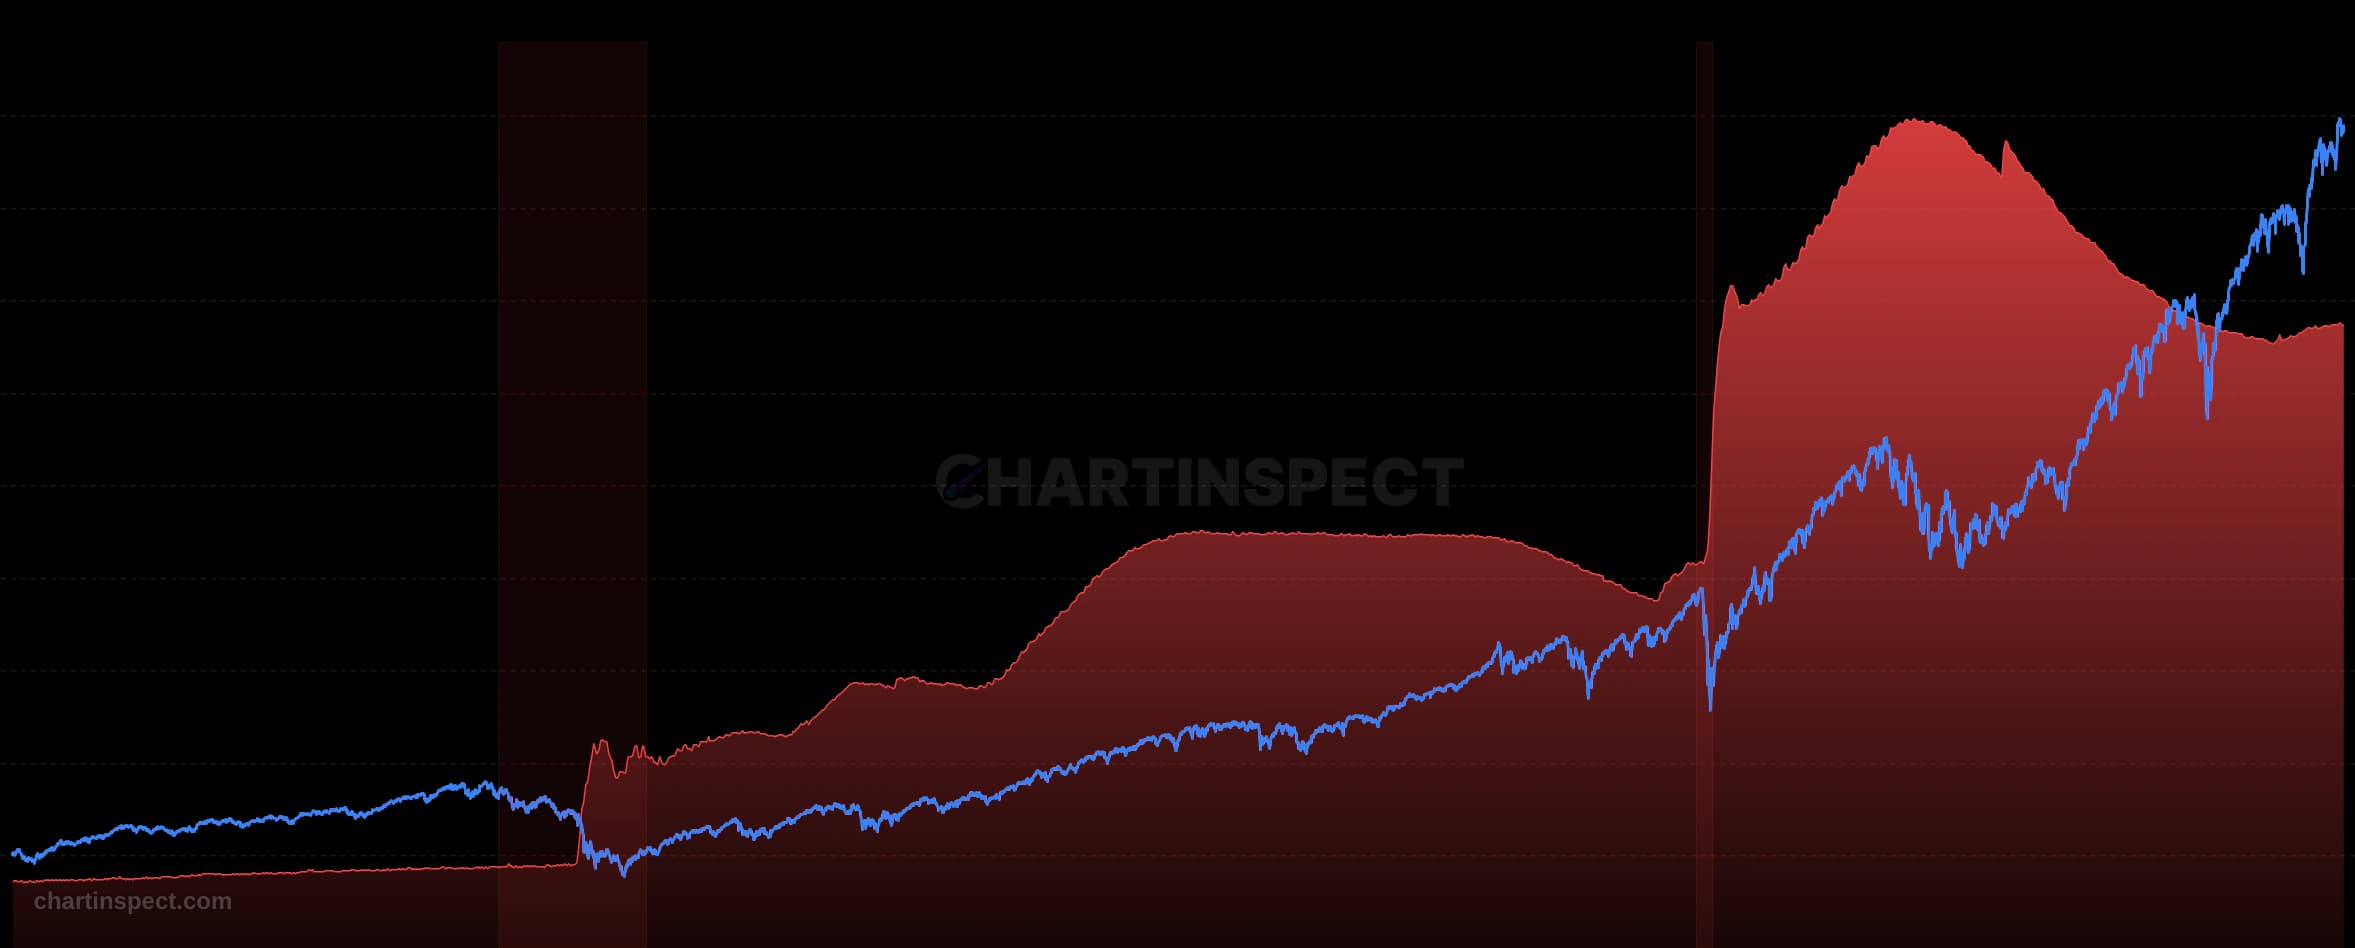
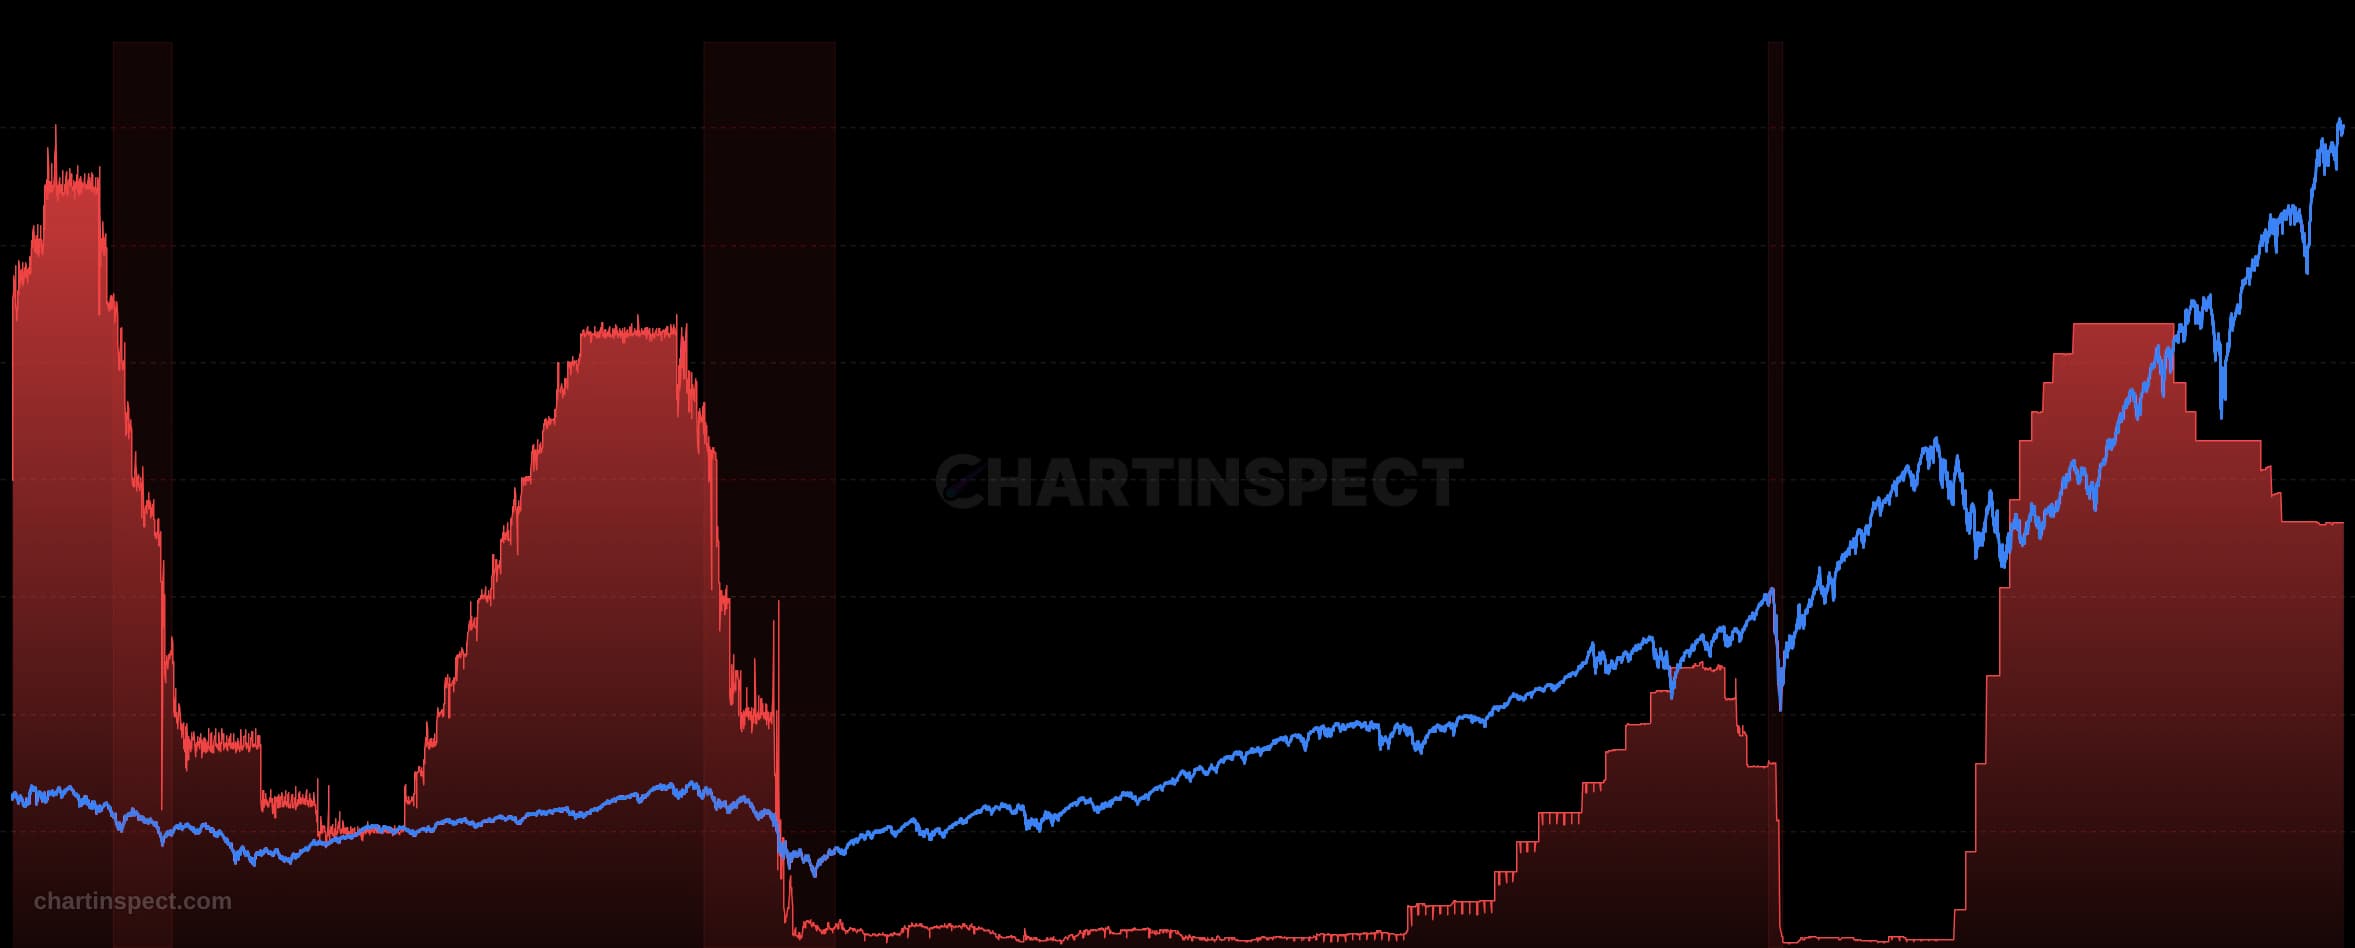
Global M2 year-over-year growth with the background shaded green when money supply is expanding (positive growth, historically a risk-on / bullish liquidity regime for Bitcoin) and red when it is contracting (negative growth, rare, as in the 2022 drawdown). A one-glance read on whether the liquidity tide is rising or falling under the BTC price.
Freshness: Not yet verified
Community snapshot
No community calls on M2 Liquidity Regime yet. Be the first to share a take.
Related Analytics
Discover more insights with our comprehensive chart collection
Explore All 9143 Charts