ETH VDD Multiple - Ethereum On-Chain Data Analysis
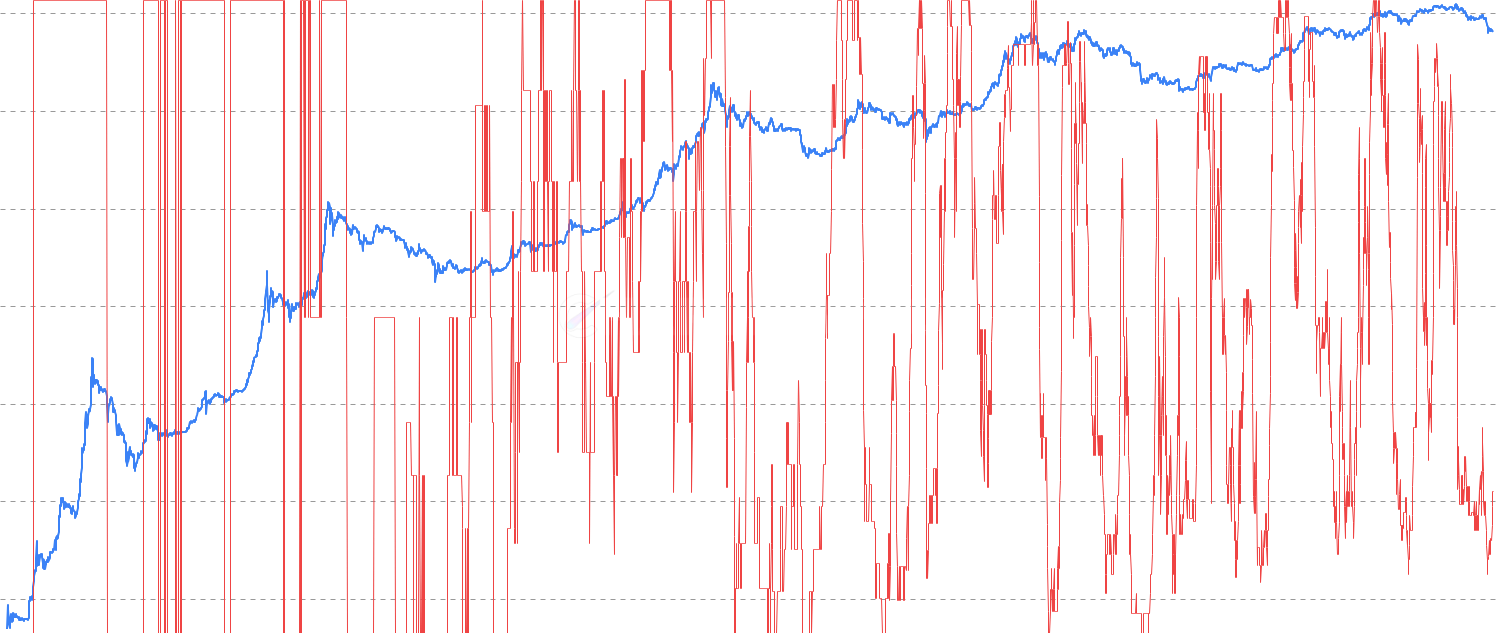
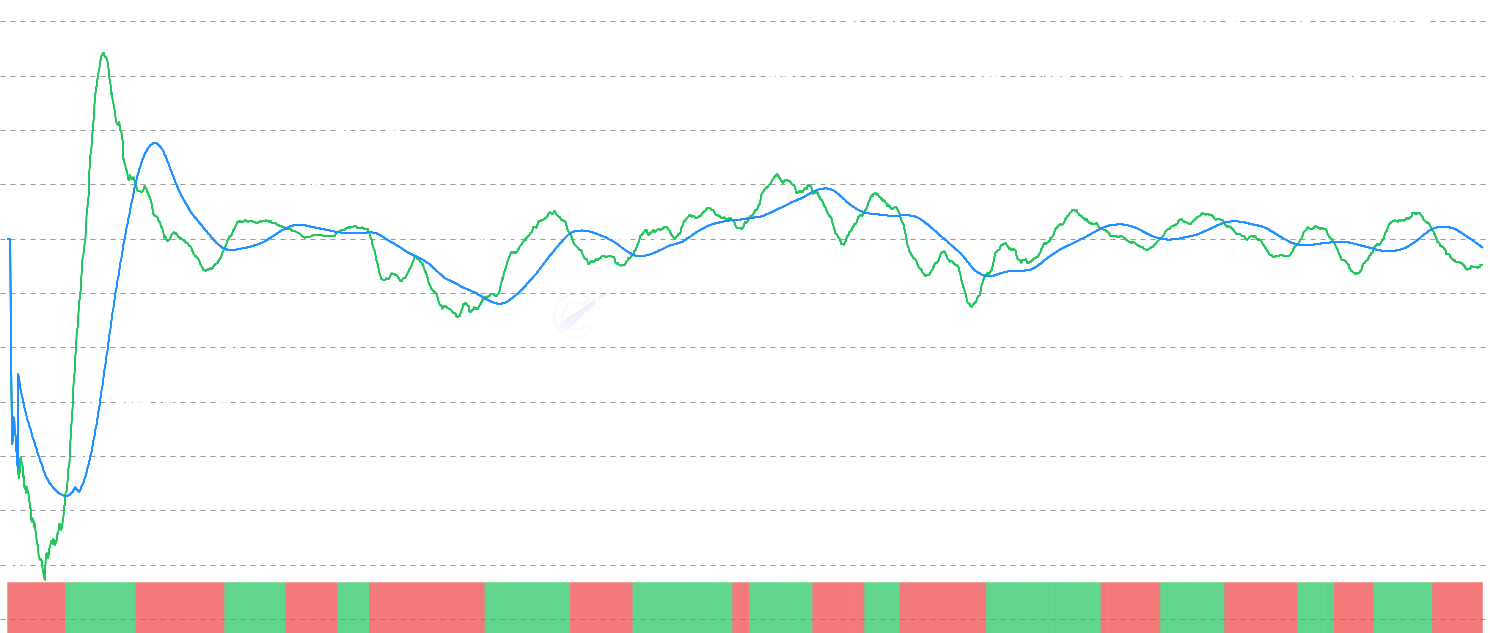
Value Days Destroyed Multiple identifies when older coins enter the market during bull runs. Compares short-term and long-term coin movement patterns, adjusted for supply maturity. Red bars (≥2.9) signal extreme old coin movement - only 5% of Ethereum's history trades above this level, often marking major cycle tops.
About ETH VDD Multiple Indicator
This on-chain metrics chart provides professional-grade analysis for Ethereum and cryptocurrency markets. The eth vdd multiple indicator is part of ChartInspect's comprehensive suite of blockchain analytics tools, designed to help traders and investors make informed decisions based on on-chain blockchain data.
Key Features of ETH VDD Multiple
- Real-time on-chain metrics data visualization
- Historical Ethereum and cryptocurrency market analysis
- Interactive charting with zoom and timeframe selection
- Premium-grade institutional analytics
- Mobile-responsive design for trading on the go
How to Use ETH VDD Multiple for Ethereum Trading
Navigate through different timeframes to analyze Ethereum market cycles. Use the interactive features to zoom into specific periods and identify key on-chain signalsthat can inform your cryptocurrency investment strategy.
Ethereum On-Chain Data Analysis
Ethereum on-chain data analysis provides unique insights into market dynamics that traditional technical analysis cannot offer. By examining blockchain data with the eth vdd multiple, we can understand holder behavior, network usage, and market sentiment to identify potential trend changes and investment opportunities in the cryptocurrency market.