ADA Fee to Reward Ratio - Cardano On-Chain Data Analysis
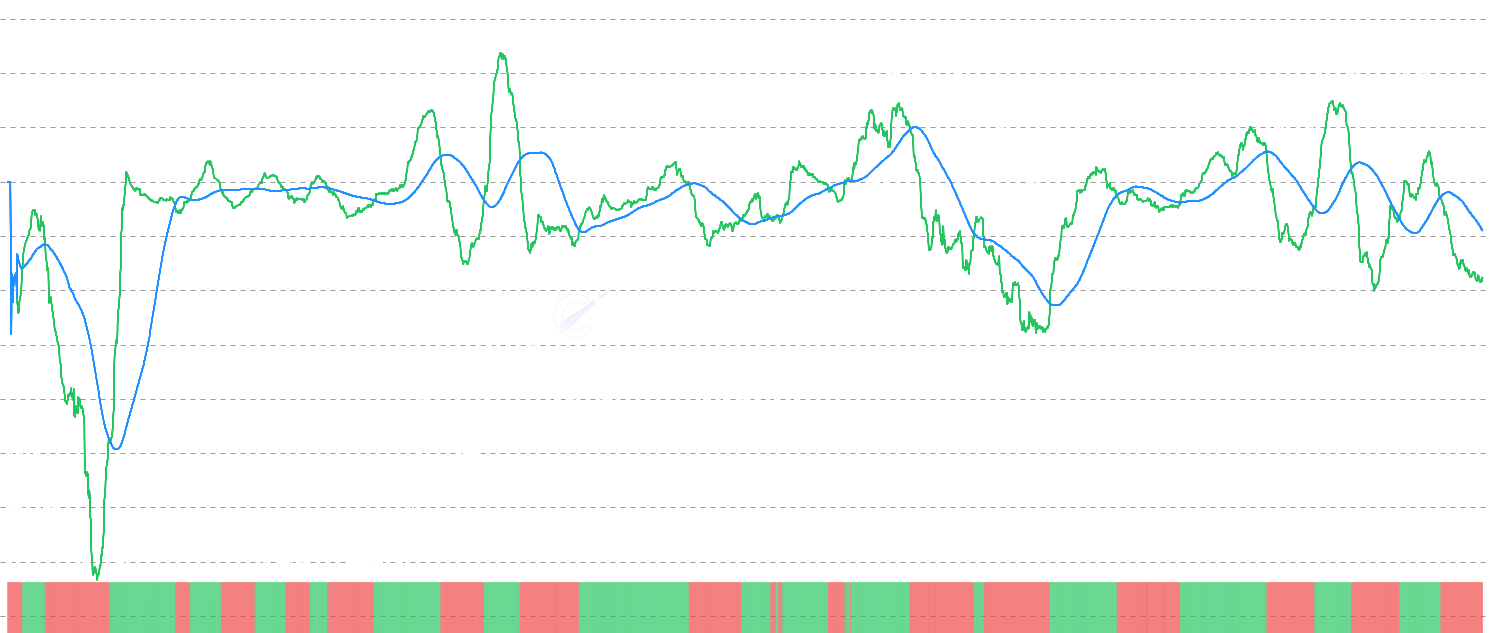
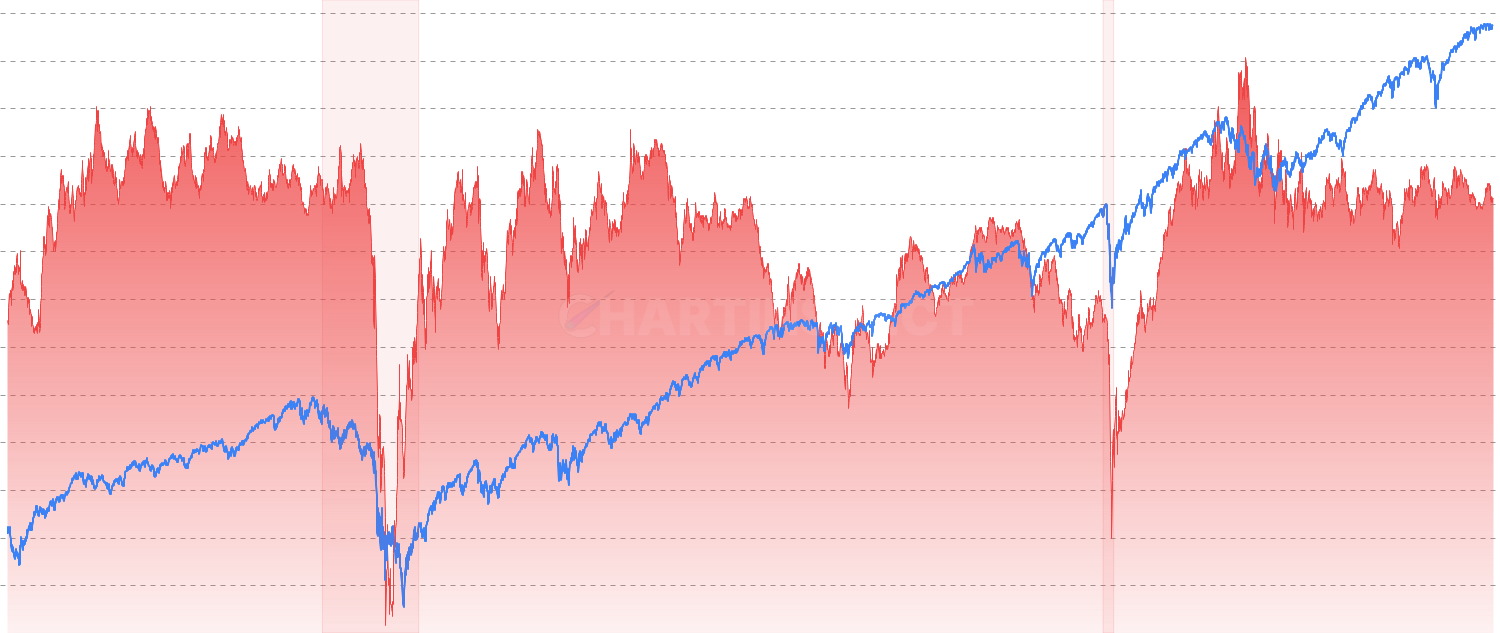
Track the split between transaction fee revenue and block reward revenue for miners/validators. Shows what percentage of total mining income comes from fees versus block subsidies, revealing how sustainable the network security model is as block rewards decline over time.
About ADA Fee to Reward Ratio Indicator
This on-chain metrics chart provides professional-grade analysis for Cardano and cryptocurrency markets. The ada fee to reward ratio indicator is part of ChartInspect's comprehensive suite of blockchain analytics tools, designed to help traders and investors make informed decisions based on on-chain blockchain data.
Key Features of ADA Fee to Reward Ratio
- Real-time on-chain metrics data visualization
- Historical Cardano and cryptocurrency market analysis
- Interactive charting with zoom and timeframe selection
- Premium-grade institutional analytics
- Mobile-responsive design for trading on the go
How to Use ADA Fee to Reward Ratio for Cardano Trading
Navigate through different timeframes to analyze Cardano market cycles. Use the interactive features to zoom into specific periods and identify key on-chain signalsthat can inform your cryptocurrency investment strategy.
Cardano On-Chain Data Analysis
Cardano on-chain data analysis provides unique insights into market dynamics that traditional technical analysis cannot offer. By examining blockchain data with the ada fee to reward ratio, we can understand holder behavior, network usage, and market sentiment to identify potential trend changes and investment opportunities in the cryptocurrency market.