Loading chart data
Loading chart data
About XRP Realized P&L
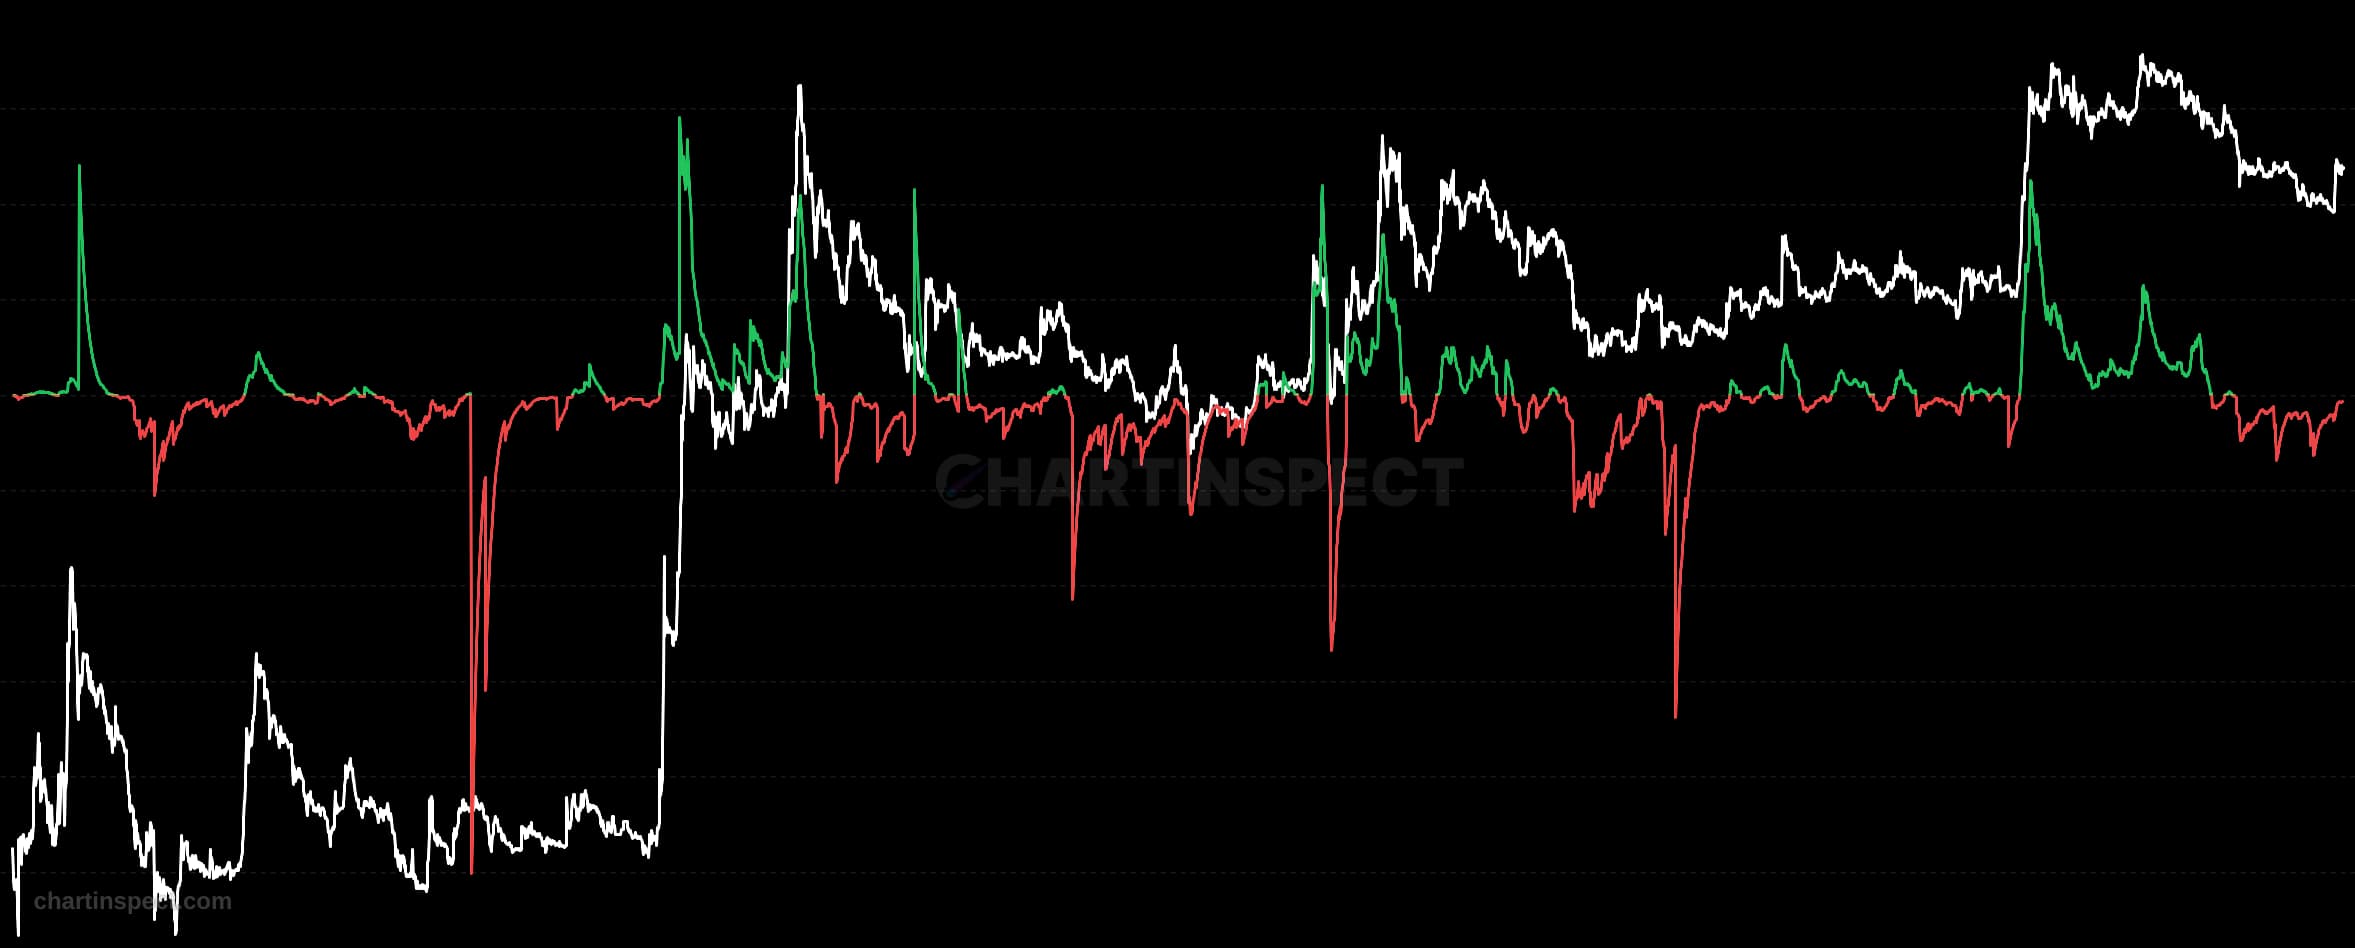
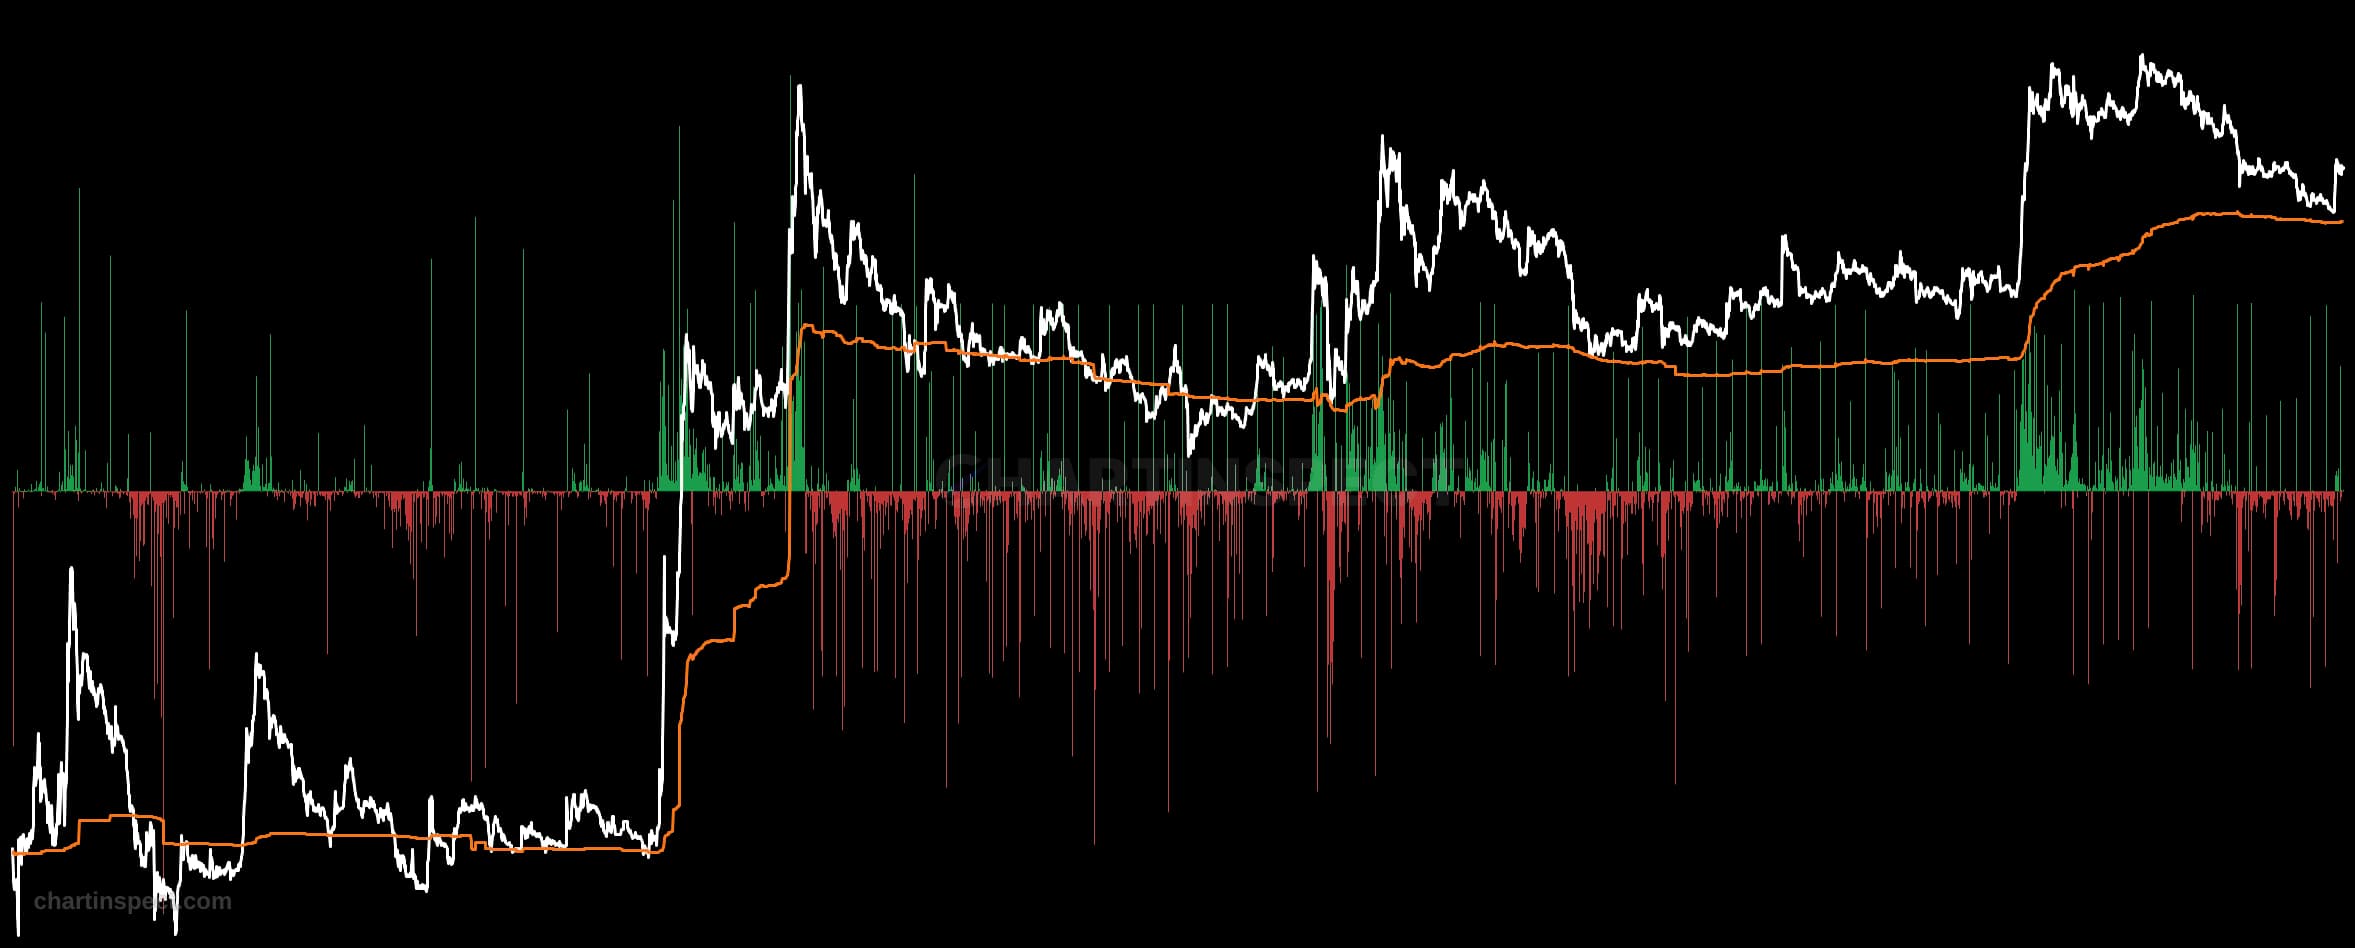
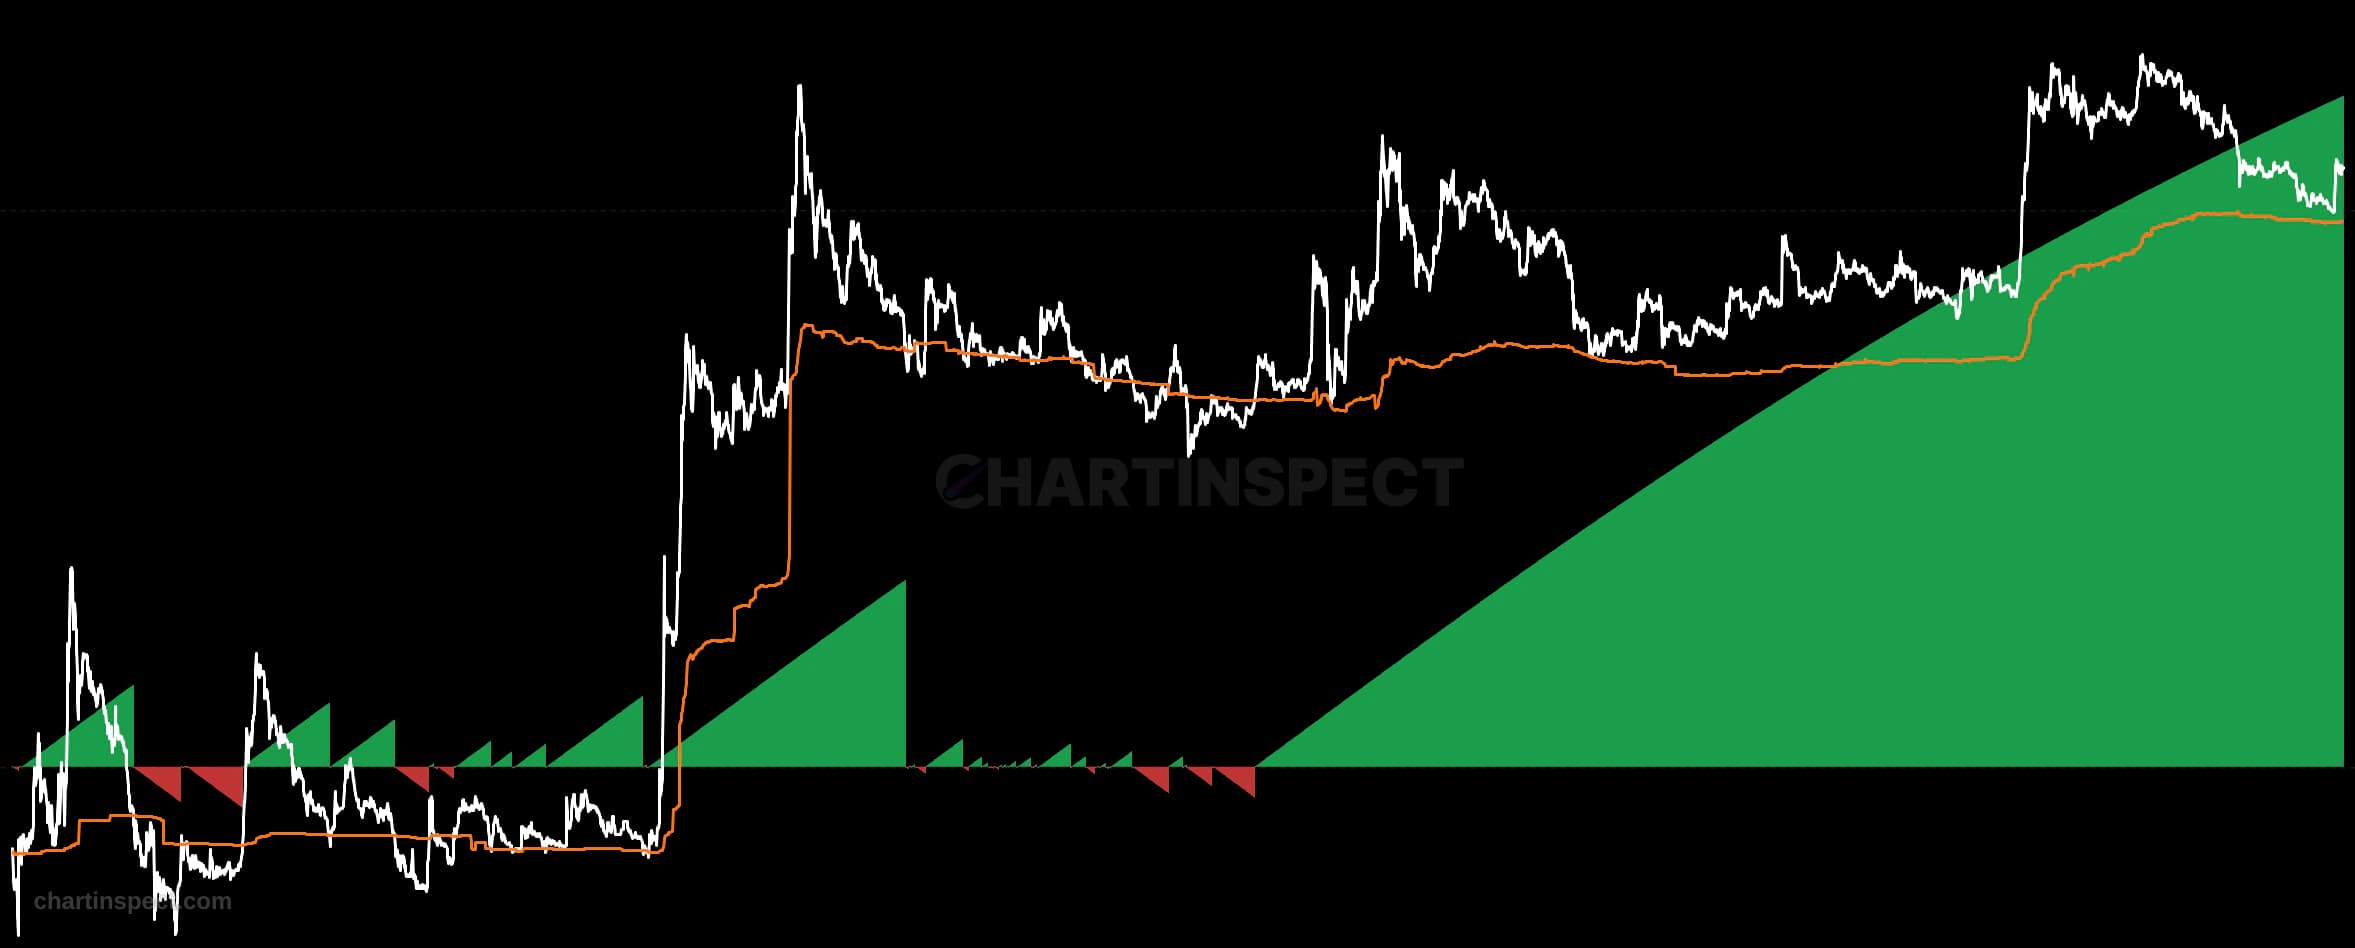
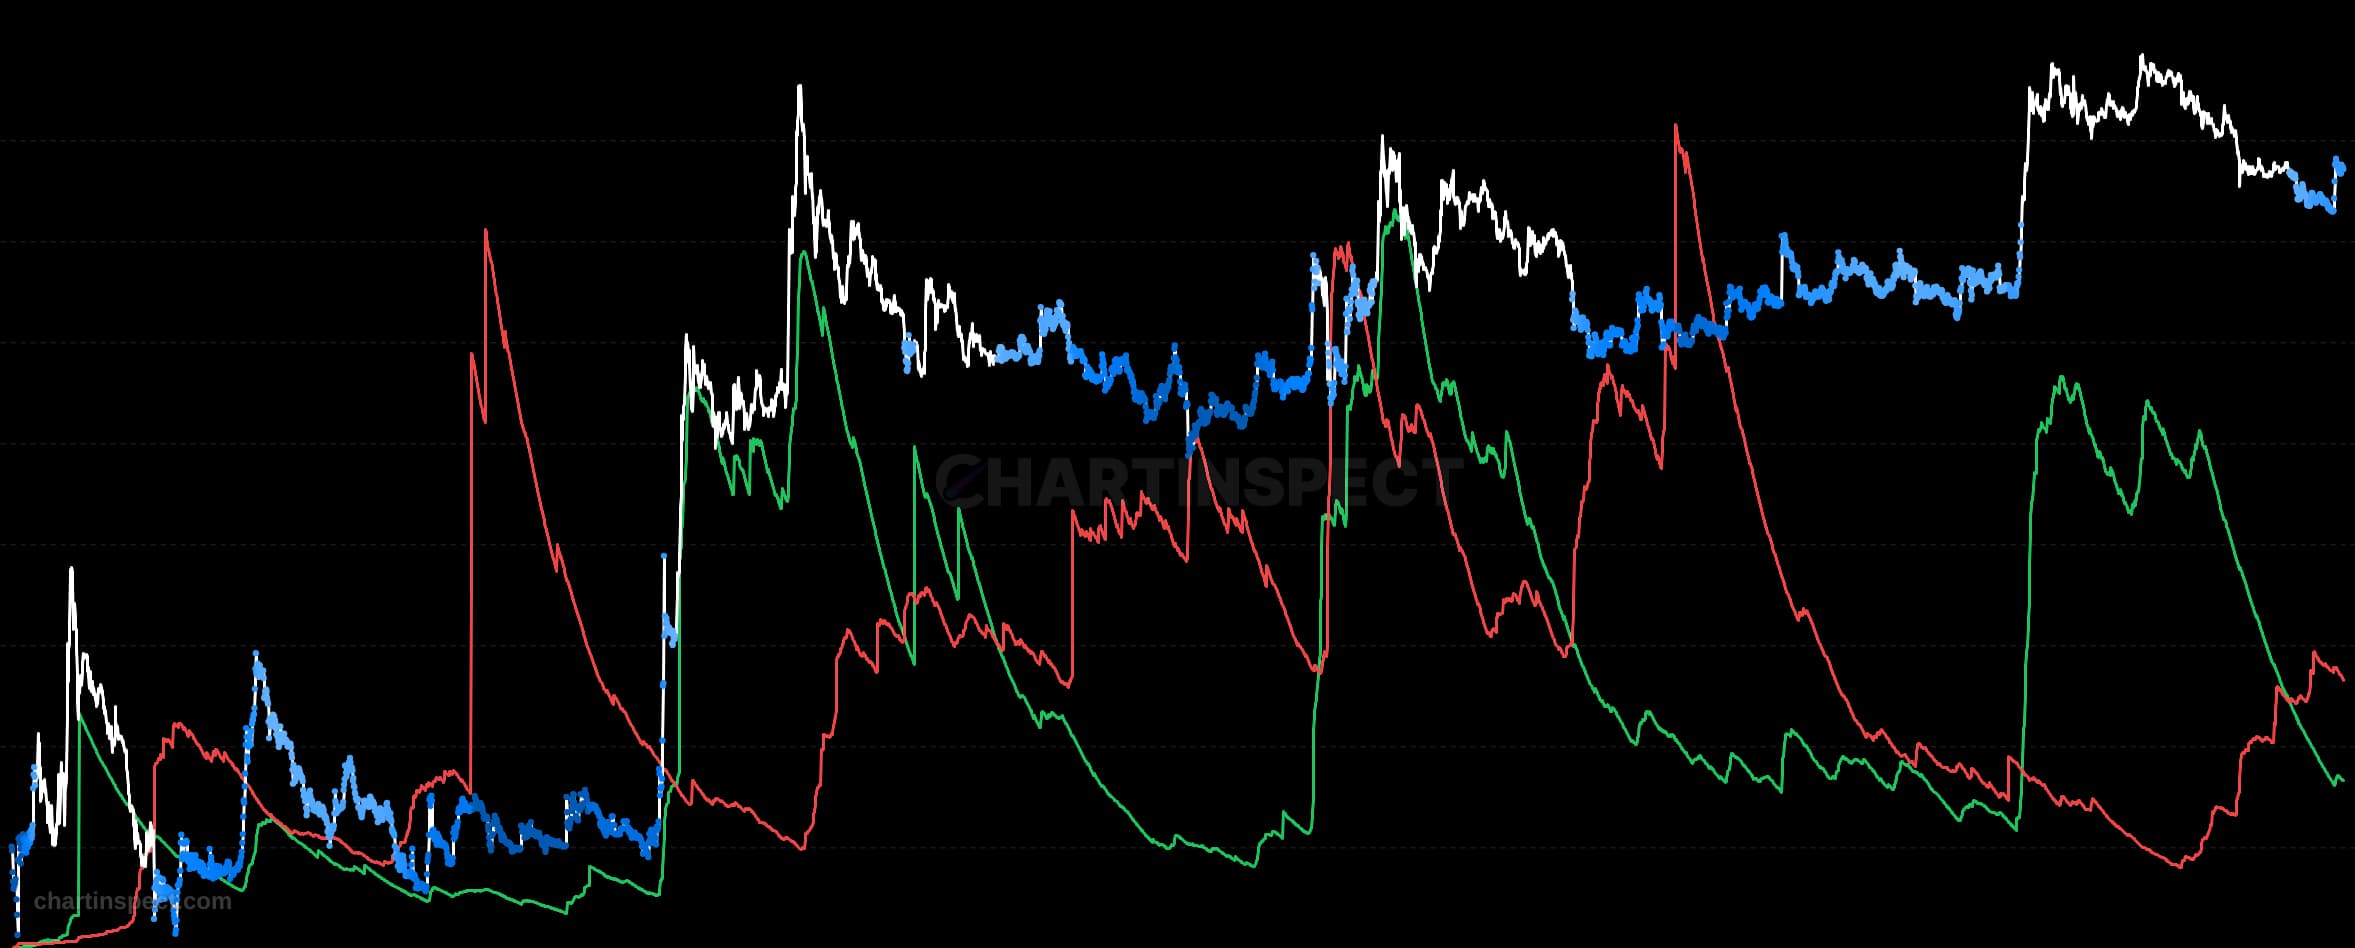
Track Realized Profit and Loss showing profits and losses as separate bars when XRP UTXOs are spent. Displays the total magnitude of profit-taking (green bars) and loss-realization (red bars) independently, revealing the volume and scale of market activity in each direction. Unlike Net Realized P/L which shows the difference, this chart displays both values separately - useful for seeing when high profits and losses occur simultaneously (mixed sentiment) or when one dominates (clear conviction). Each spent coin is valued against its cost basis (price when last moved). Toggle between USD and XRP denominations to analyze profit-taking patterns during different market phases.
Freshness: Not yet verified
Community snapshot
No community calls on XRP Realized P&L yet. Be the first to share a take.























Related Analytics
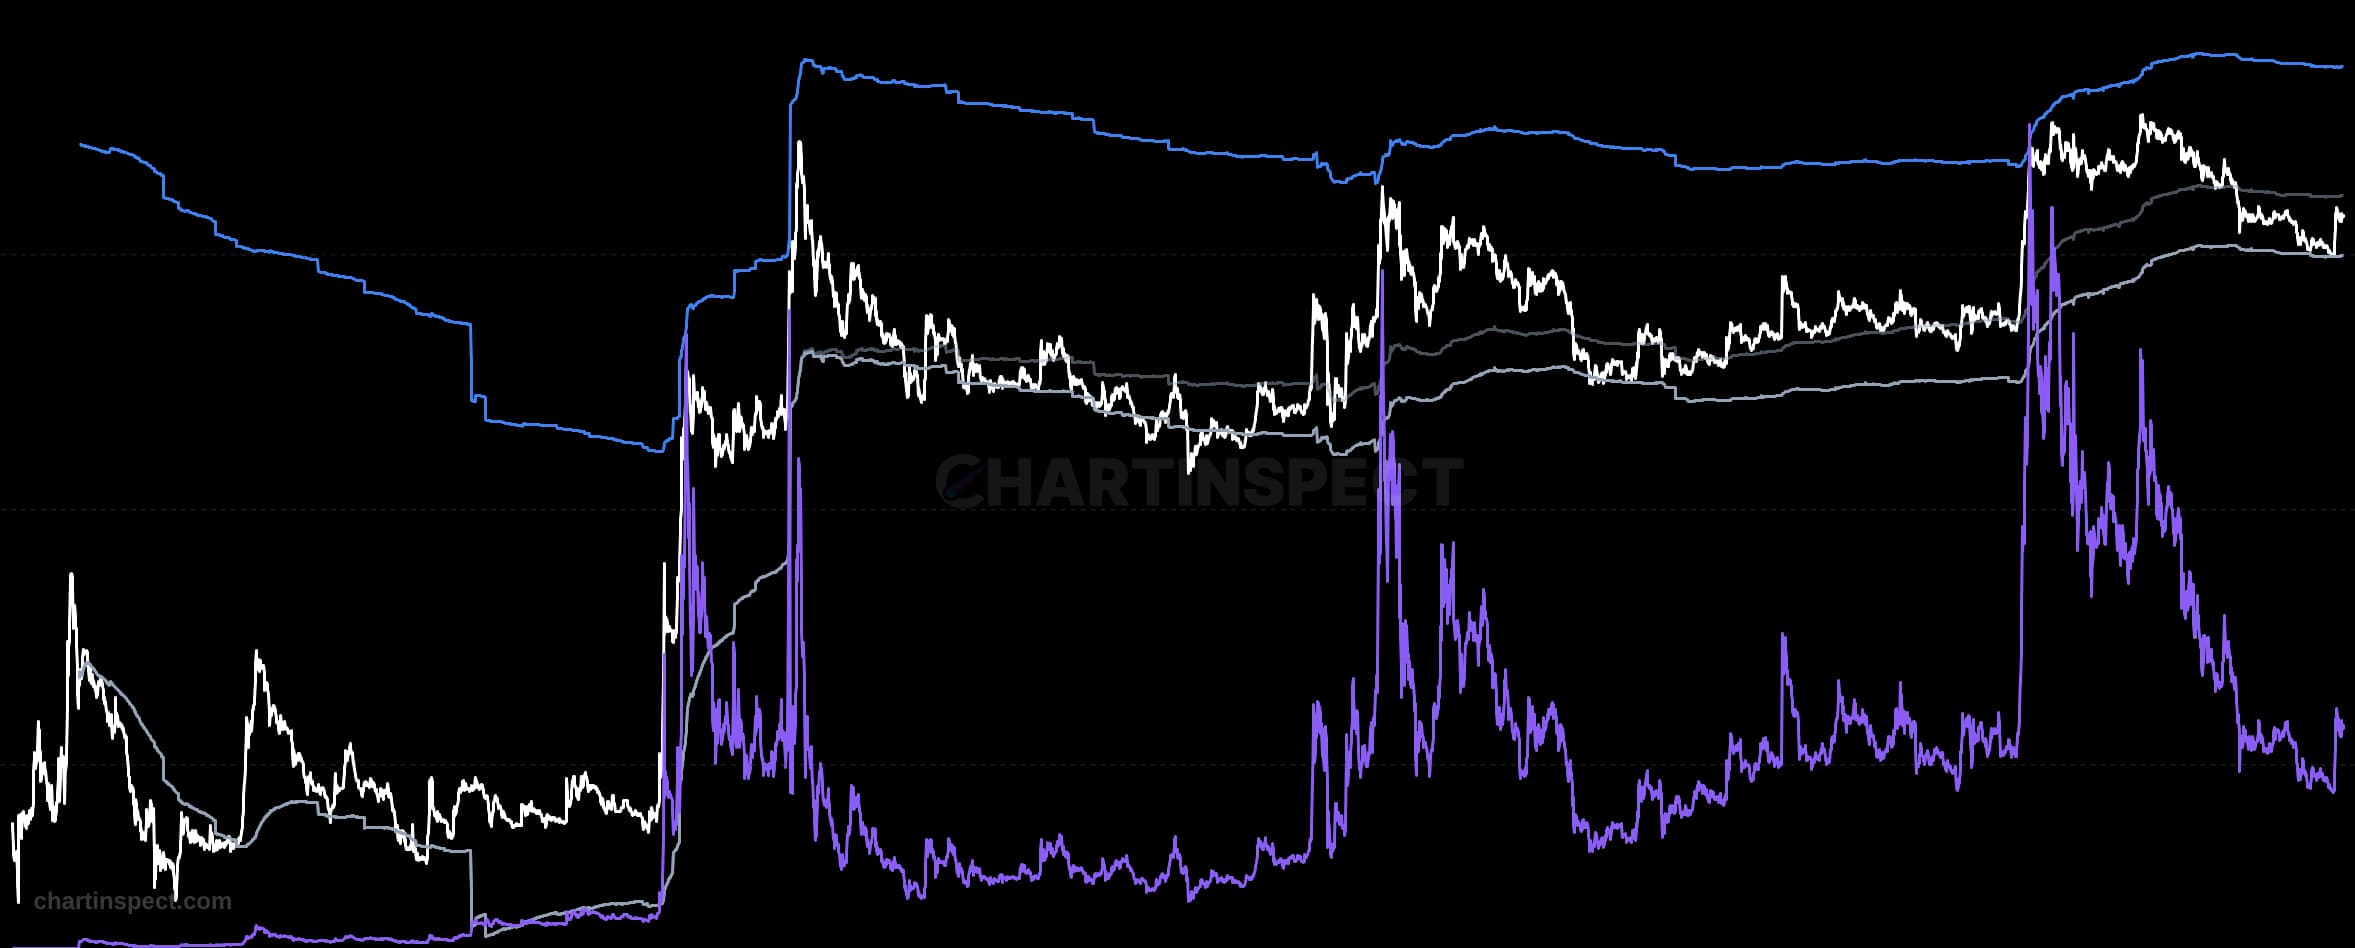
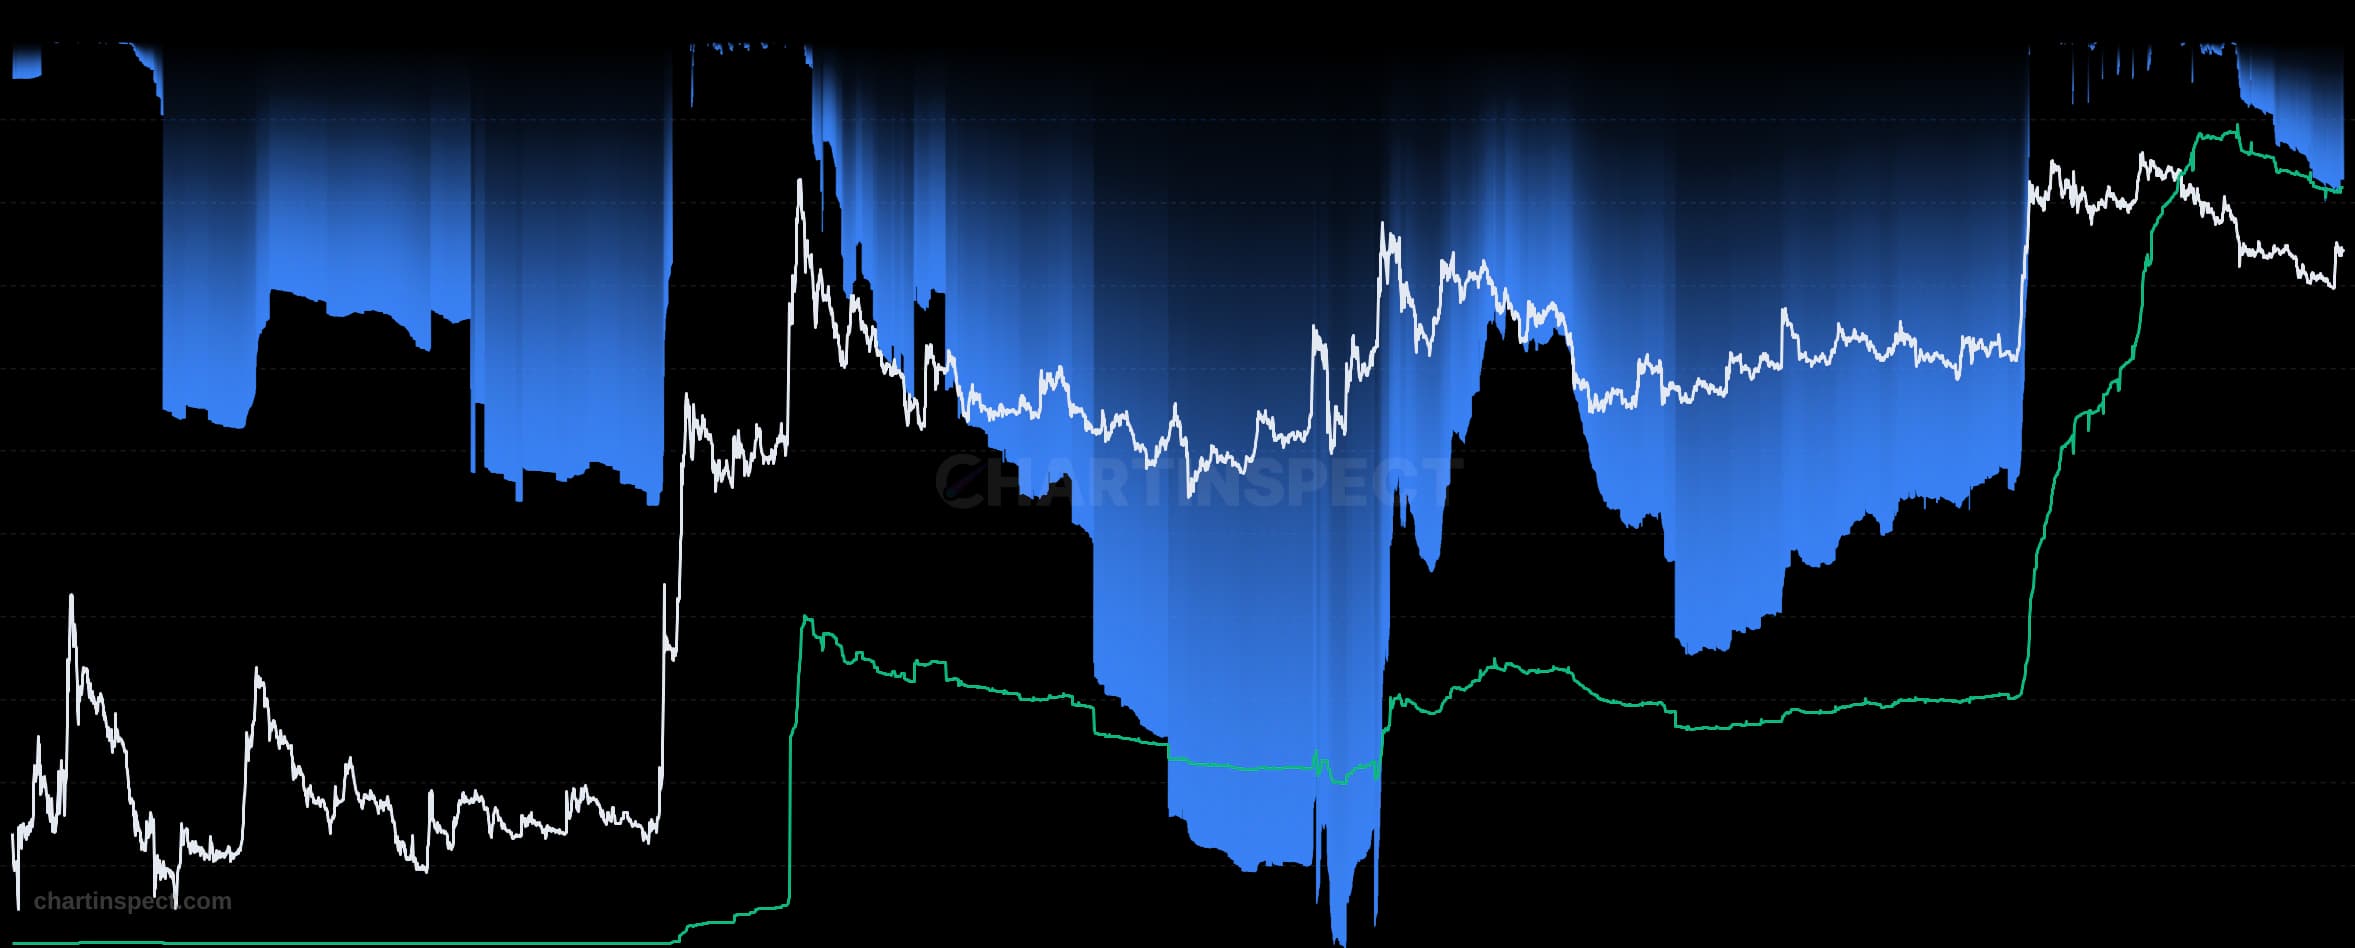
Discover more insights with our comprehensive chart collection
Explore All 9143 Charts