Loading chart data
Loading chart data
About Stock-to-Flow
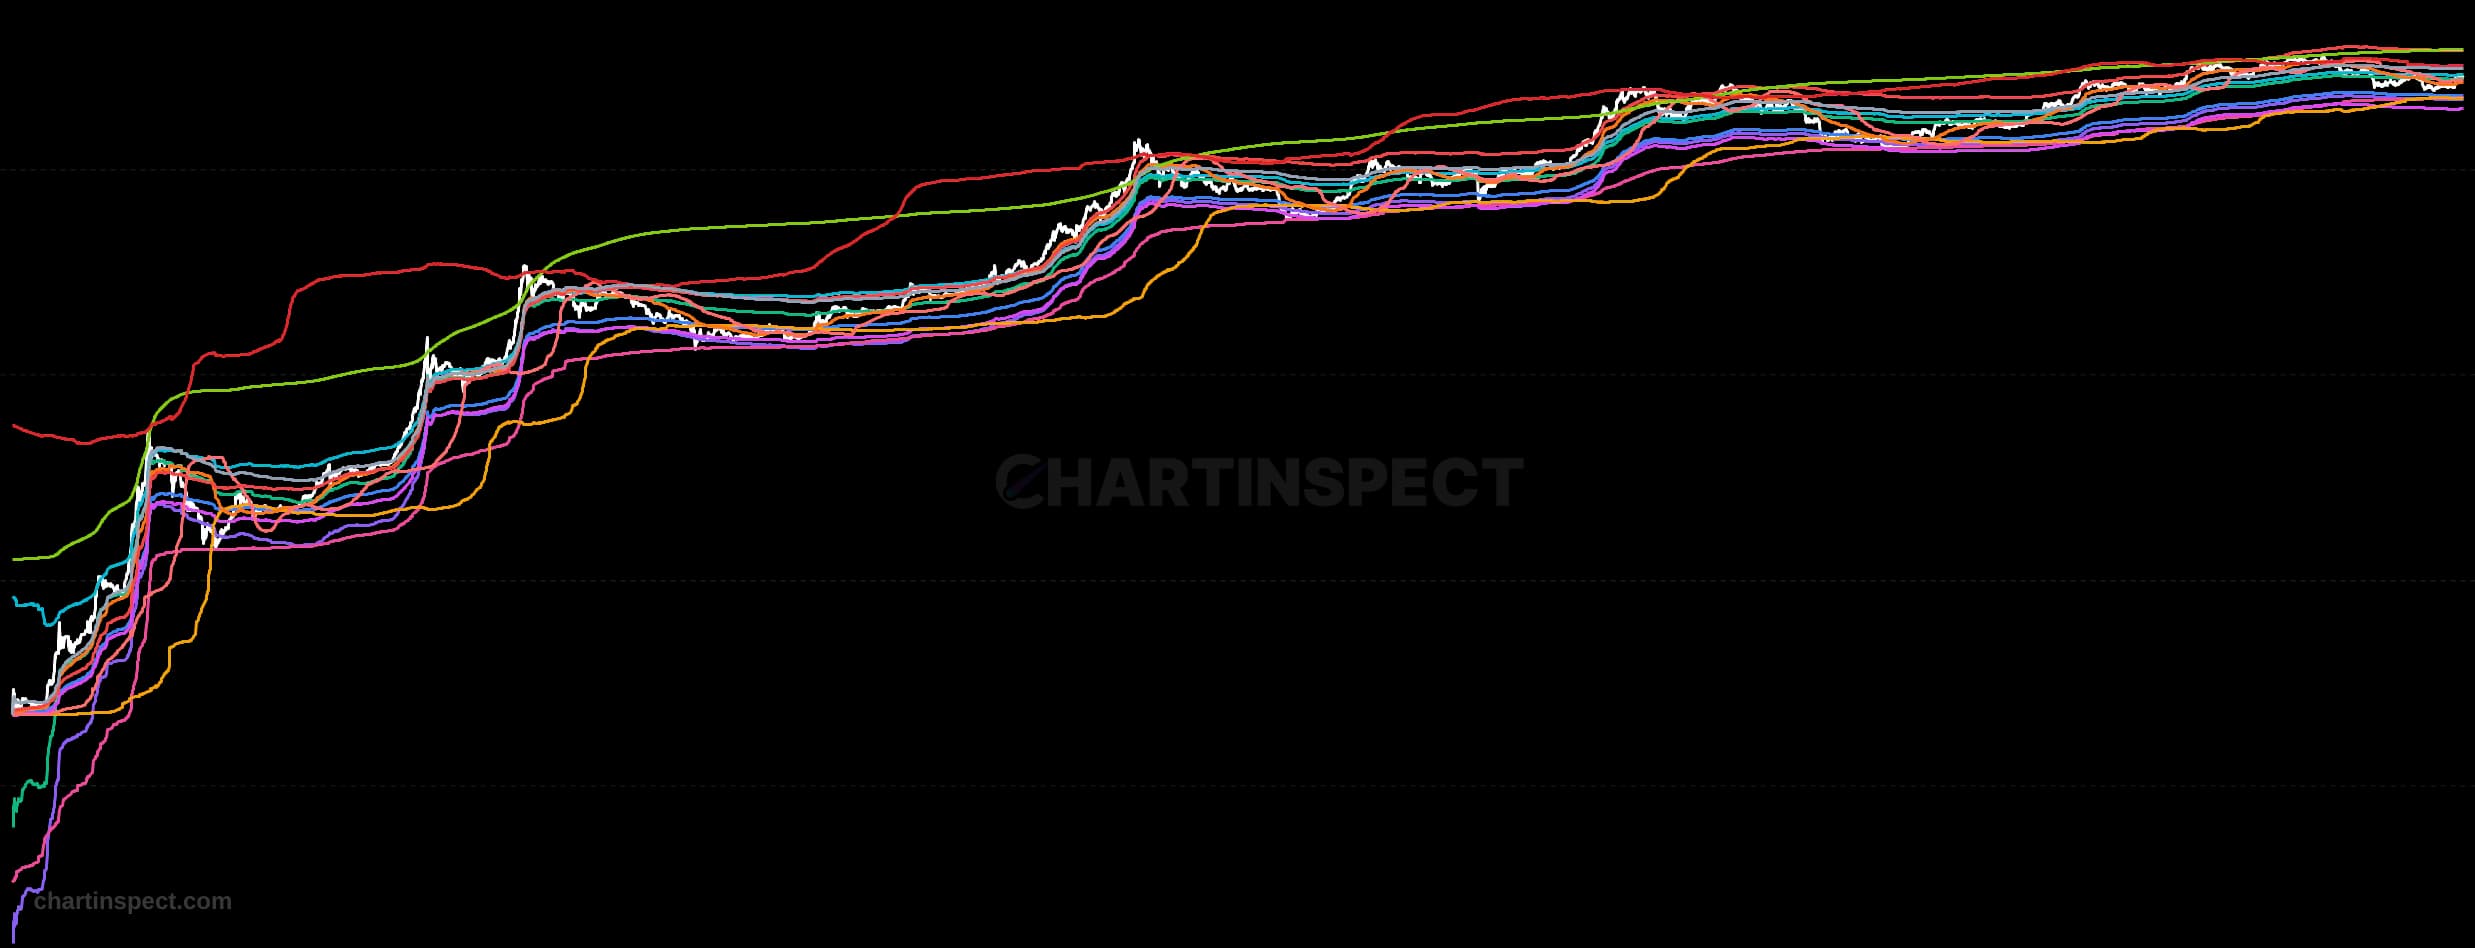
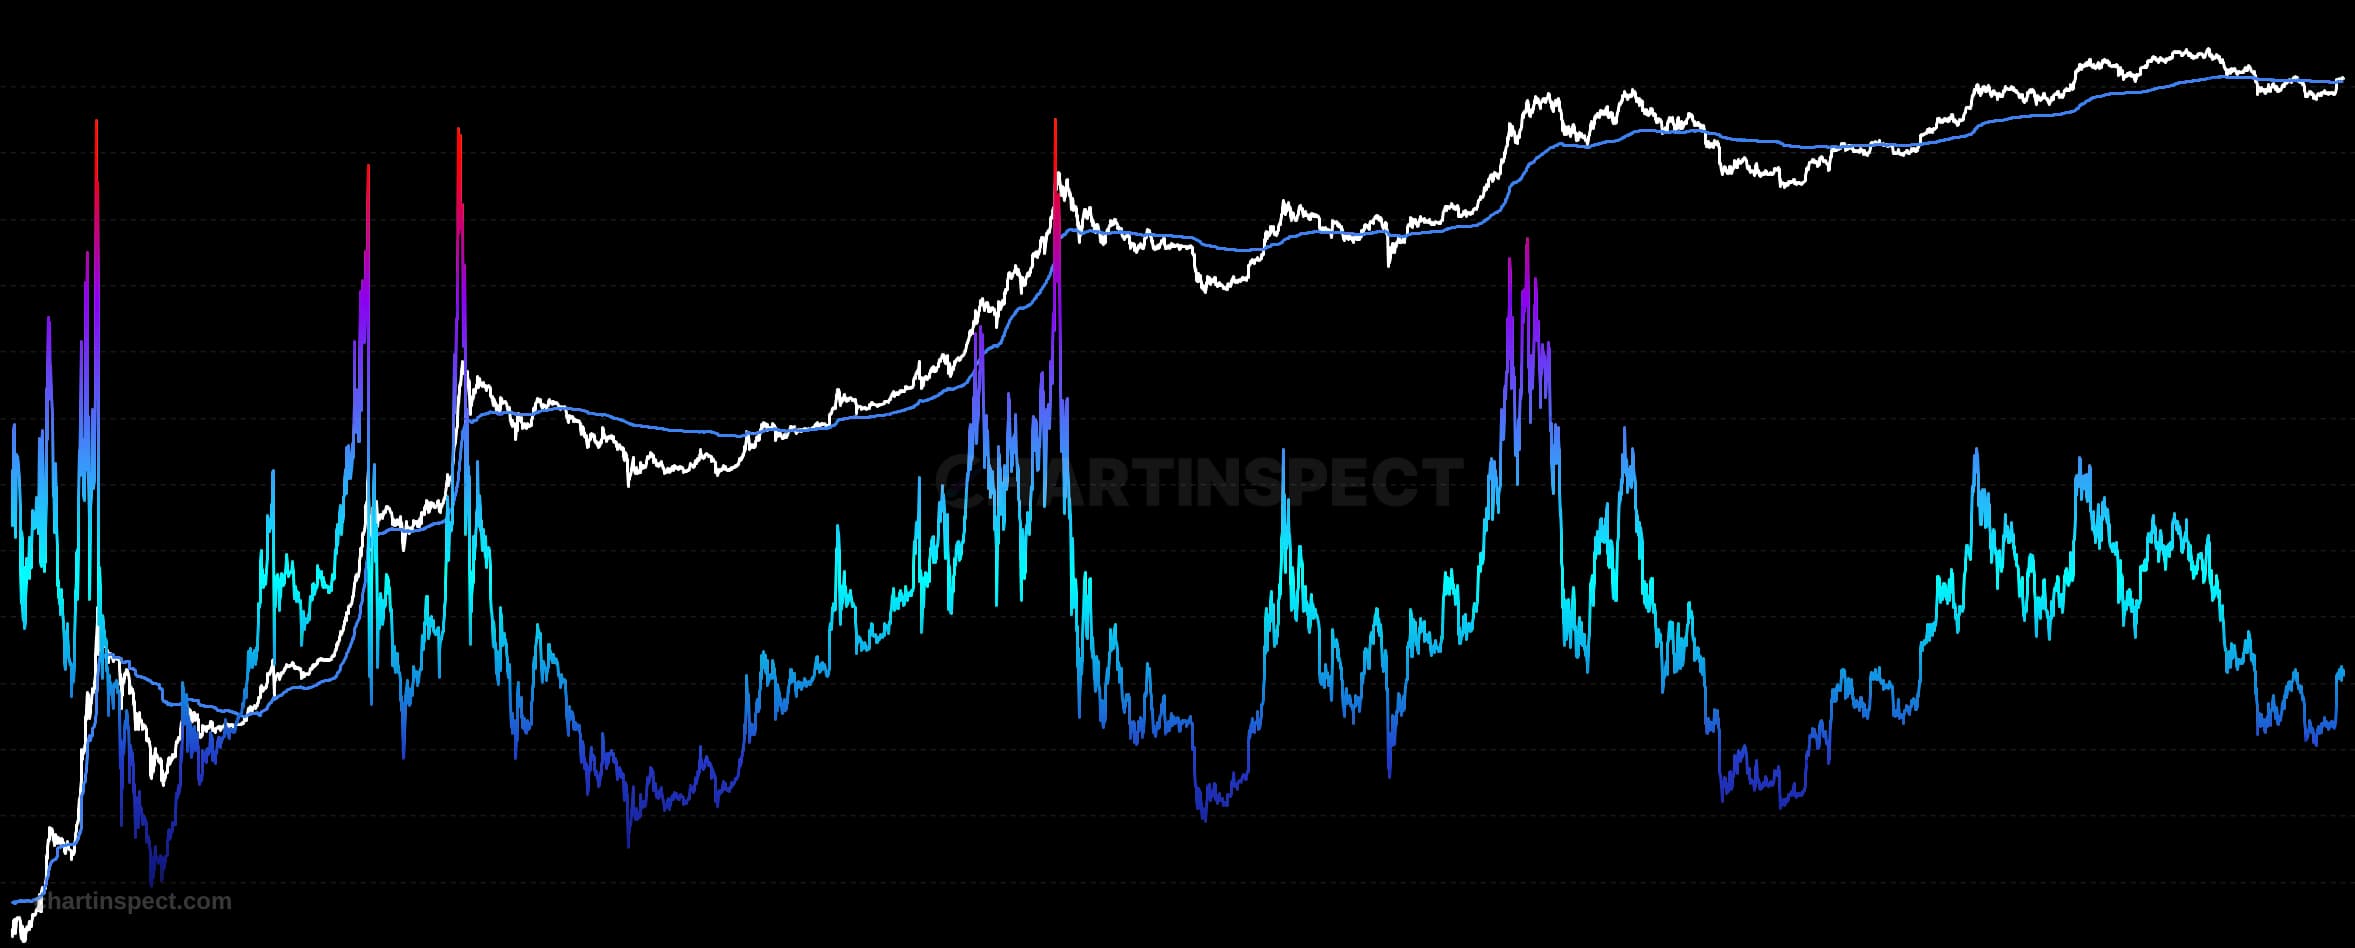
PlanB's scarcity model: existing supply divided by annual issuance, regressed against price on a log-log basis. Shows a live data-fitted model line and the famous original 2019 PlanB coefficients, with price dots colored by days until the next halving.
Freshness: Not yet verified
Community snapshot
No community calls on Stock-to-Flow yet. Be the first to share a take.
Related Analytics
Discover more insights with our comprehensive chart collection
Explore All 9143 Charts