Loading chart data
Loading chart data
About S&P 500 ATR Percent
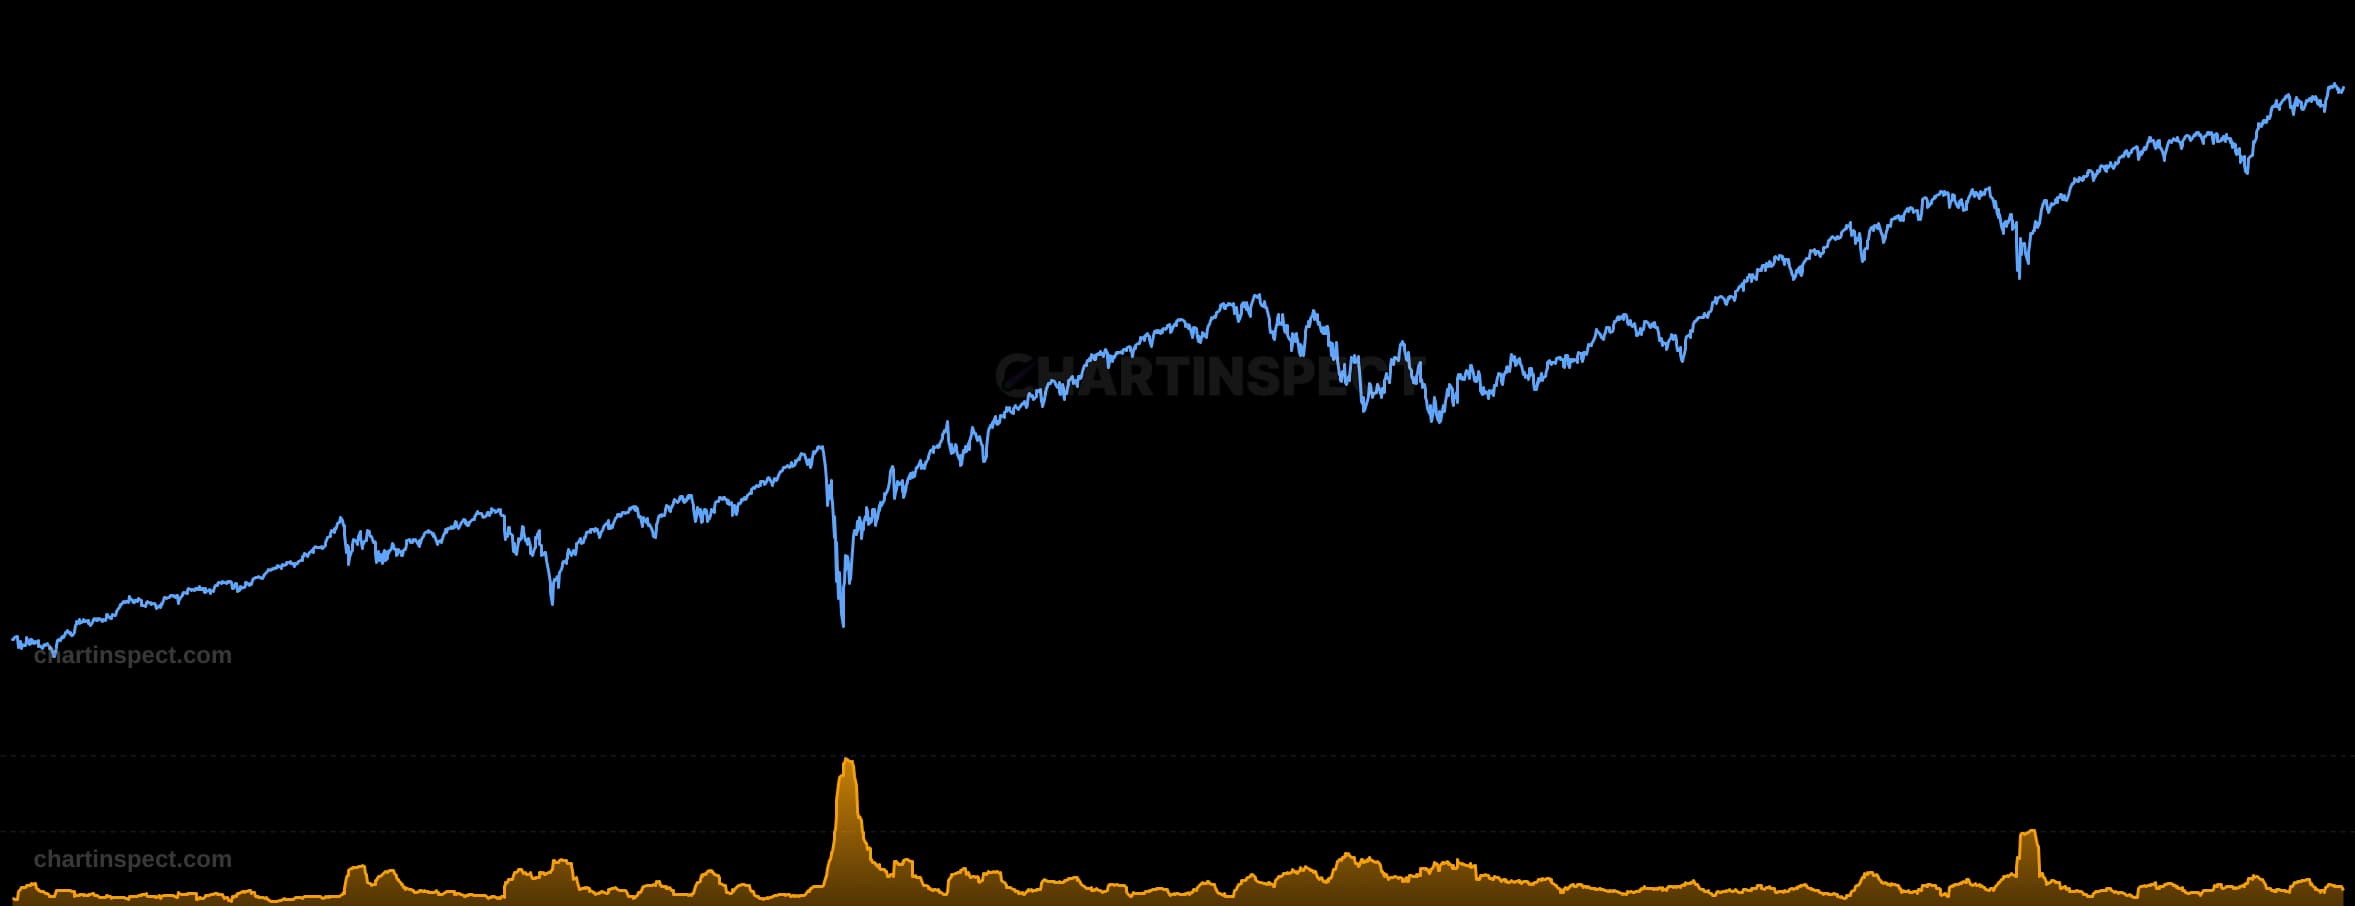
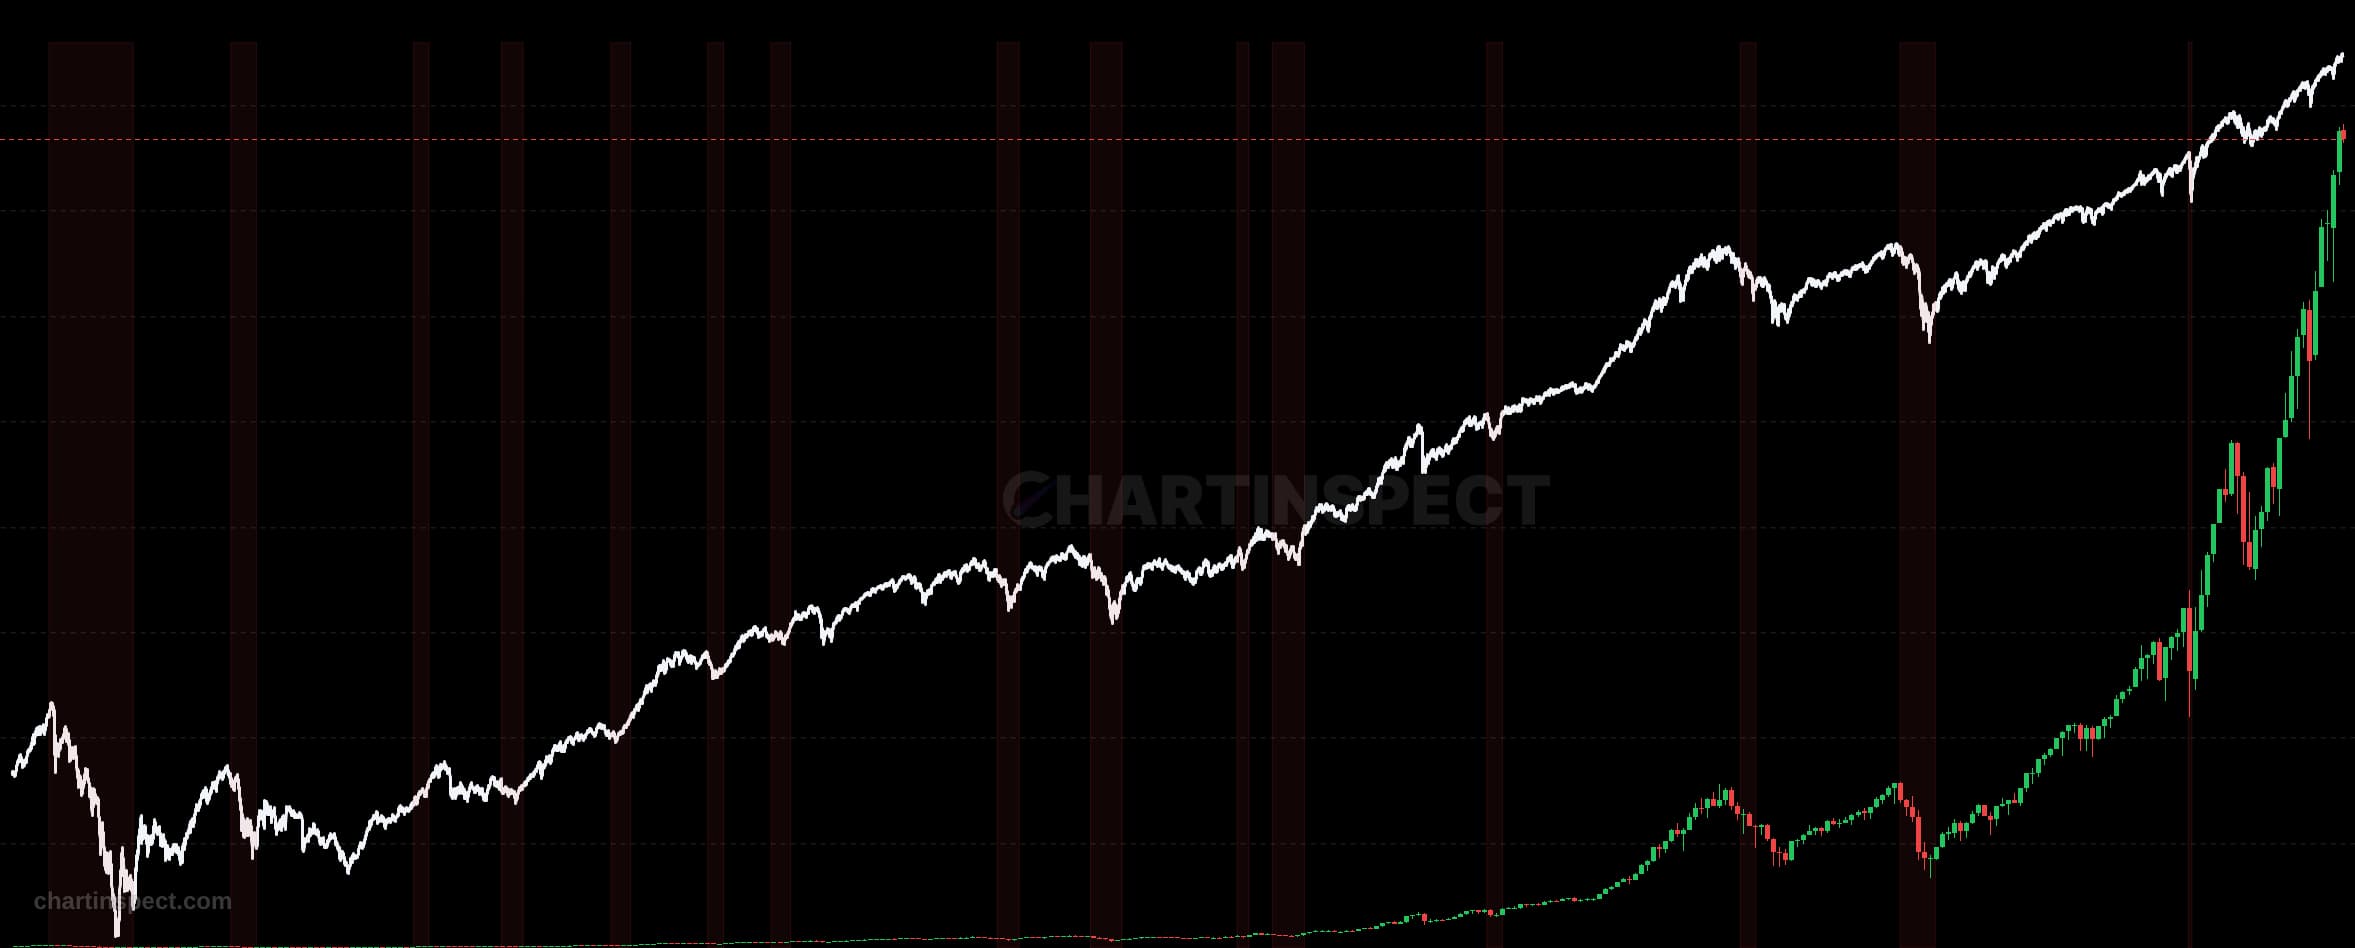
S&P 500 price with Wilder’s 14-session Average True Range divided by the closing price. Expressing ATR as a percentage makes the size of typical daily movement comparable across different index levels and decades.
Freshness: Not yet verified
Community snapshot
No community calls on S&P 500 ATR Percent yet. Be the first to share a take.
Related Analytics

Discover more insights with our comprehensive chart collection
Explore All 9143 Charts