Loading chart data
Smoothing
Loading chart data
About Solana ETF Flows
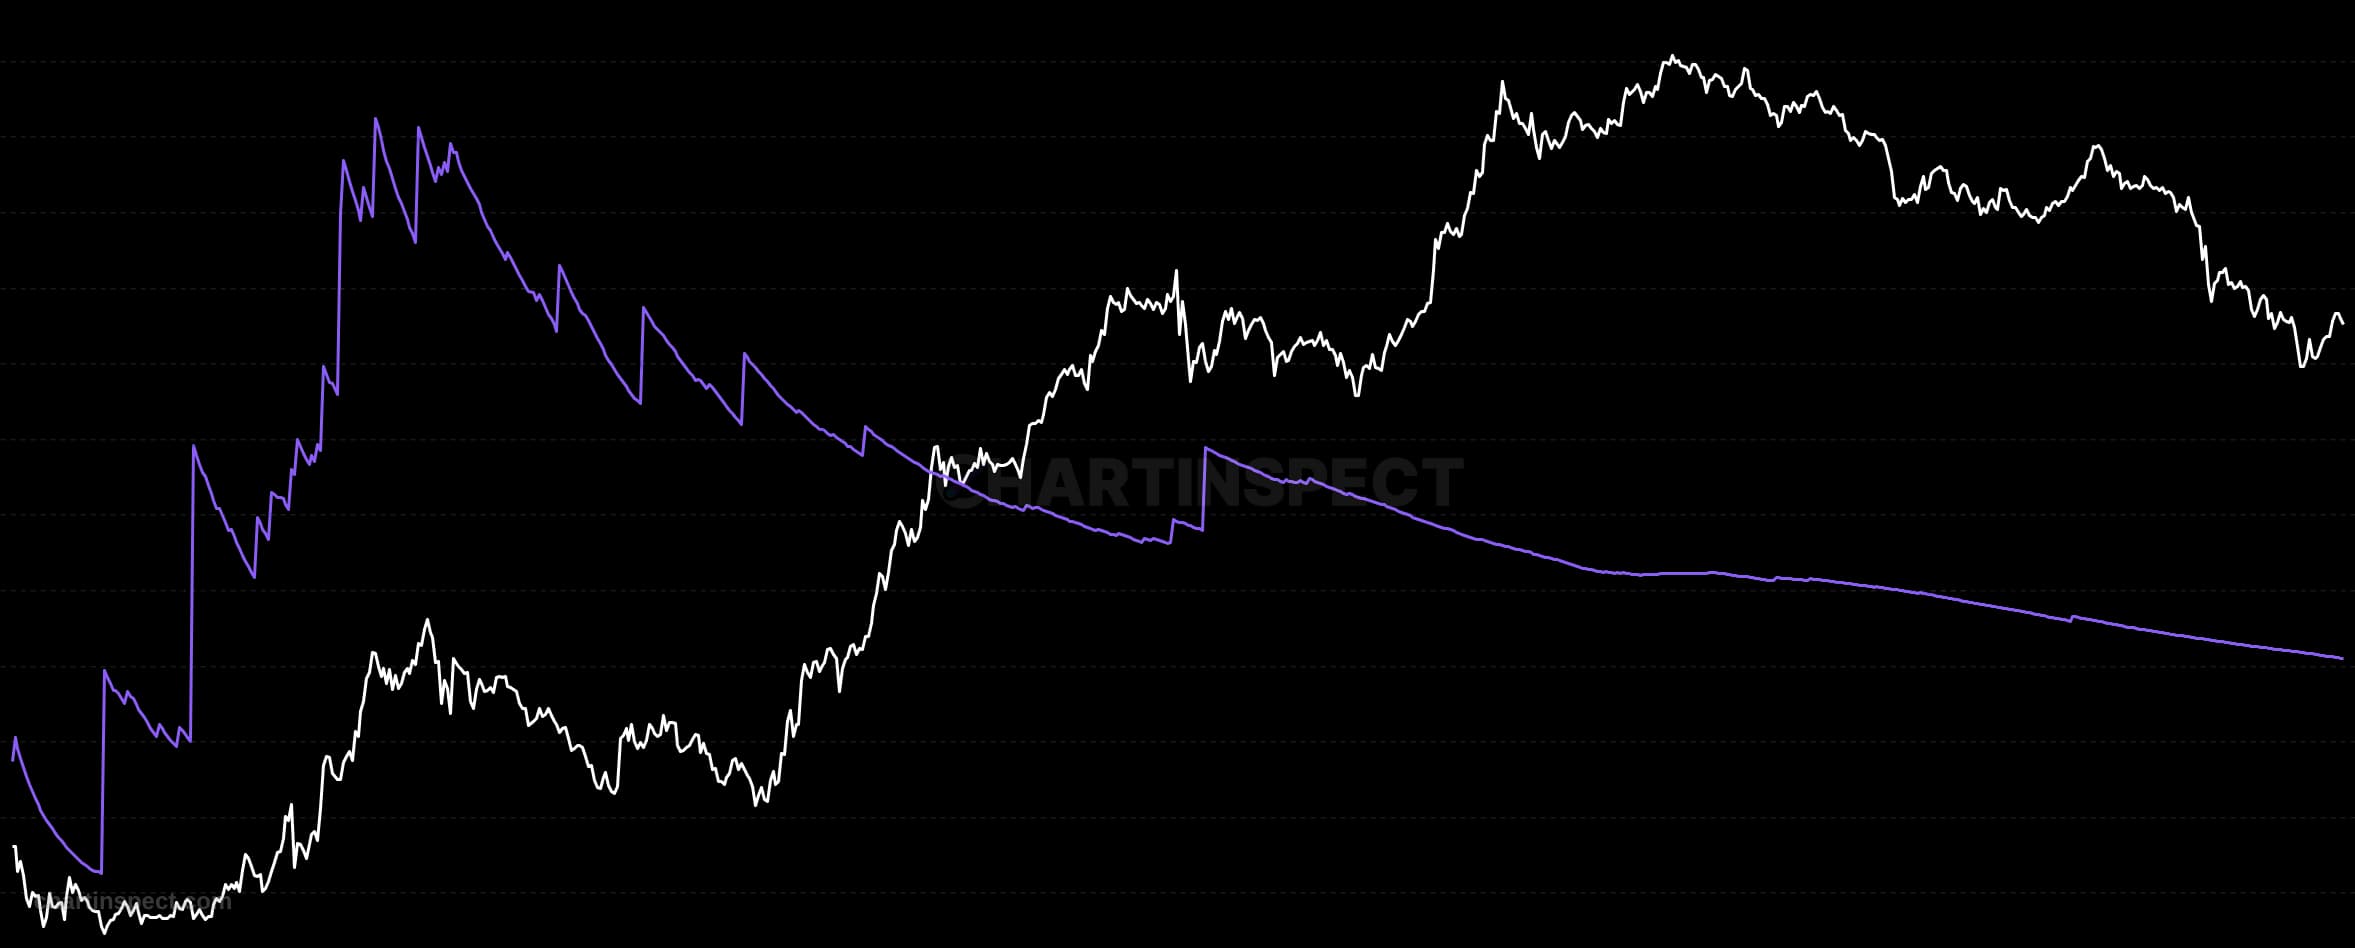
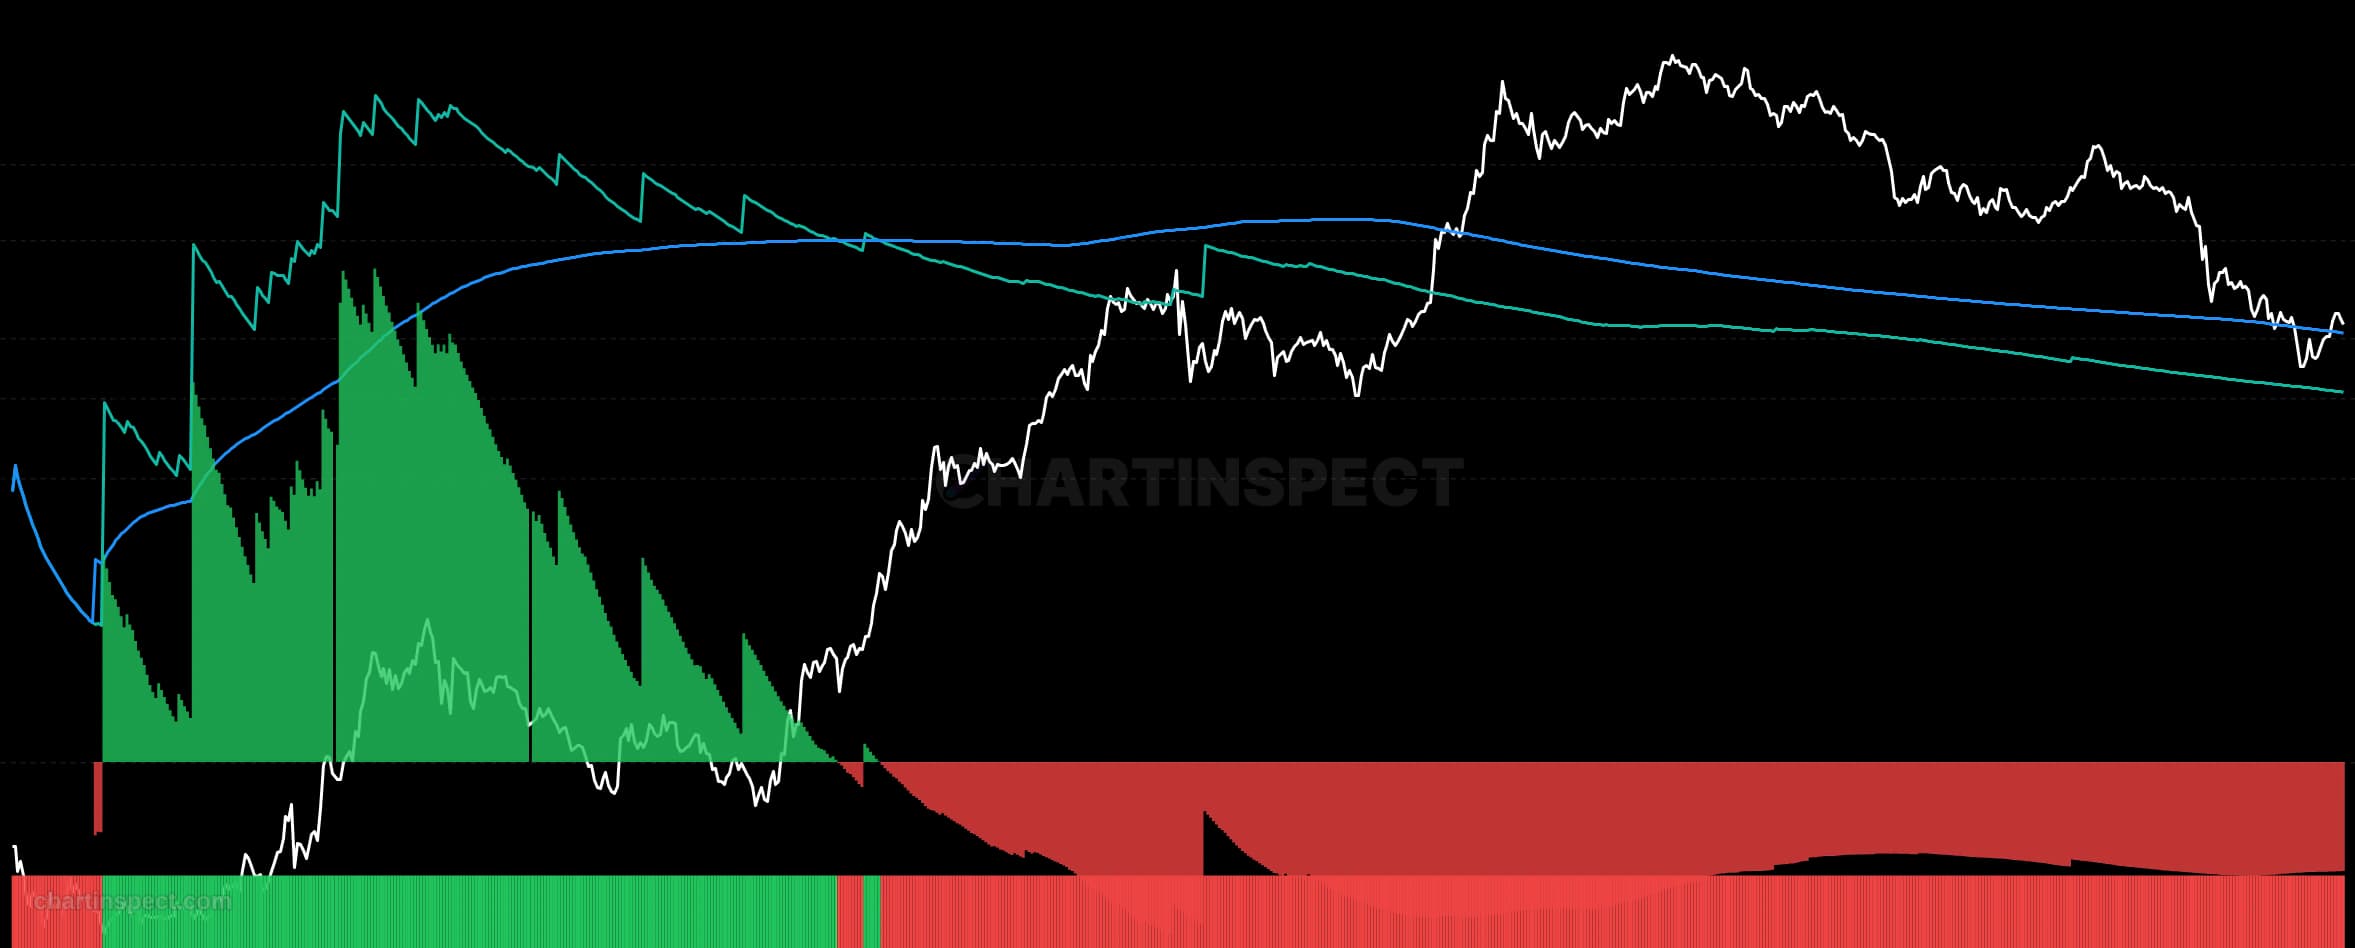
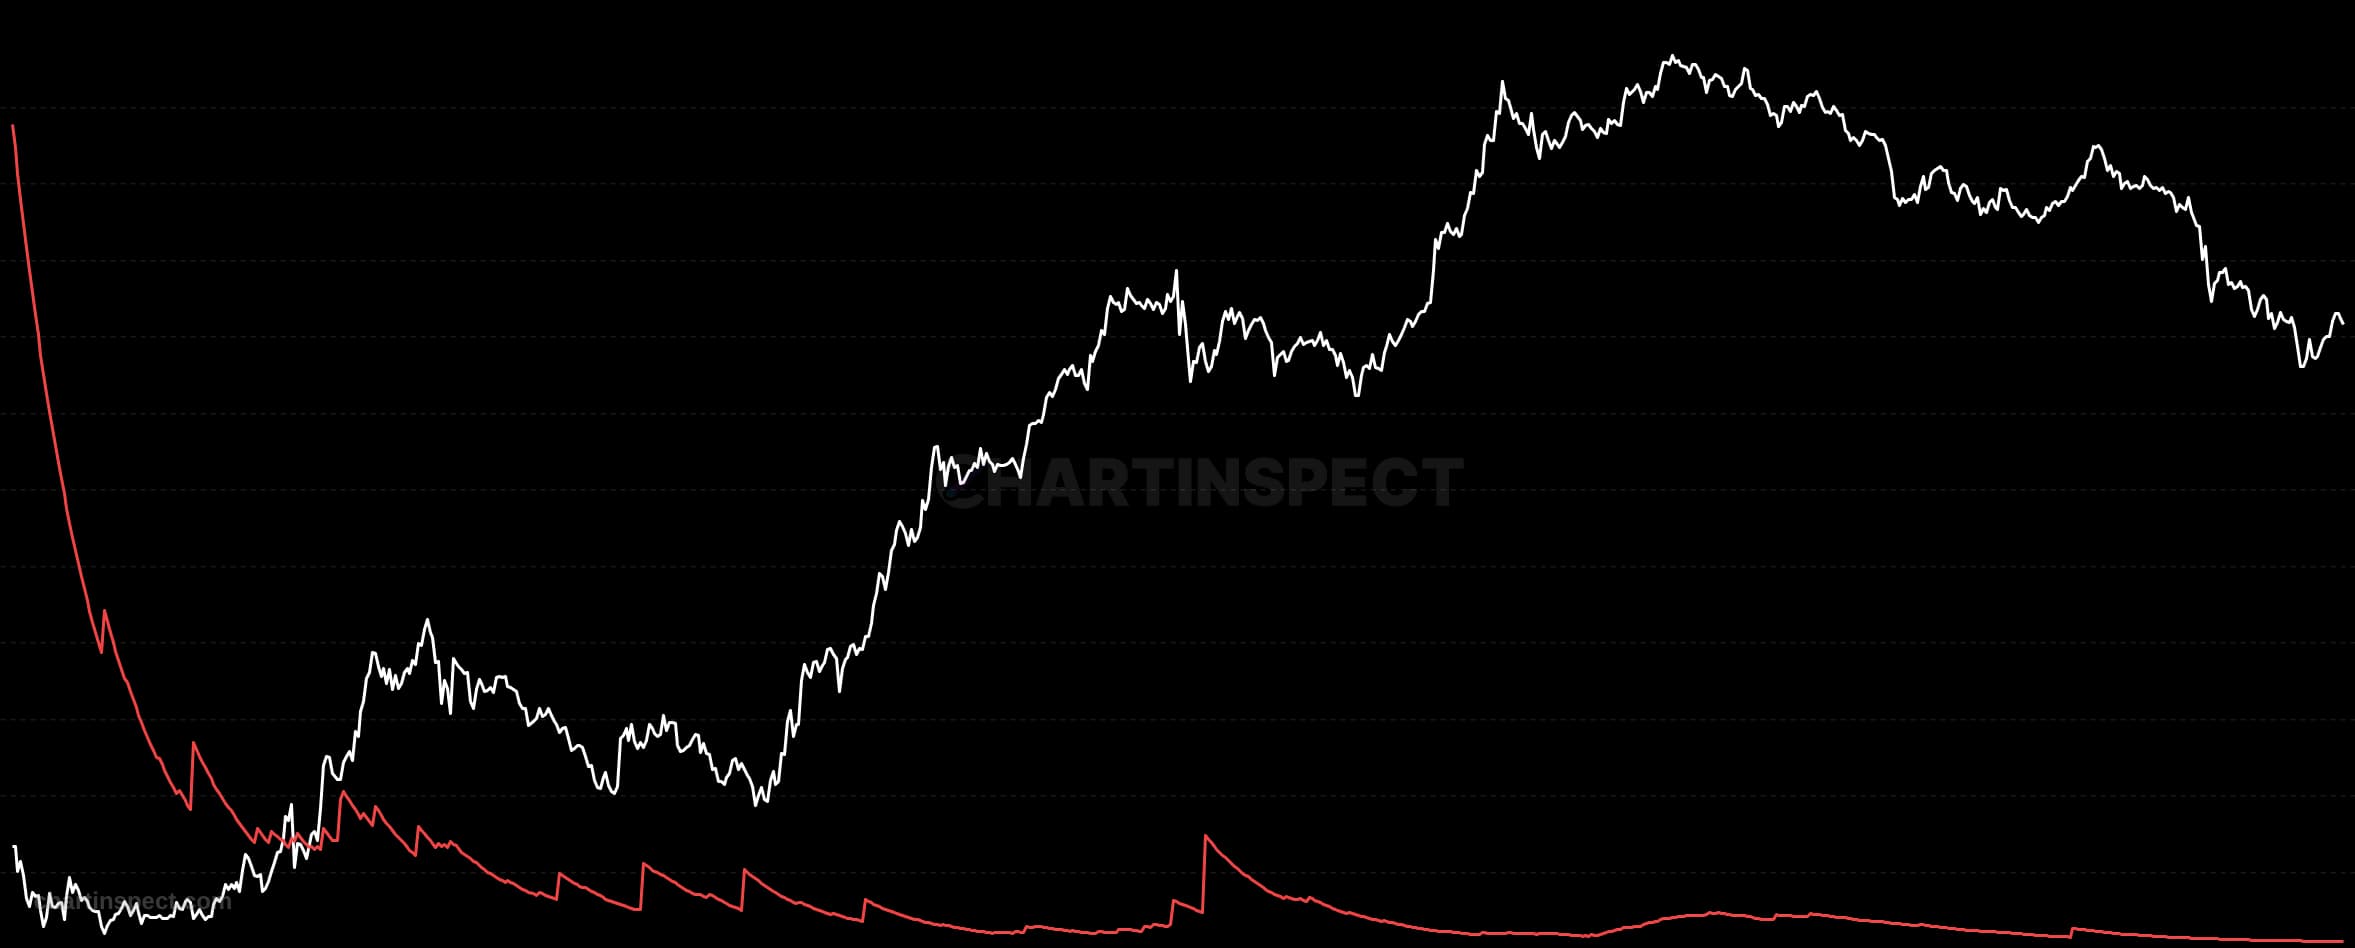
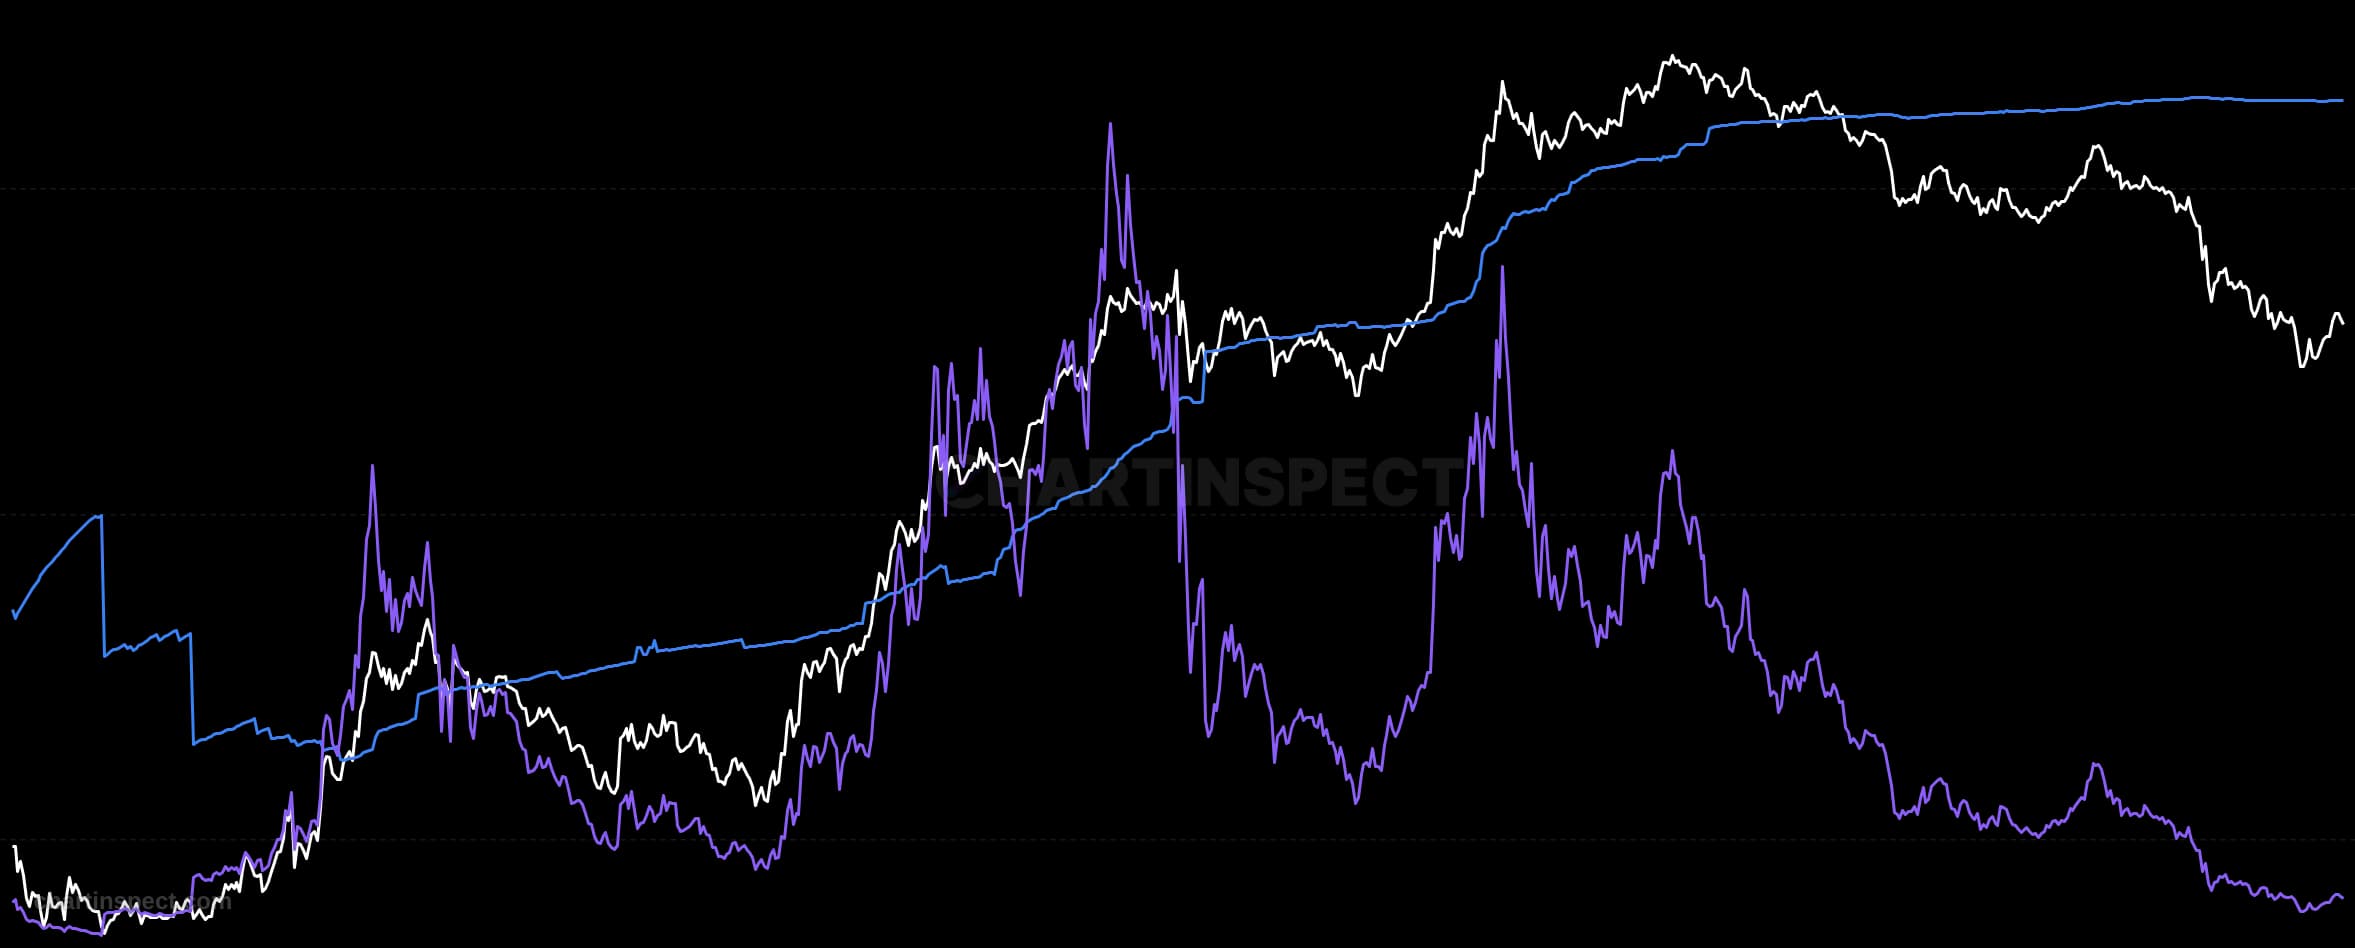
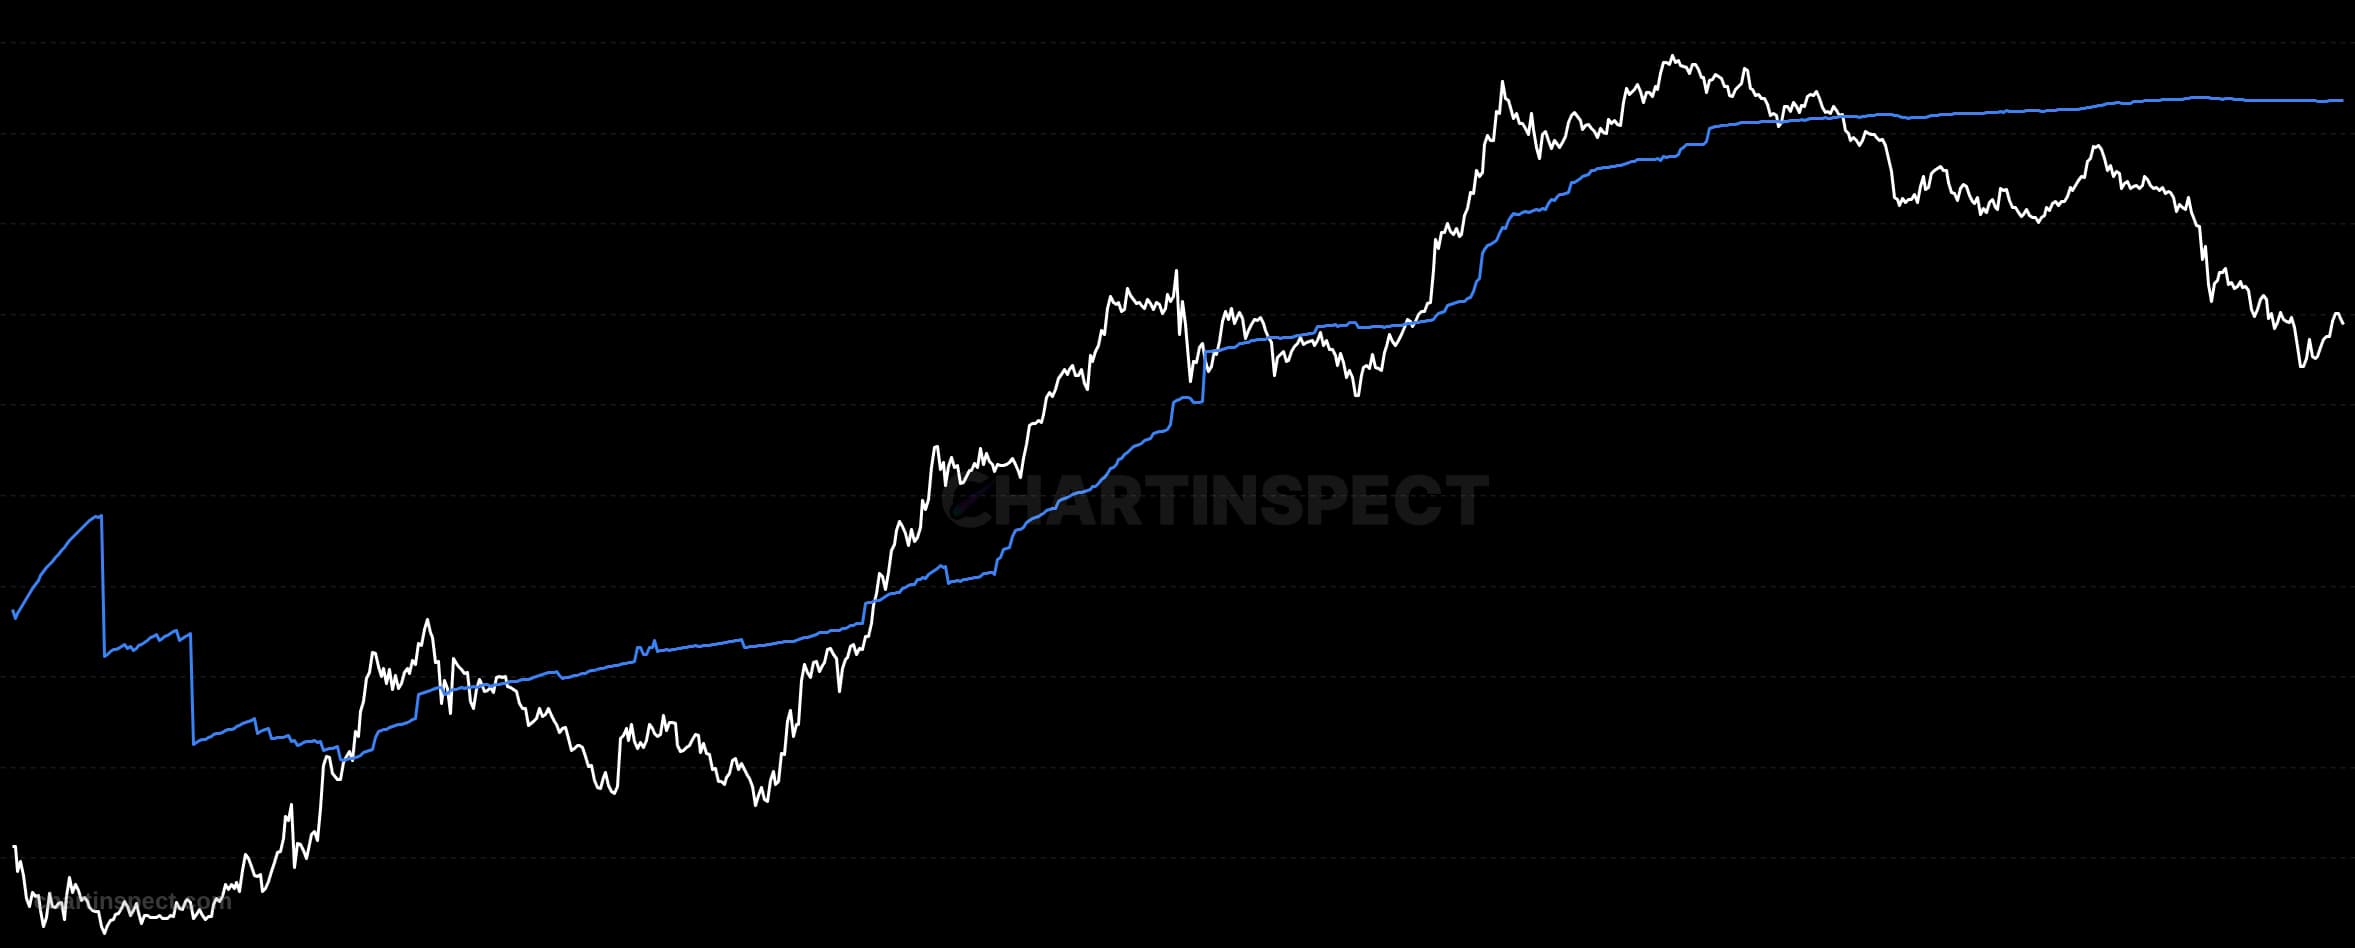
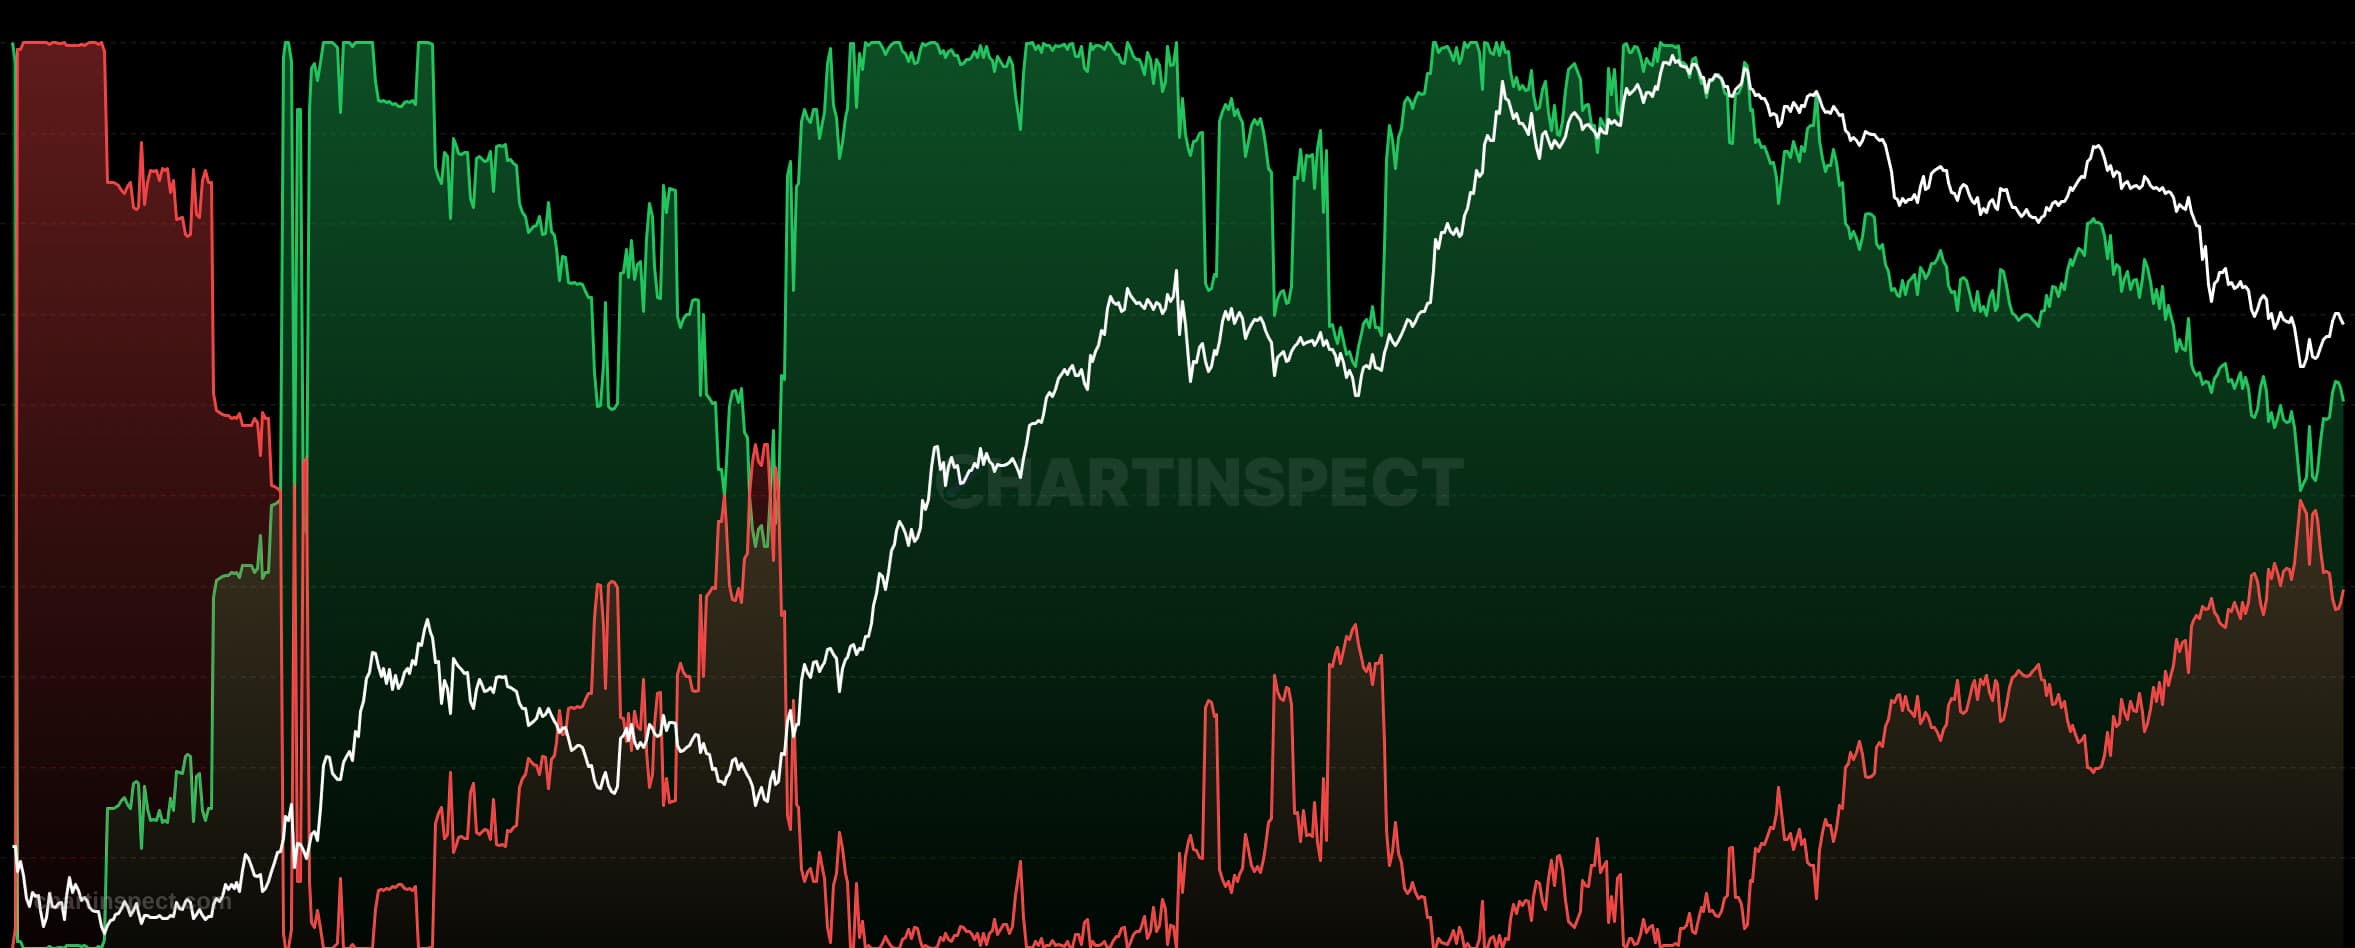
Daily net flows into and out of US spot Solana ETFs, aggregated across all issuers. Green bars are net inflows, red bars are net outflows, with the SOL price overlaid. A new ETF category launched in 2026.
Freshness: Not yet verified
Community snapshot
No community calls on Solana ETF Flows yet. Be the first to share a take.
Related Analytics
Discover more insights with our comprehensive chart collection
Explore All 9143 Charts