Loading chart data
Loading chart data
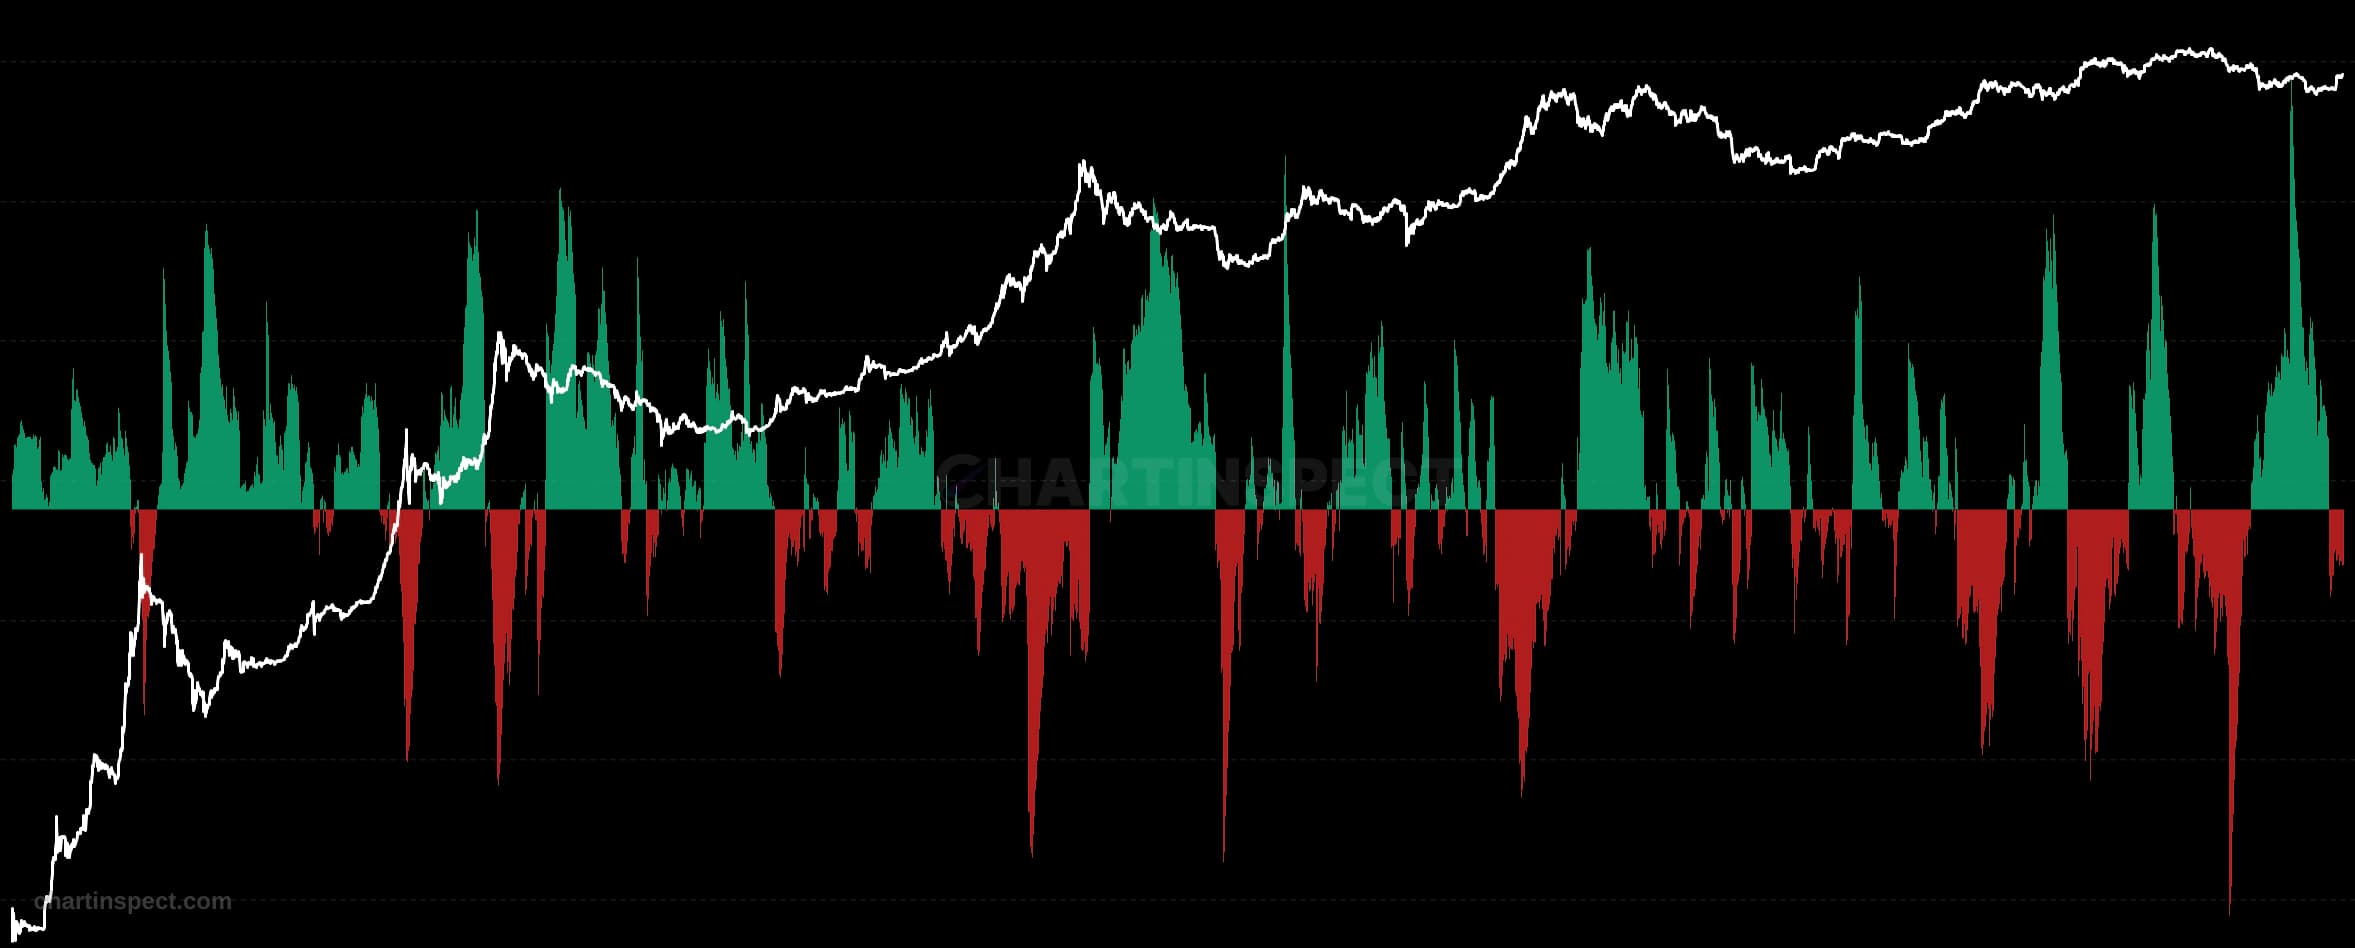
About LTH Distribution by Cycle Phase
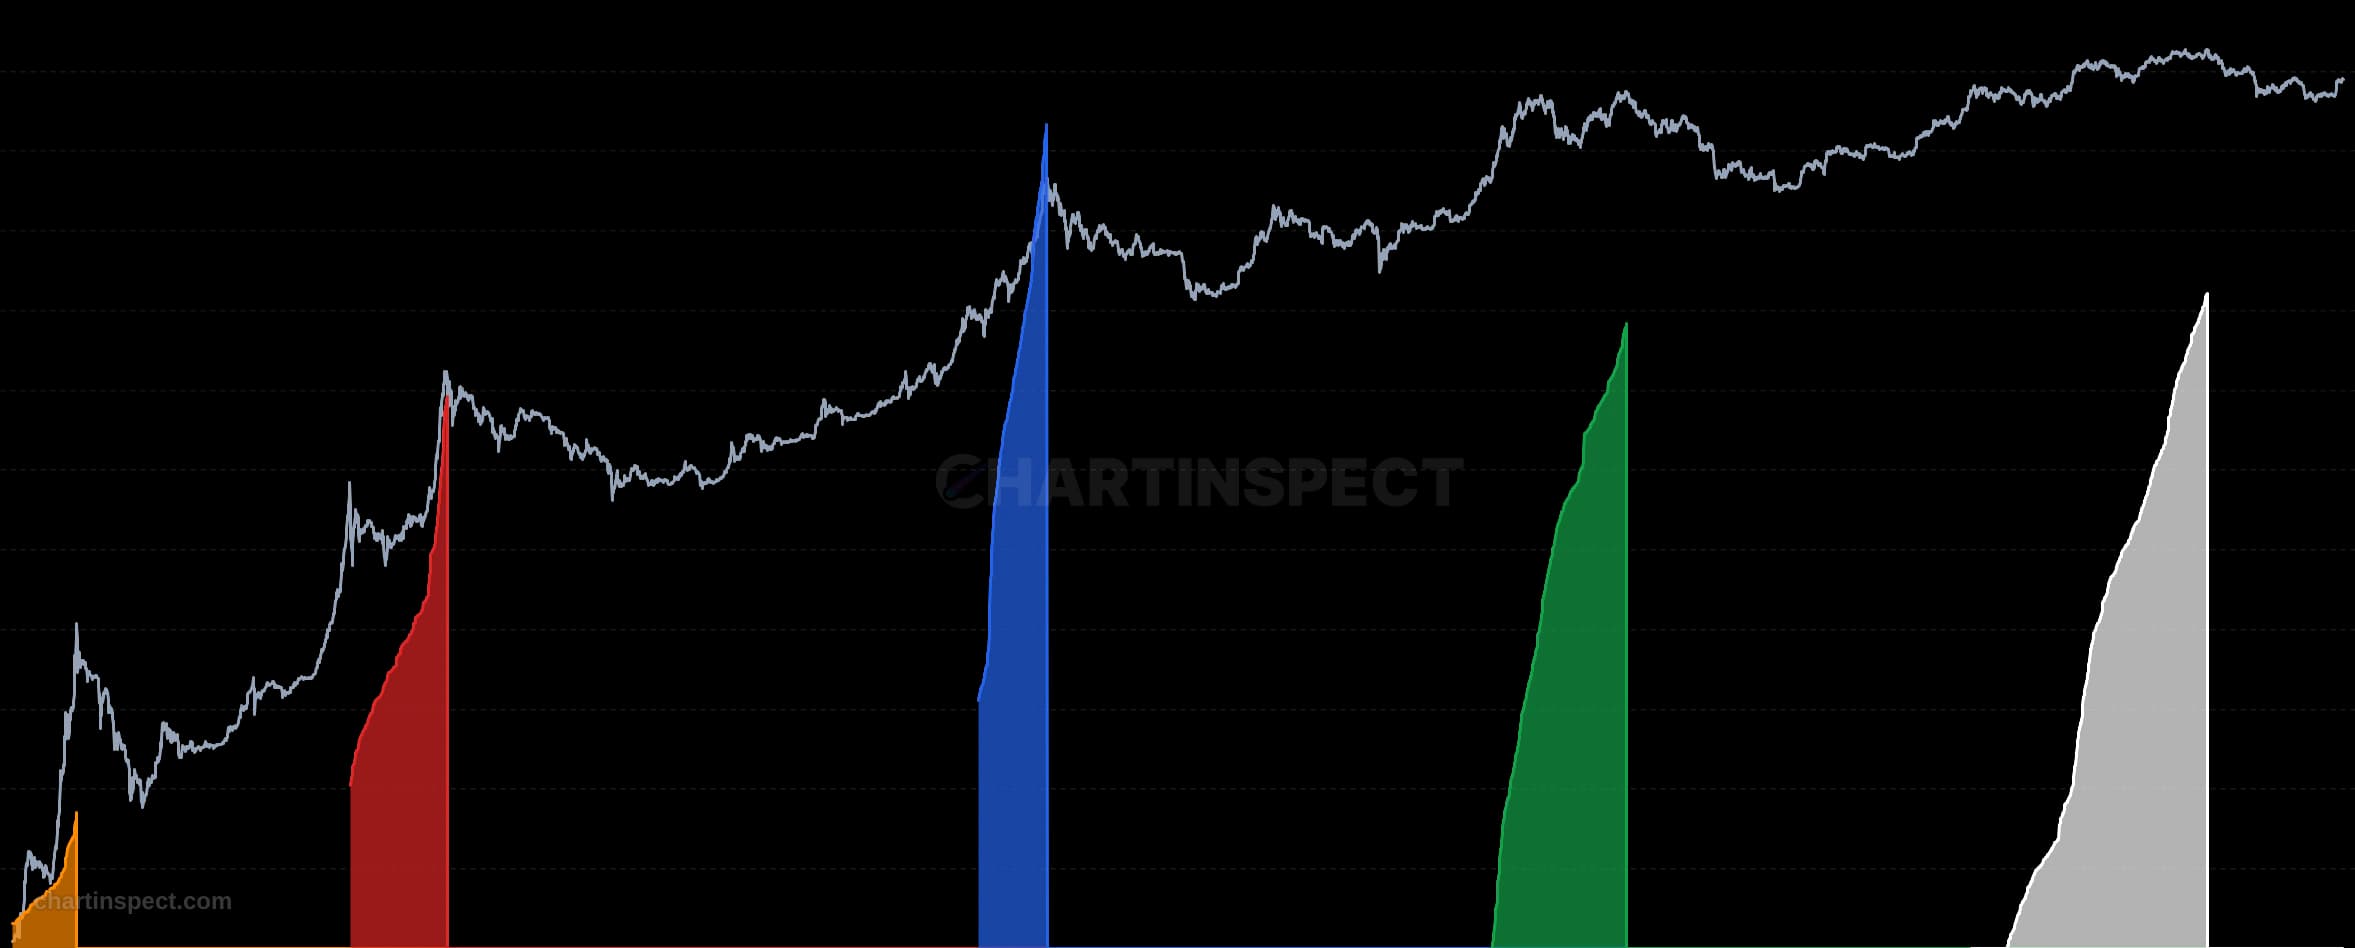
The share of circulating Bitcoin supply that Long-Term Holders have spent since the last cycle turn, counted from zero at every cycle bottom to the top and again from the top to the next bottom. Tops and bottoms come from price by rule, not by hand: the highest close in the two years after a halving, and the lowest close between tops. Every bull leg since 2018 ended near 38% of supply and every bear leg near 10%.
Freshness: Not yet verified
Community snapshot
No community calls on LTH Distribution by Cycle Phase yet. Be the first to share a take.
Related Analytics

Discover more insights with our comprehensive chart collection
Explore All 8809 Charts