Loading chart data
Chain
Scale
Smoothing
Loading chart data
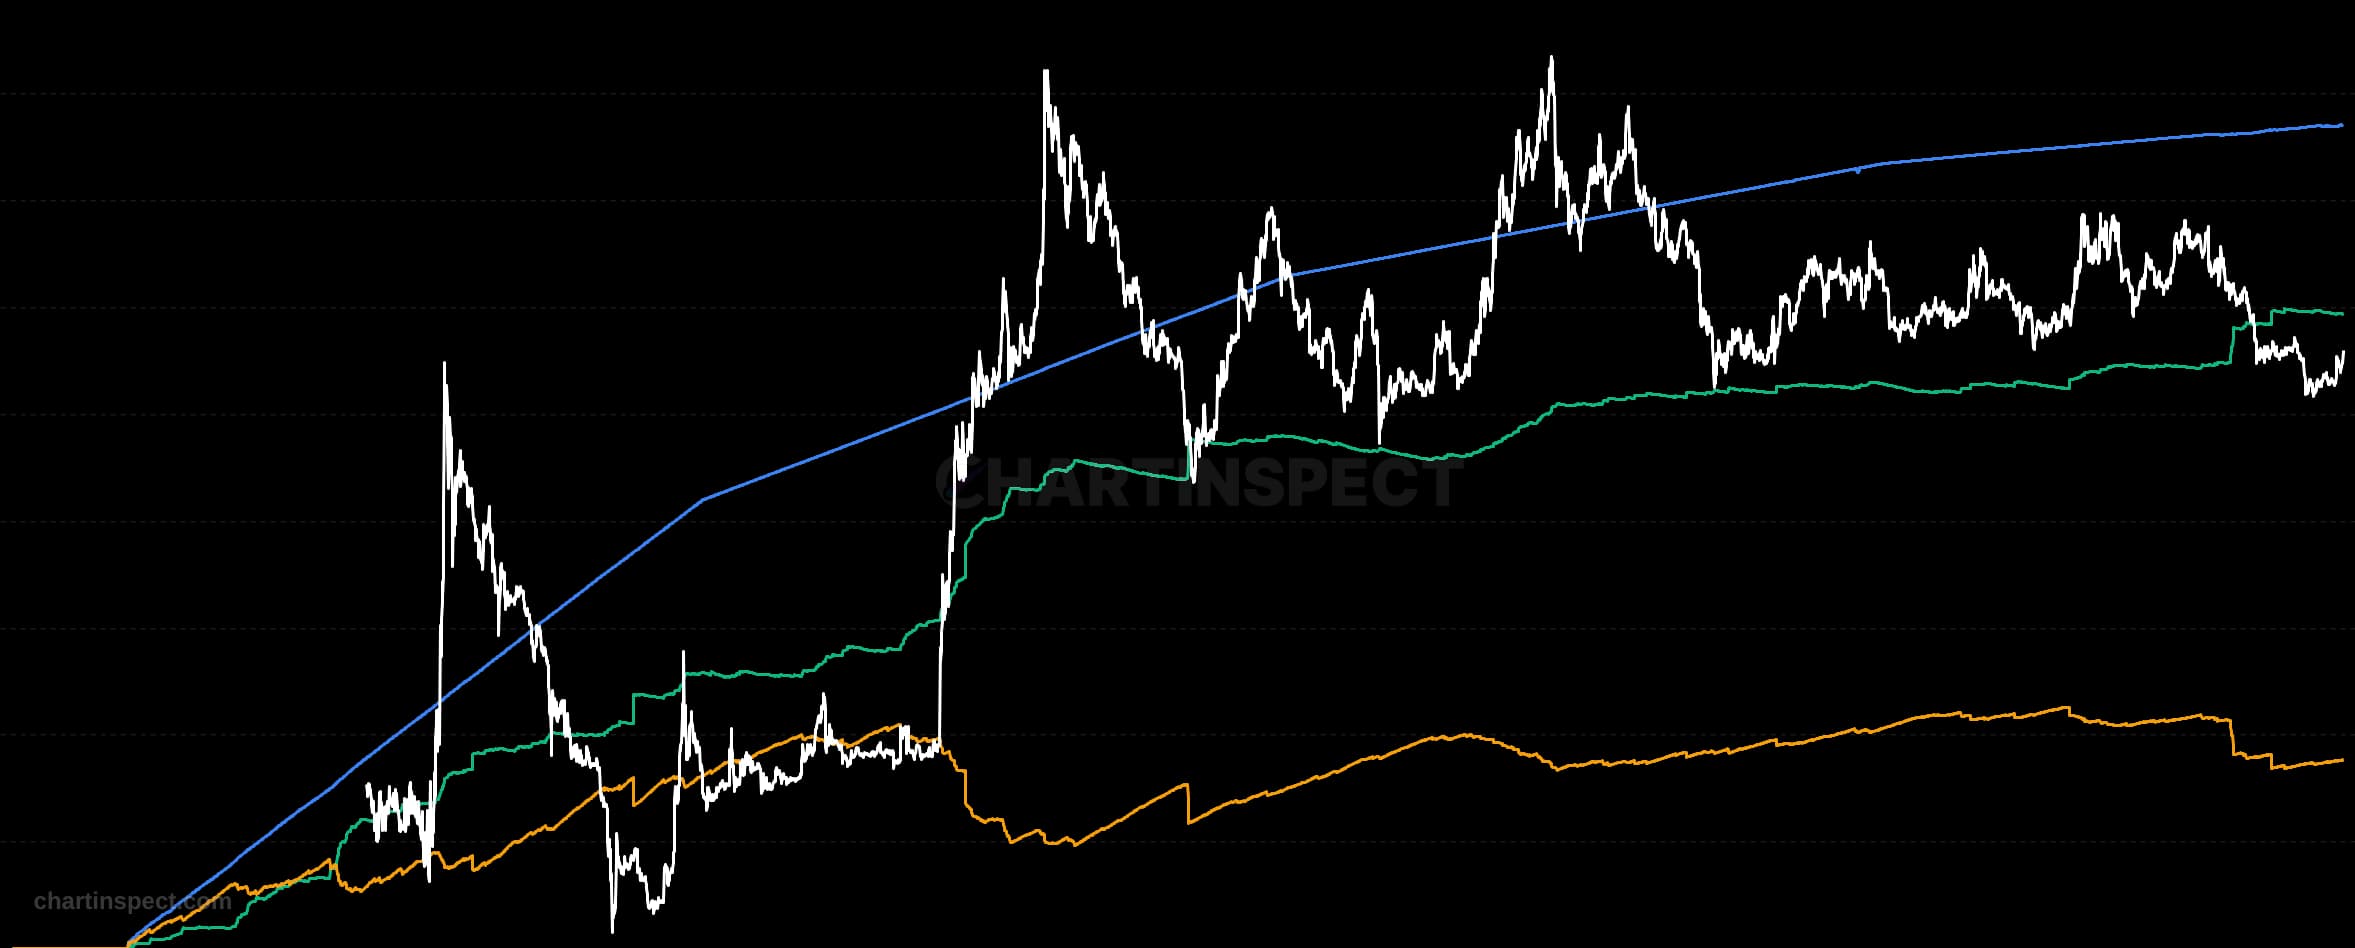
About LTC Accumulation Waves
Stacked area chart showing each Litecoin holder cohort's normalized accumulation score (Shrimp through Humpback). The total height reflects overall market accumulation strength. At cycle bottoms the stack fills up high, at cycle tops it collapses. Toggle individual cohorts on/off to isolate specific holder groups.
Freshness: Not yet verified
Community snapshot
No community calls on LTC Accumulation Waves yet. Be the first to share a take.


Related Analytics

Discover more insights with our comprehensive chart collection
Explore All 9143 Charts