Necessary cookies keep ChartInspect working. With your permission, analytics helps us improve the site and marketing measures campaigns. Analytics is on by default and you can switch it off at any time; marketing stays off until you turn it on. You can keep browsing and change either choice in Cookie settings.
Read our cookie policyDerivatives
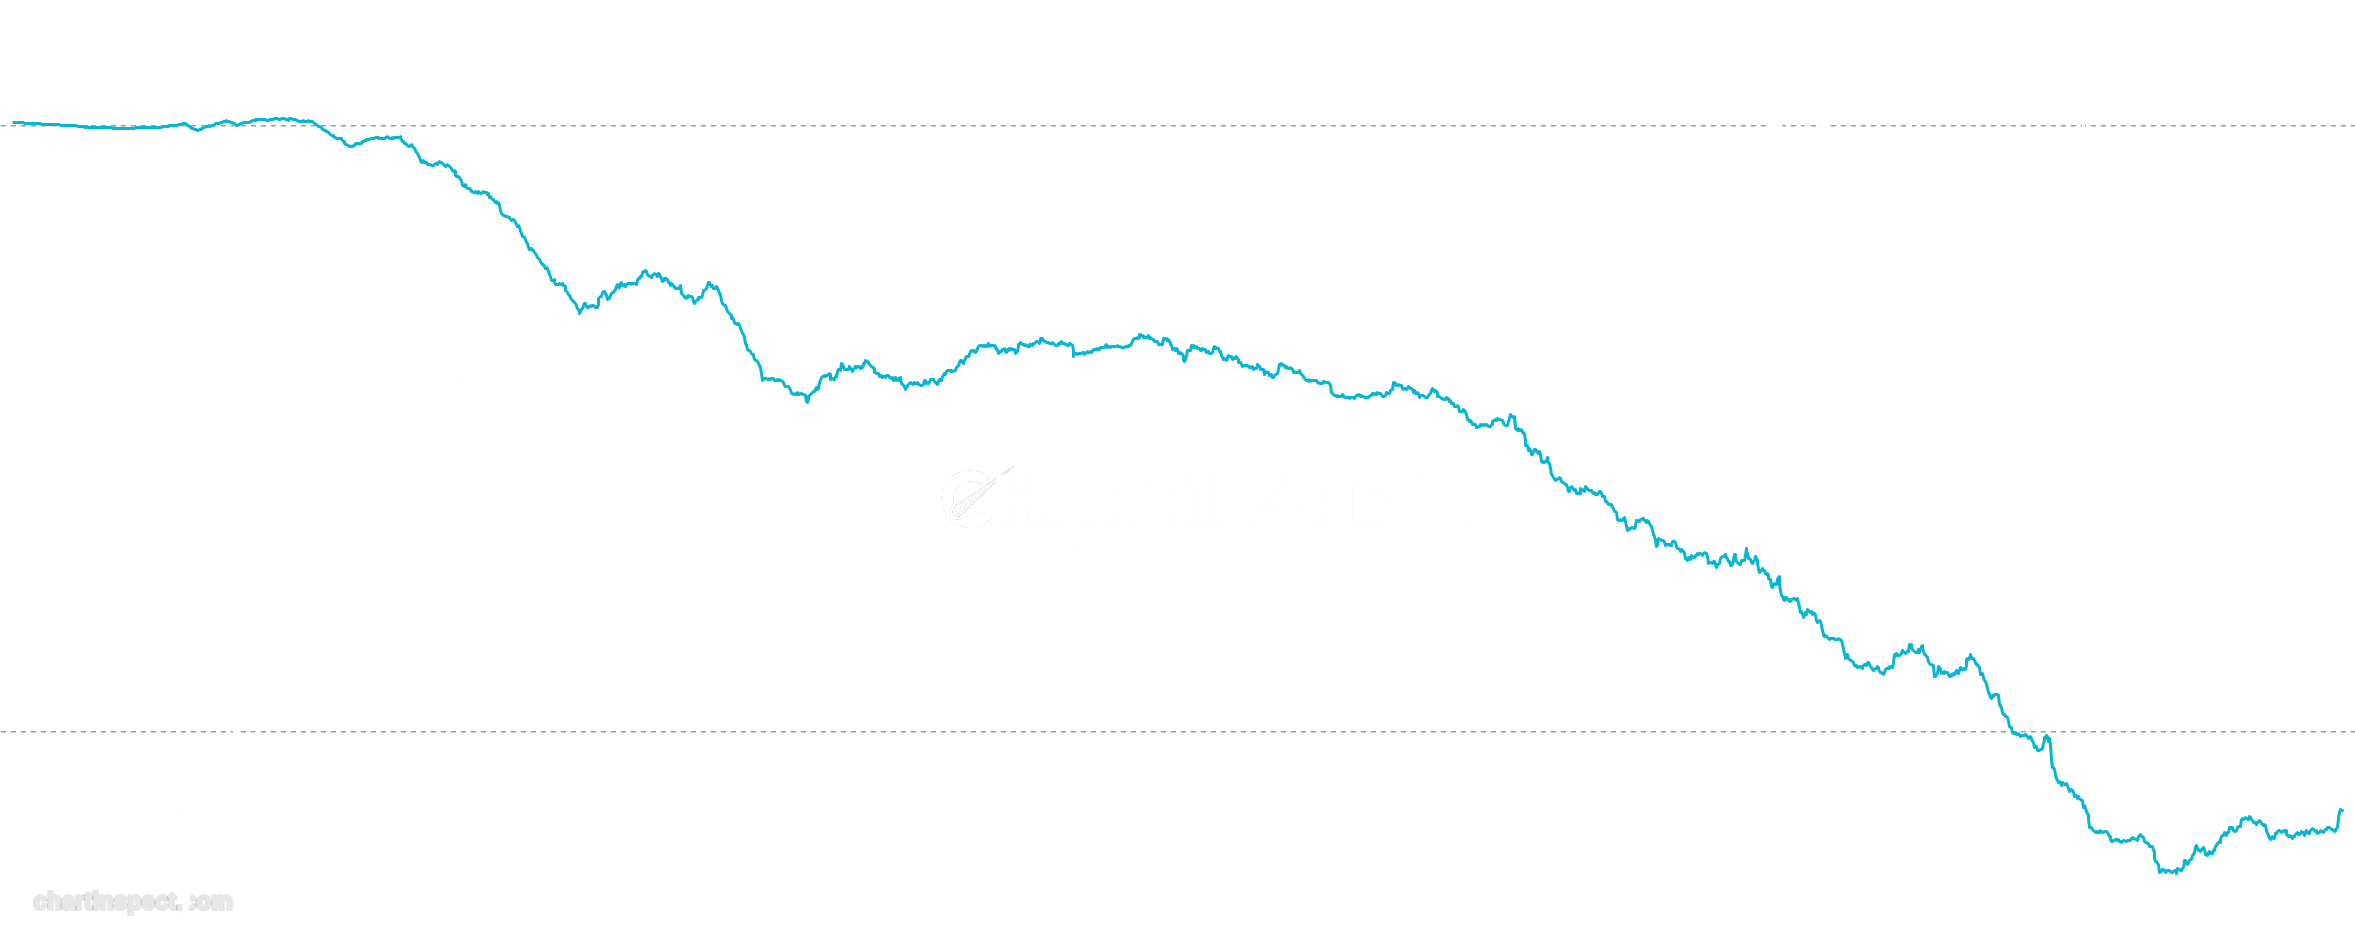
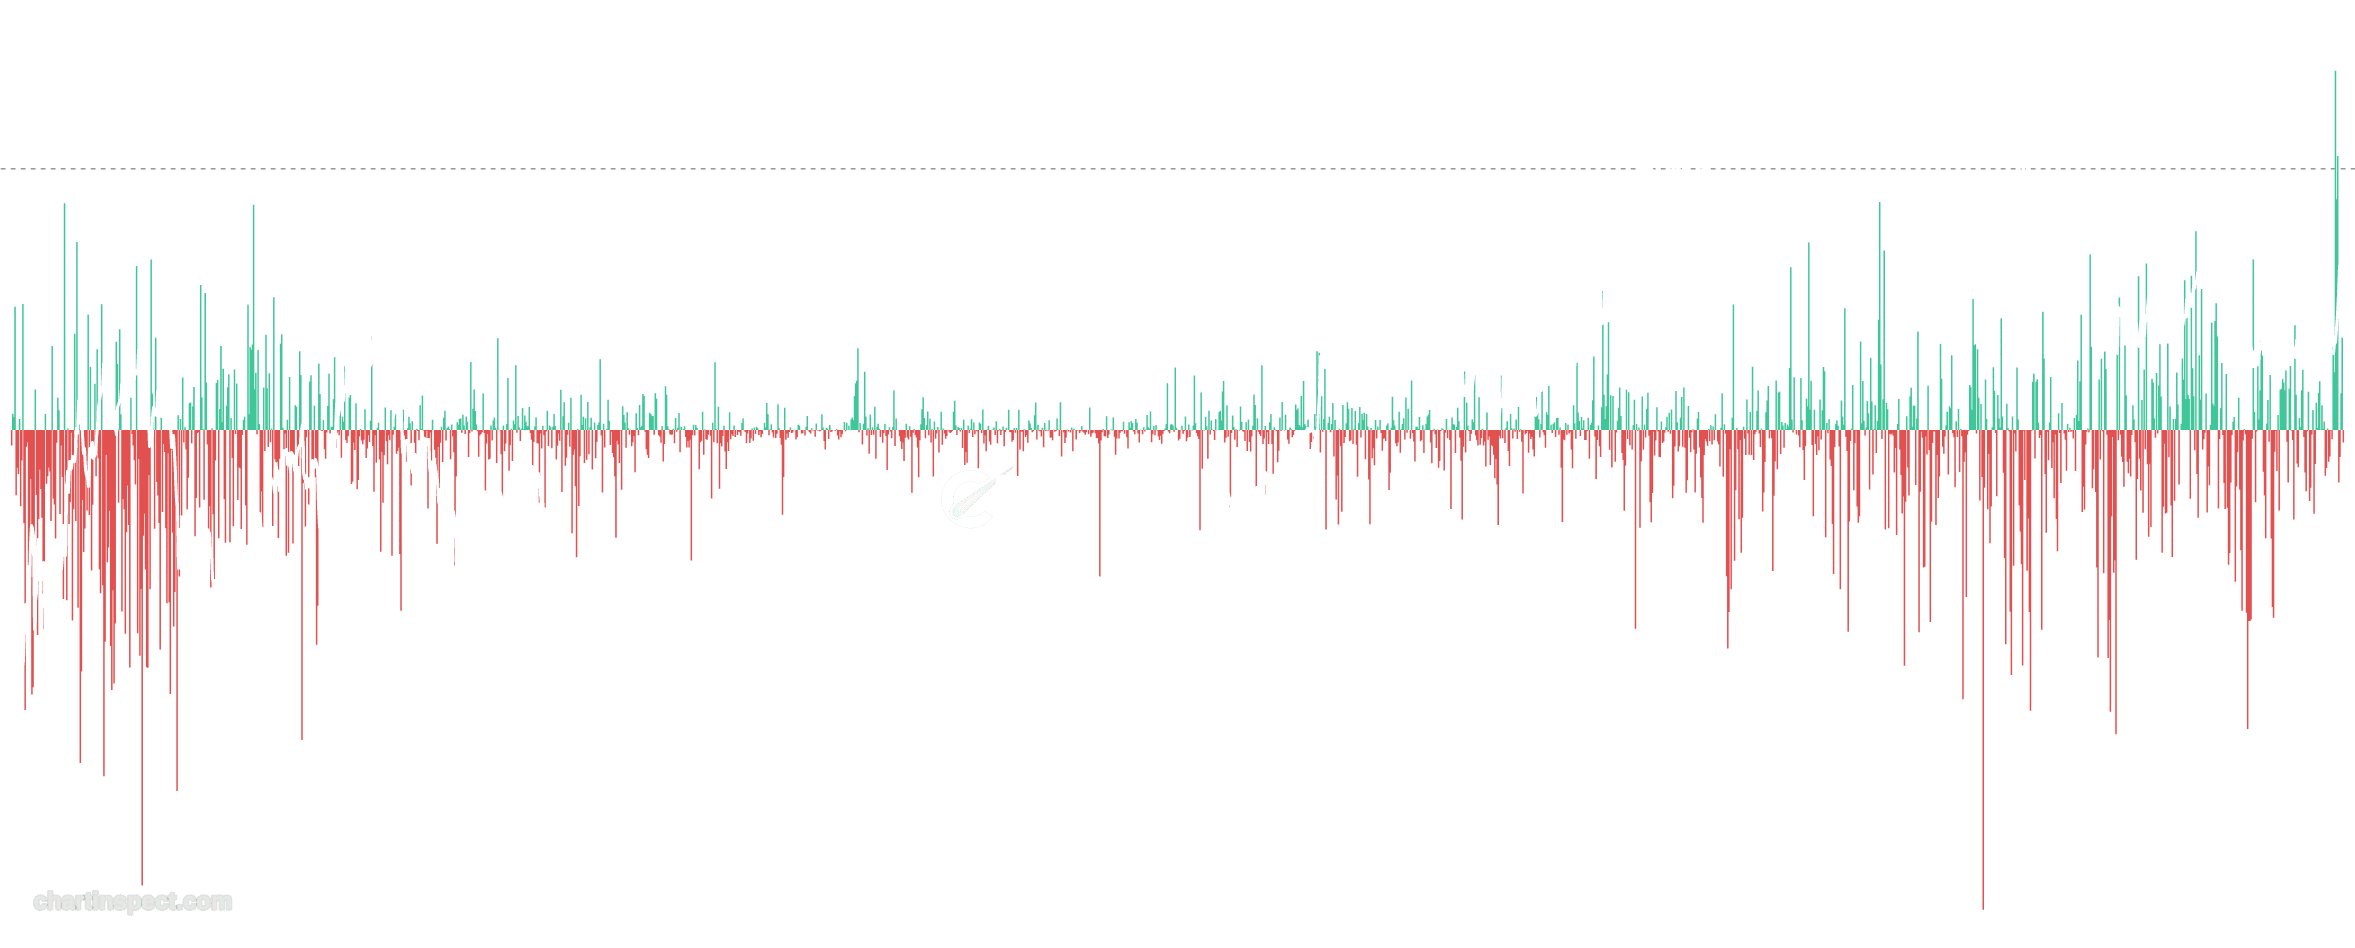
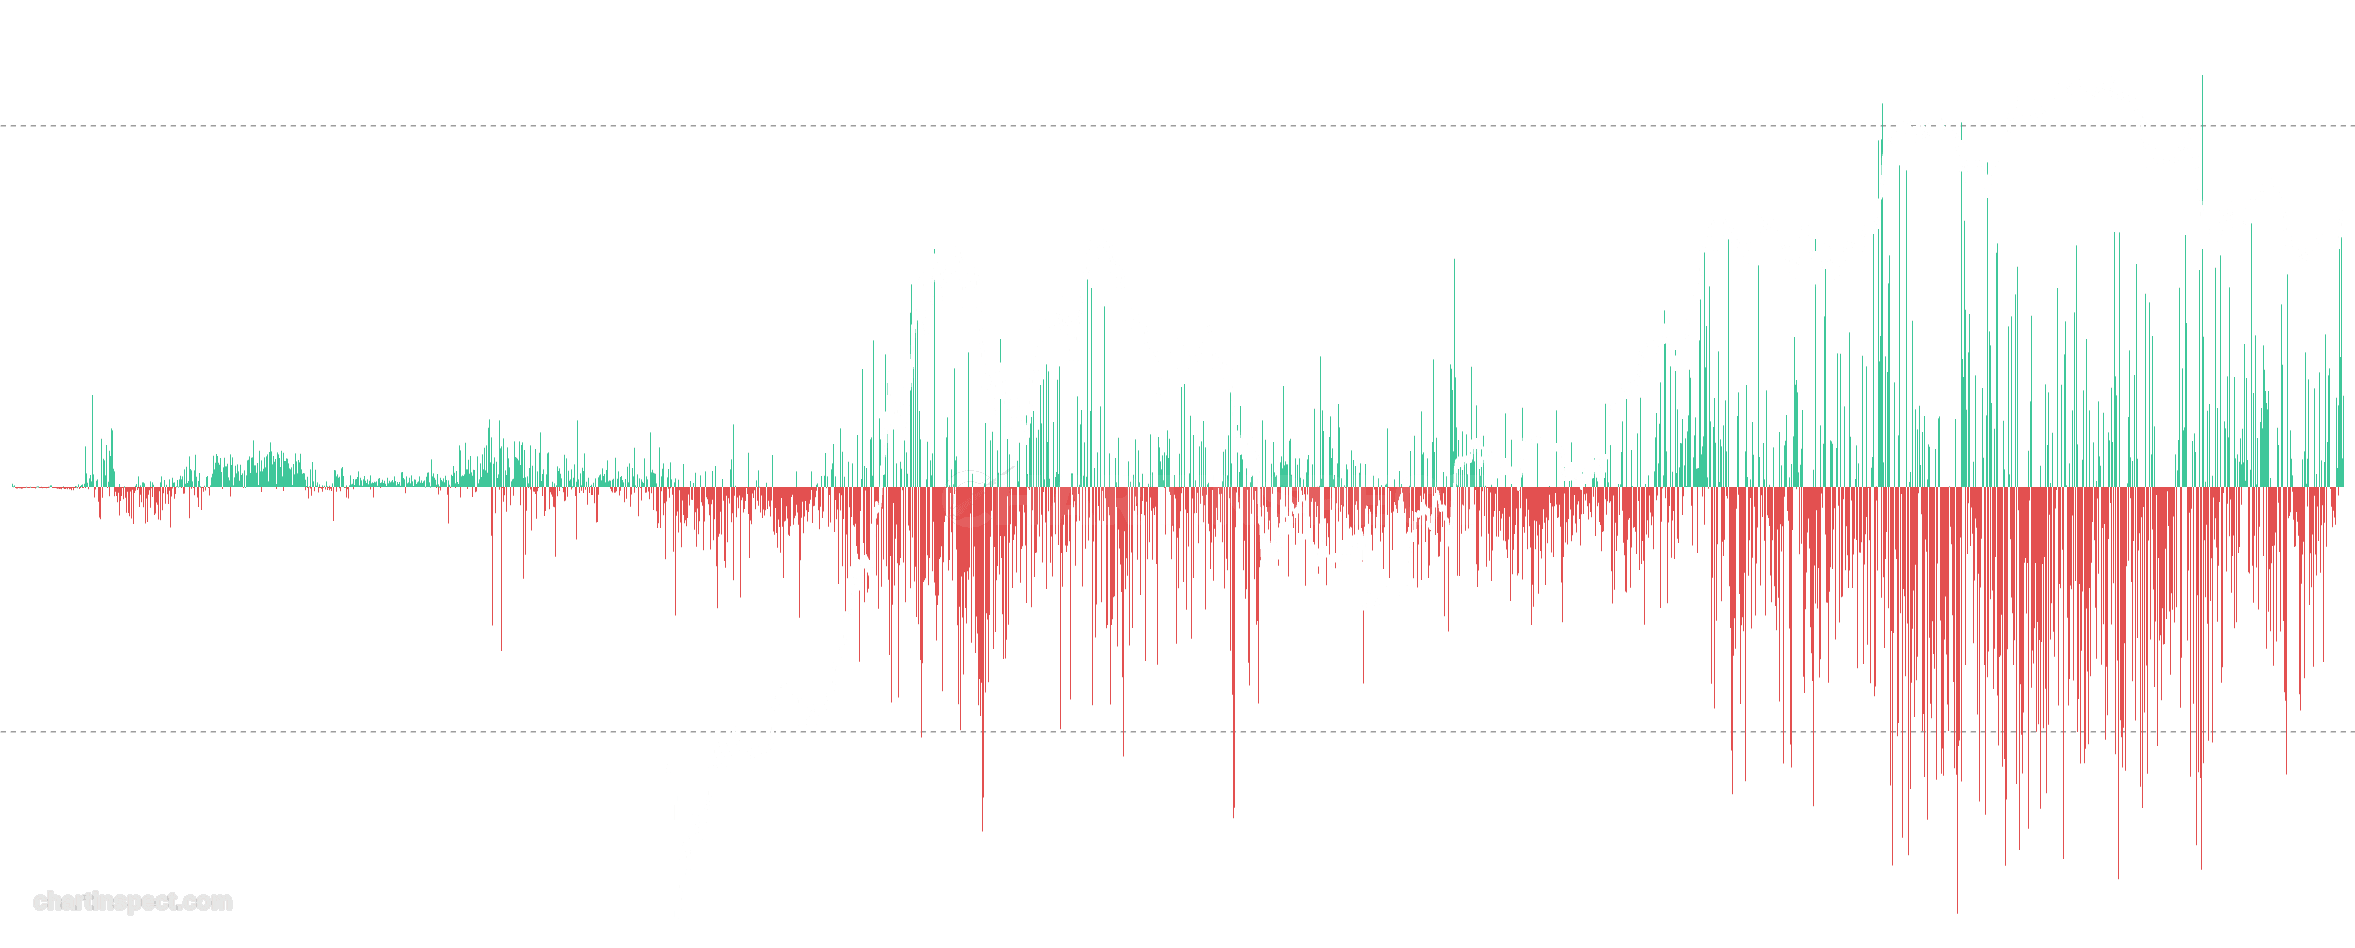
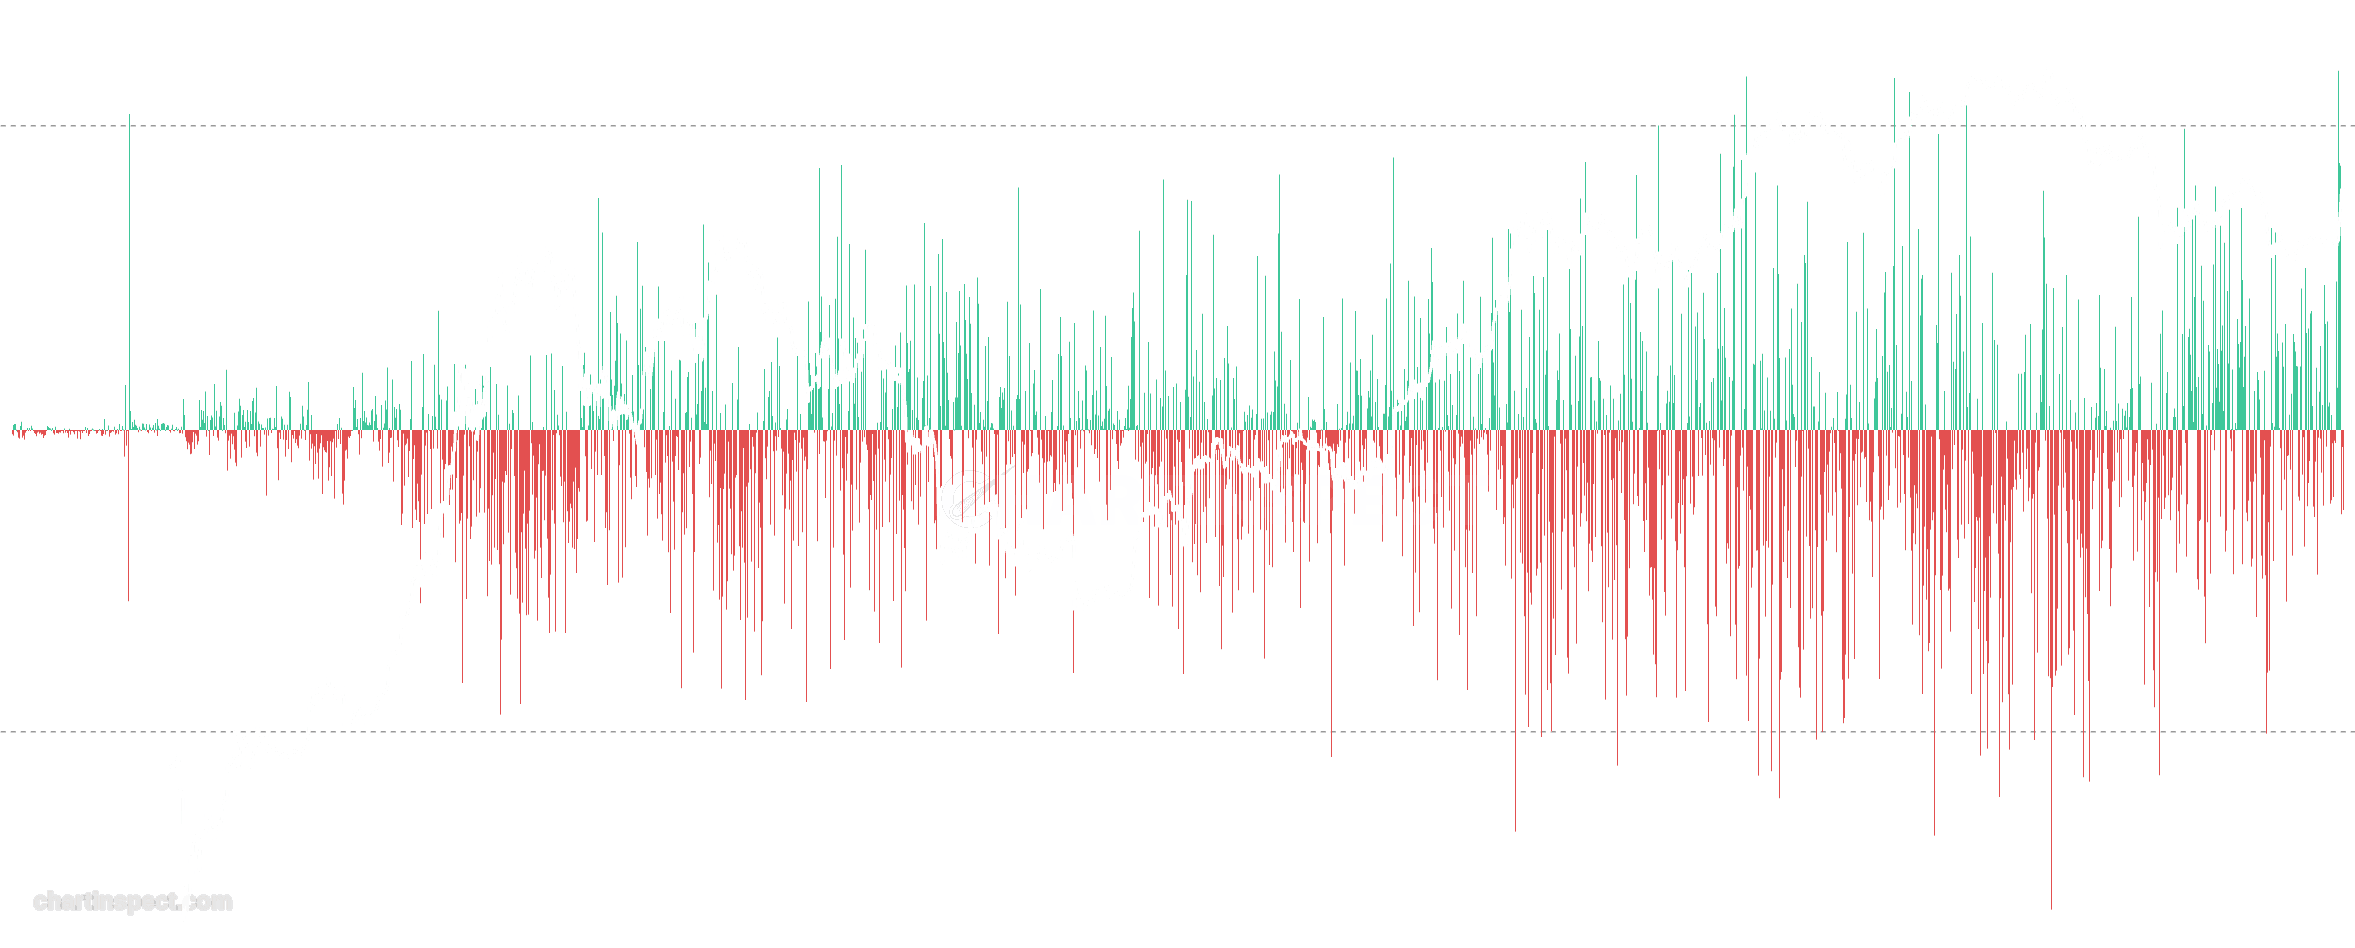
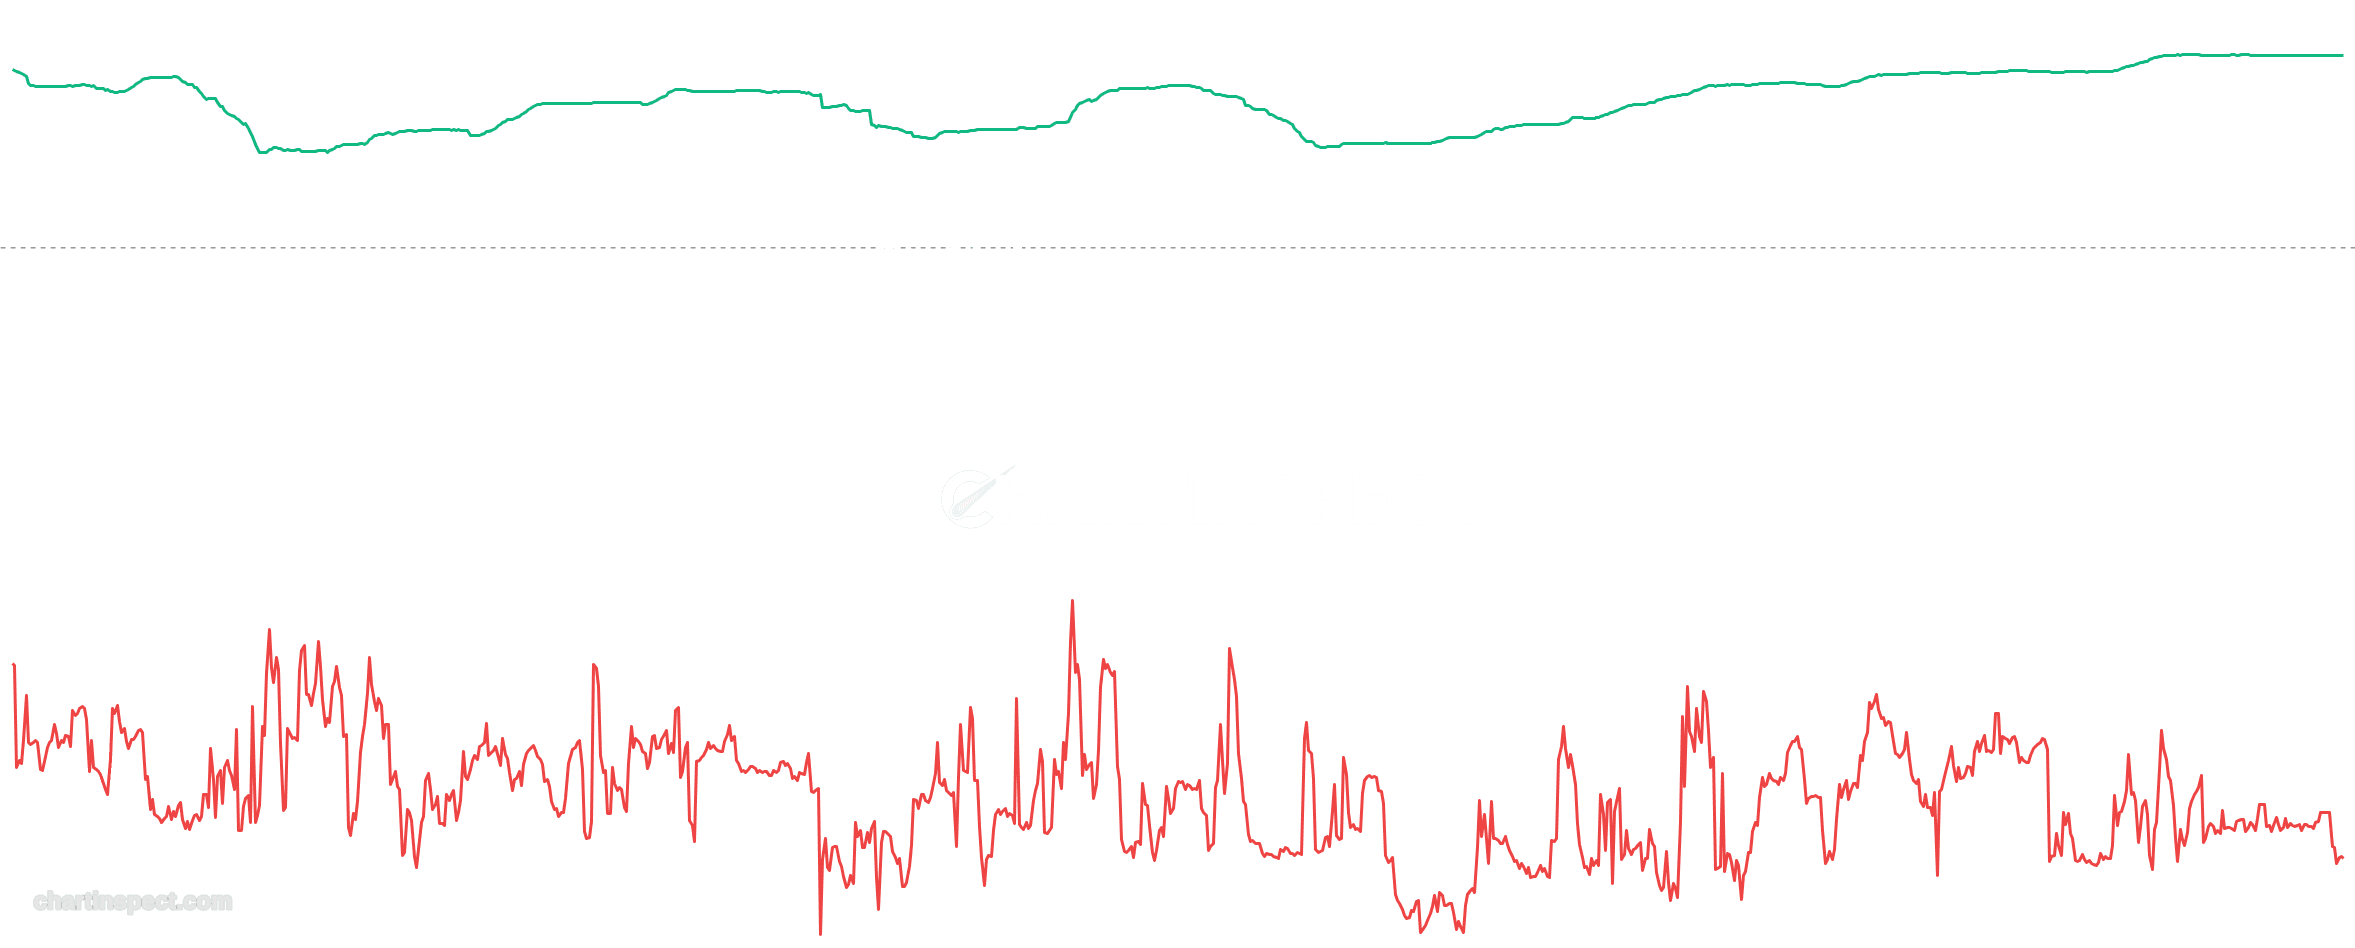
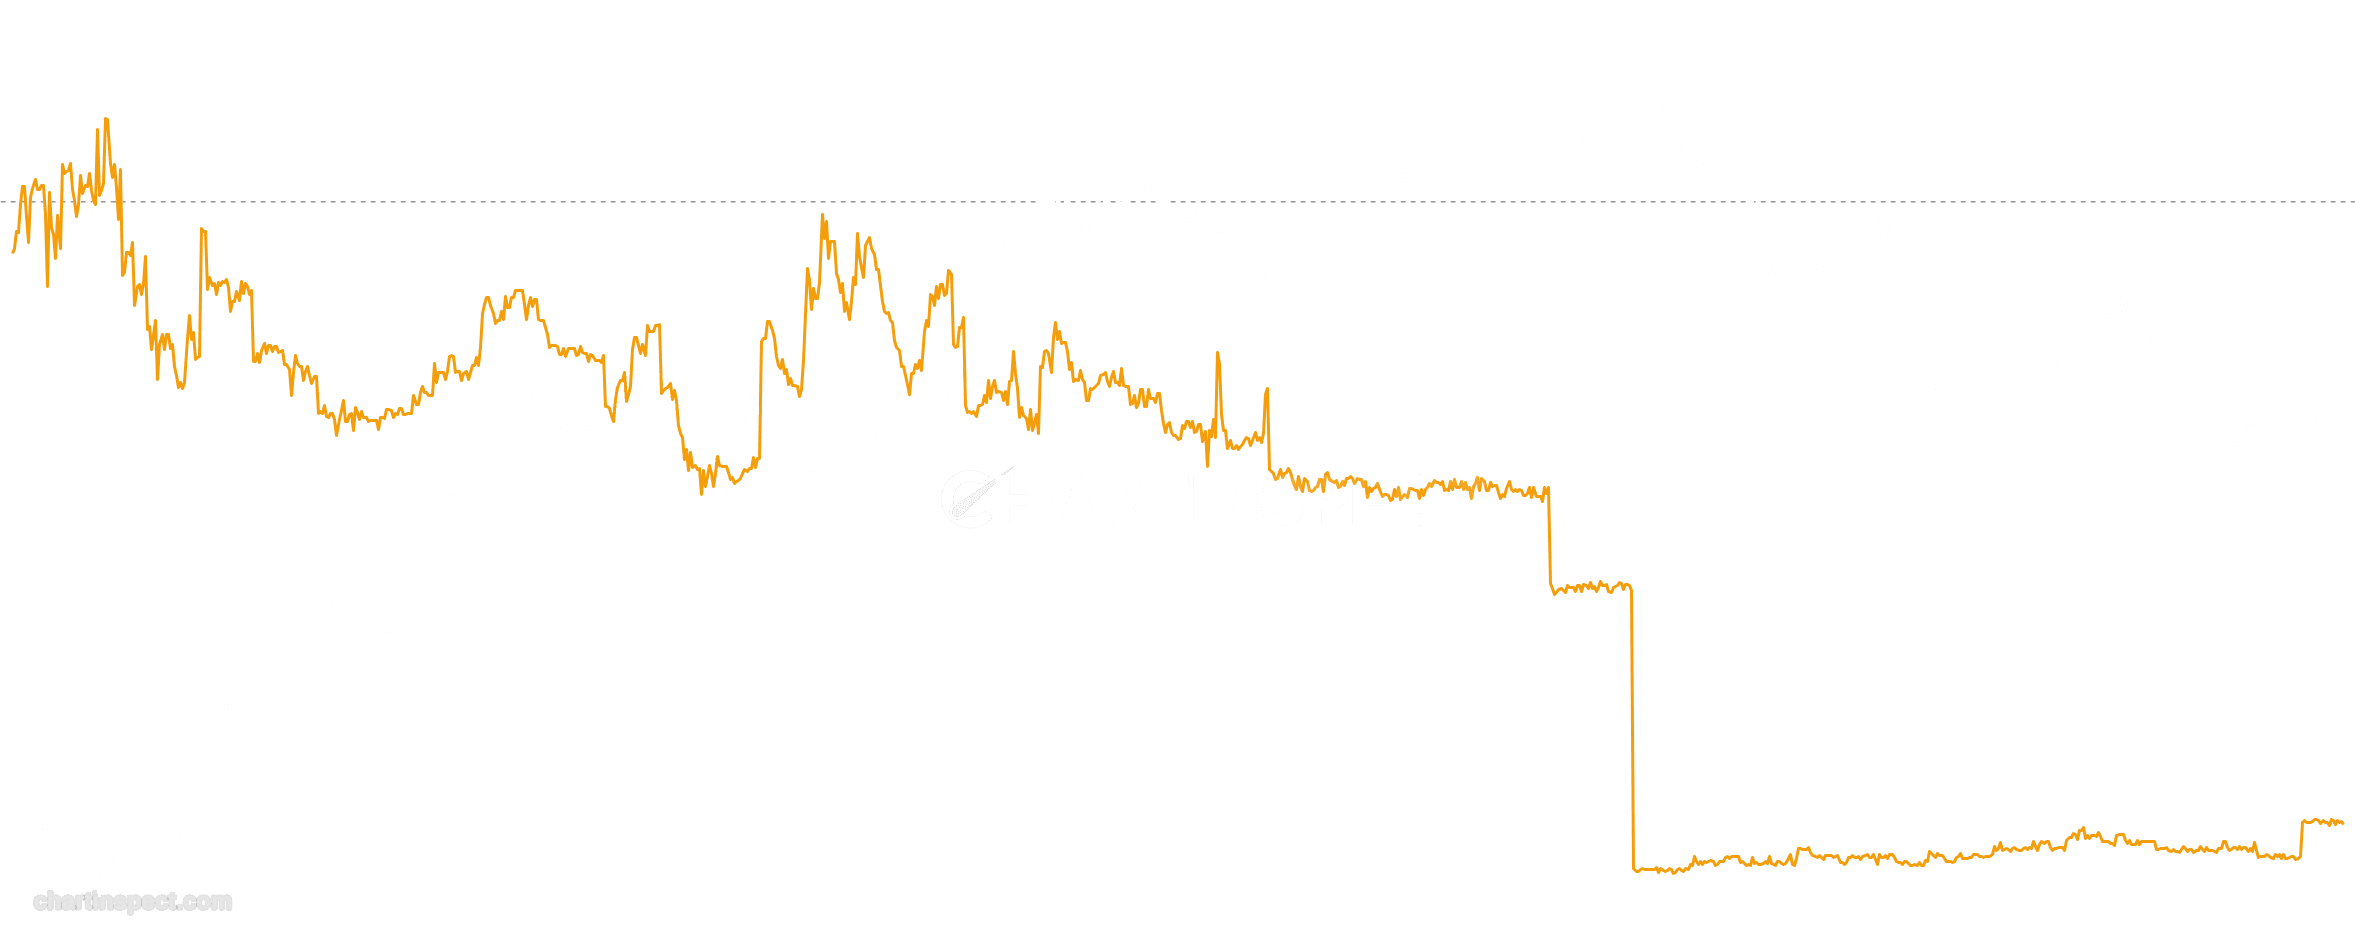
Net liquidations over seven days (shorts minus longs) as a share of futures open interest, against the 30-day change in open interest. Shows whether a sell-off cleared the leverage or the market took it back on.
Check the selected asset or market, units, and date range. Compare equivalent series over the same period and distinguish a market-wide measure from one asset or venue.
Coverage and update frequency can differ between sources. An indicator describes the data used to calculate it; it does not guarantee a future price move.
Net liquidations over seven days (shorts minus longs) as a share of futures open interest, against the 30-day change in open interest. Shows whether a sell-off cleared the leverage or the market took it back on.
Freshness: Not yet verified
No community calls on Leverage Flush yet. Be the first to share a take.
Discover more insights with our comprehensive chart collection
Explore All 10240 Charts