Loading chart data
Loading chart data
About Exchange Inflows/Outflows
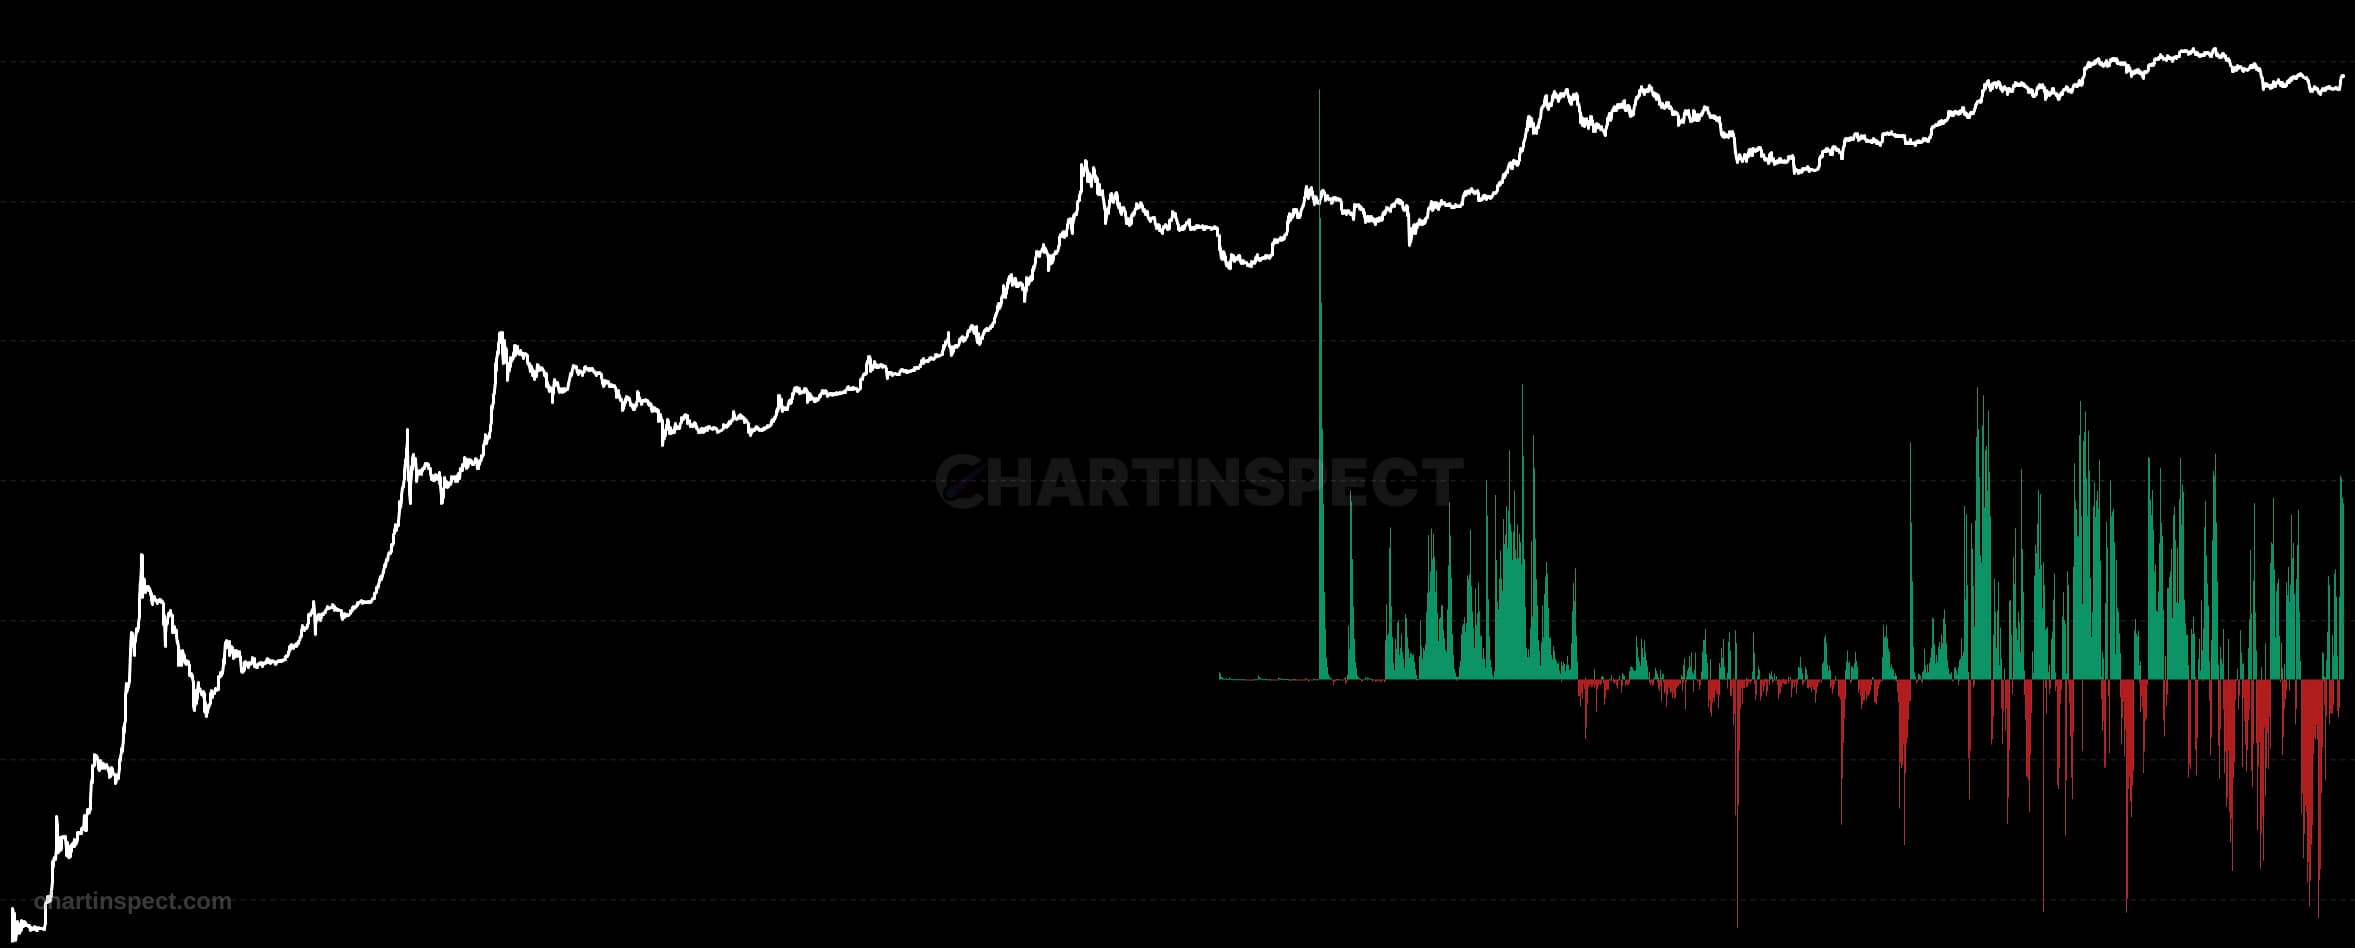
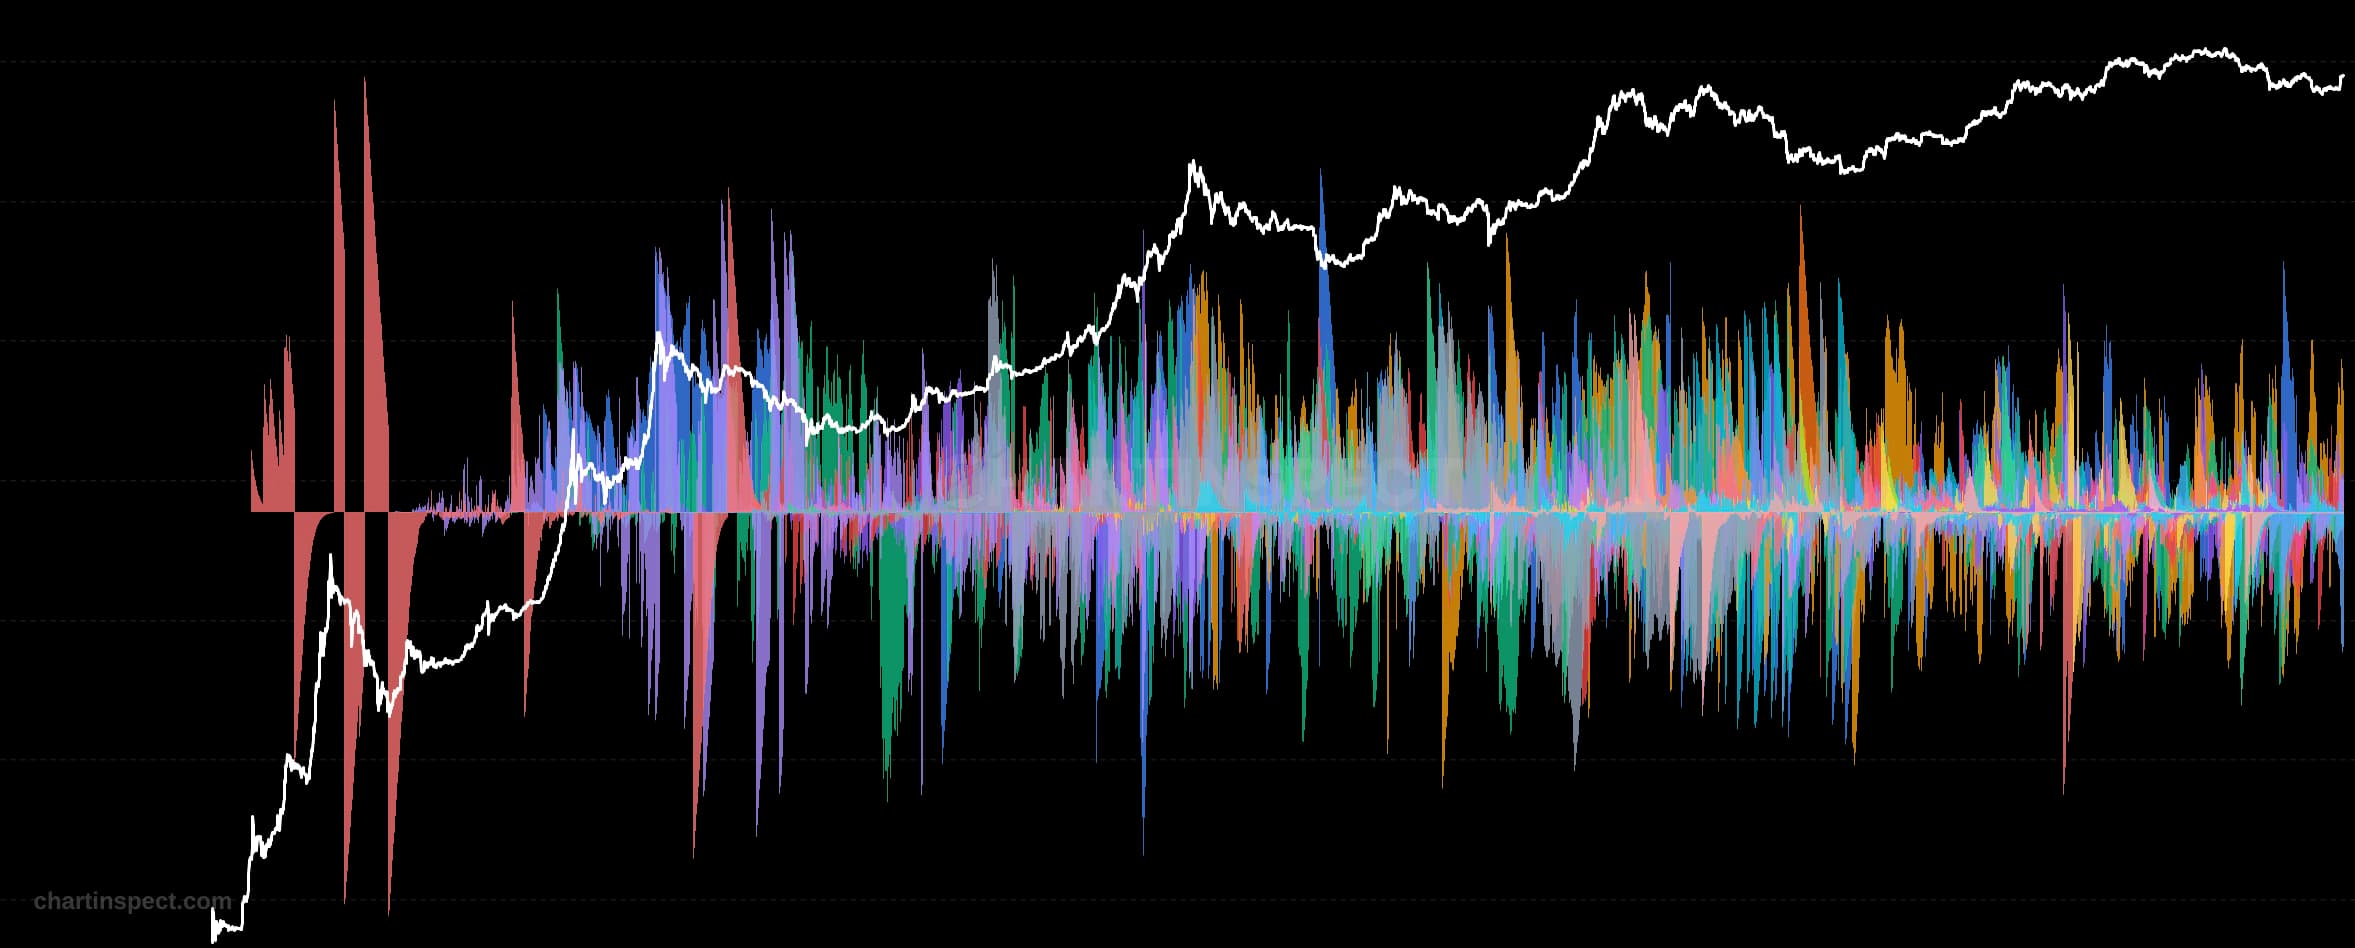
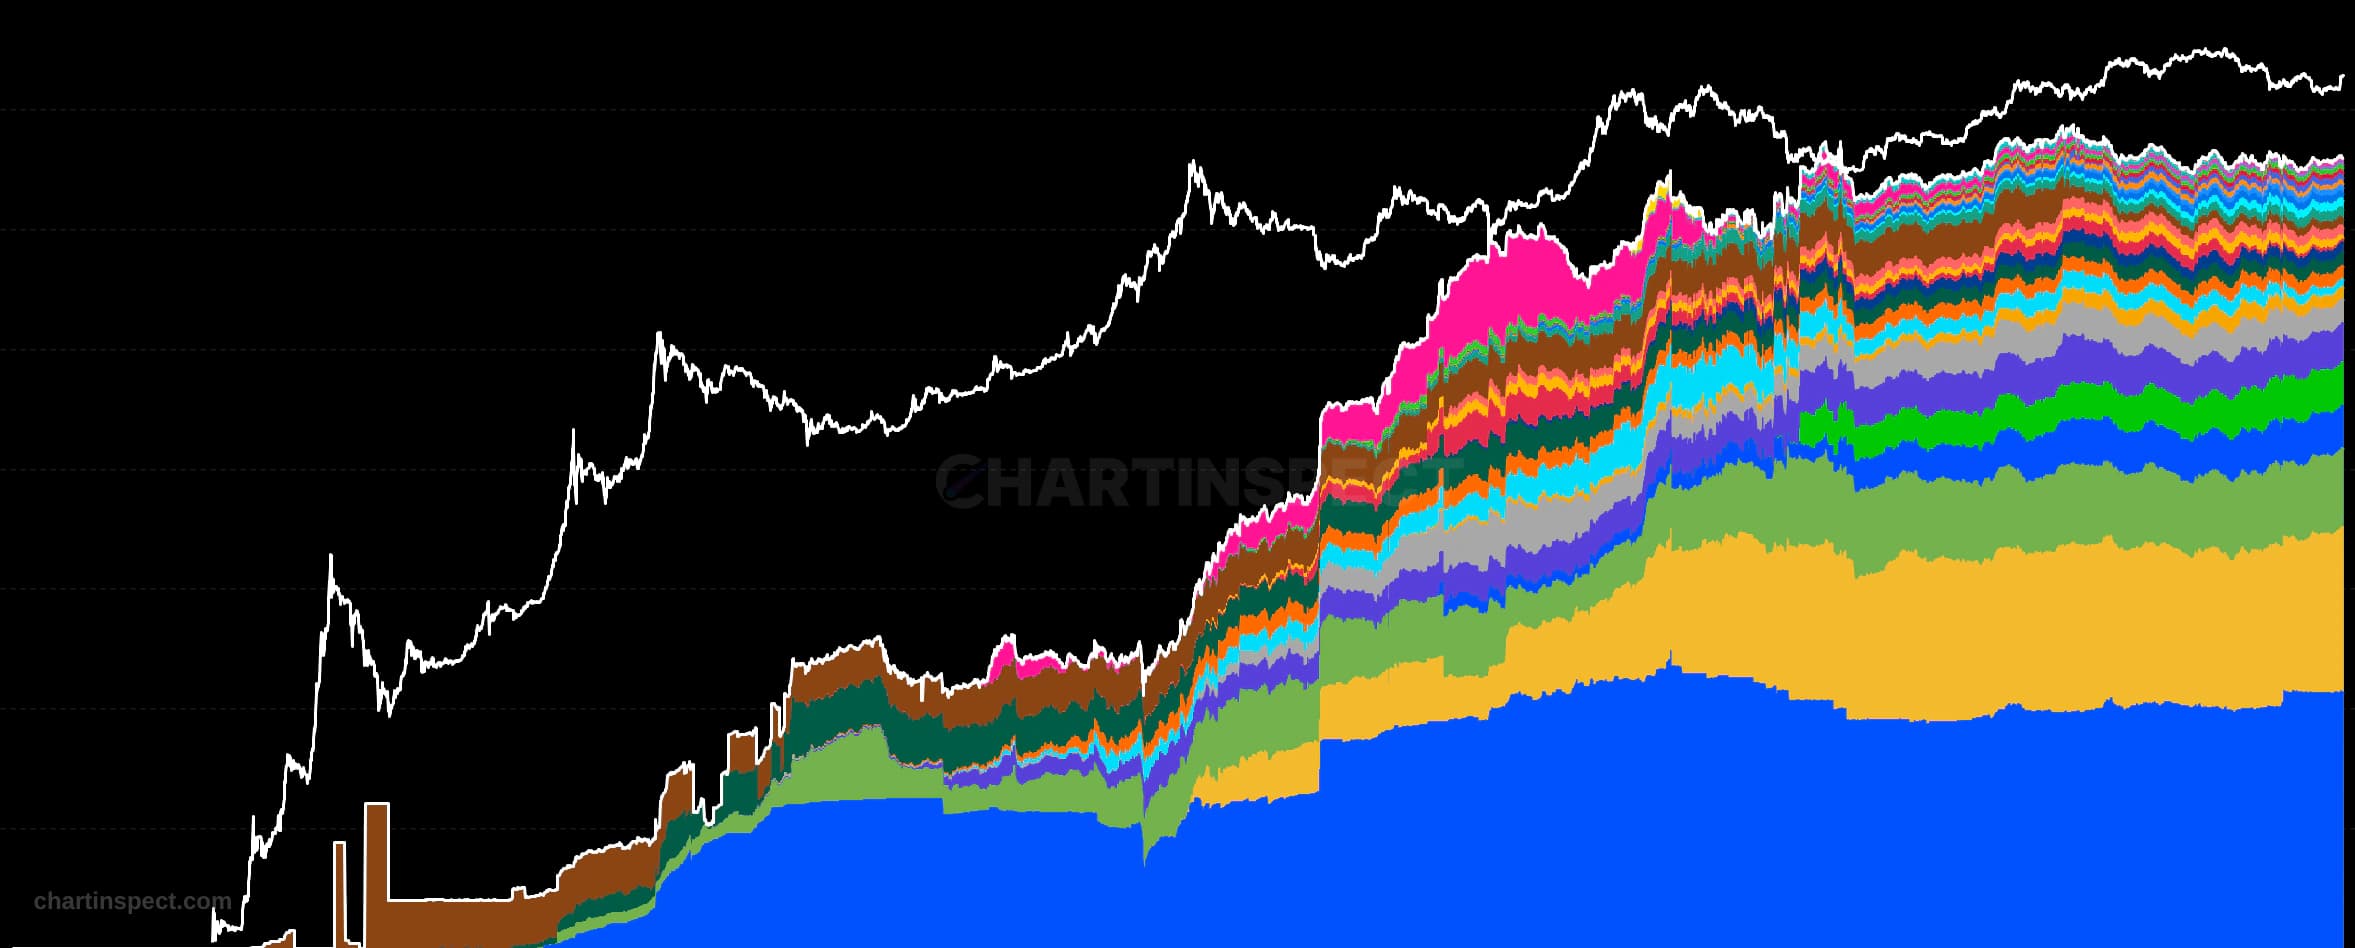
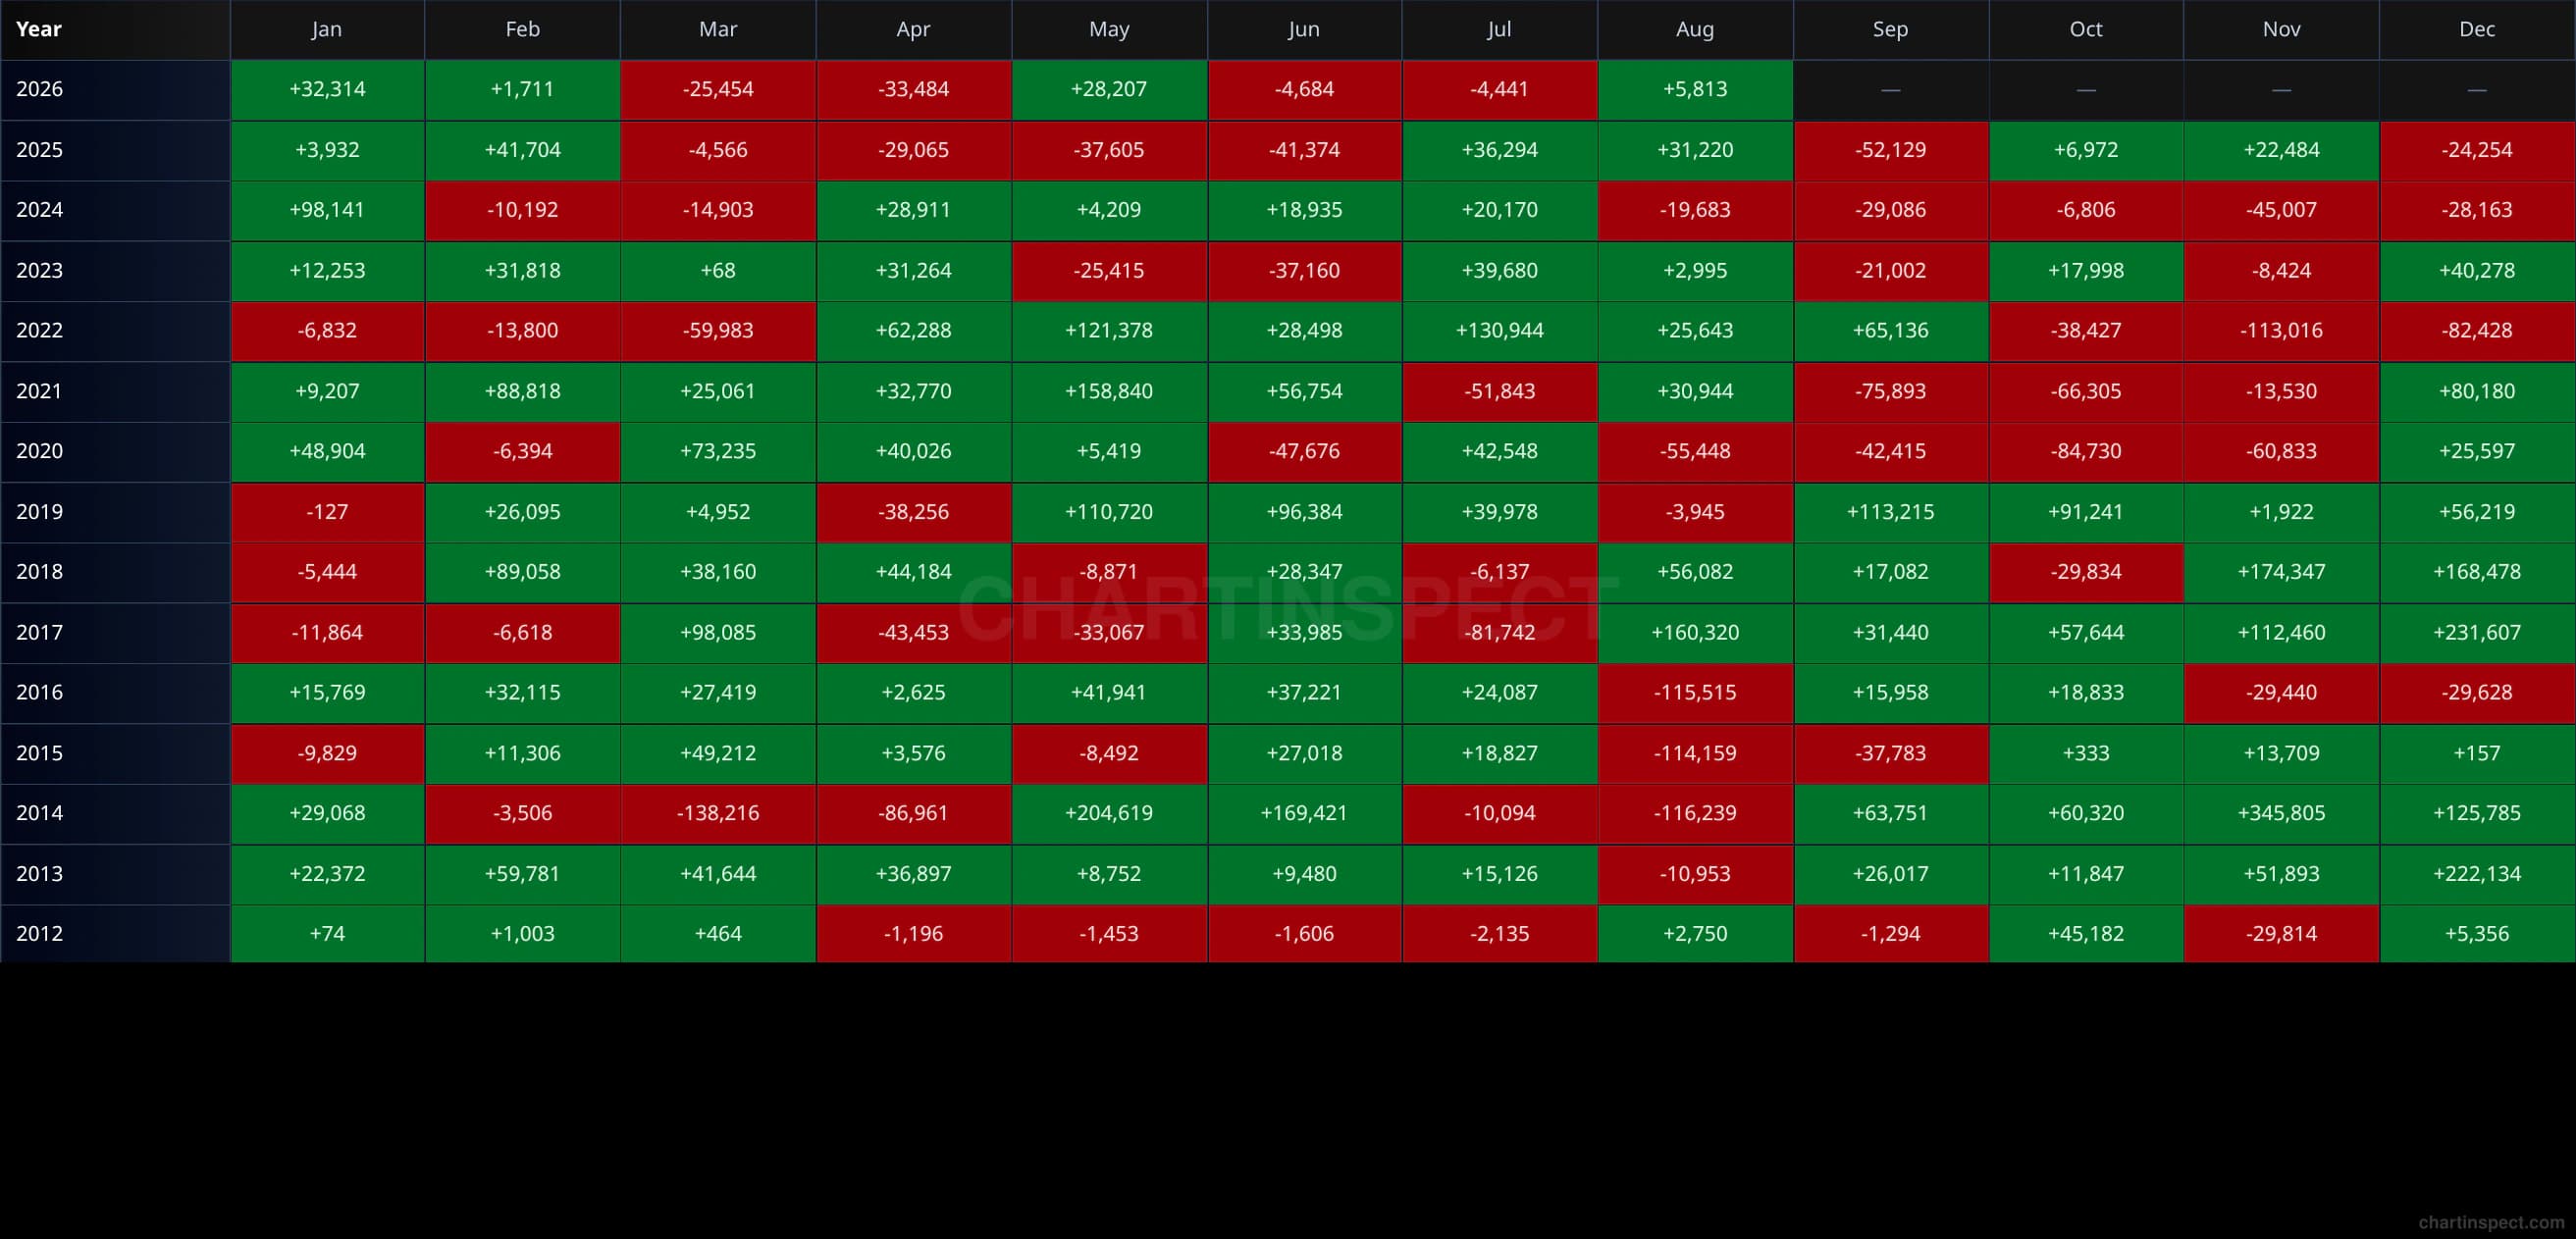
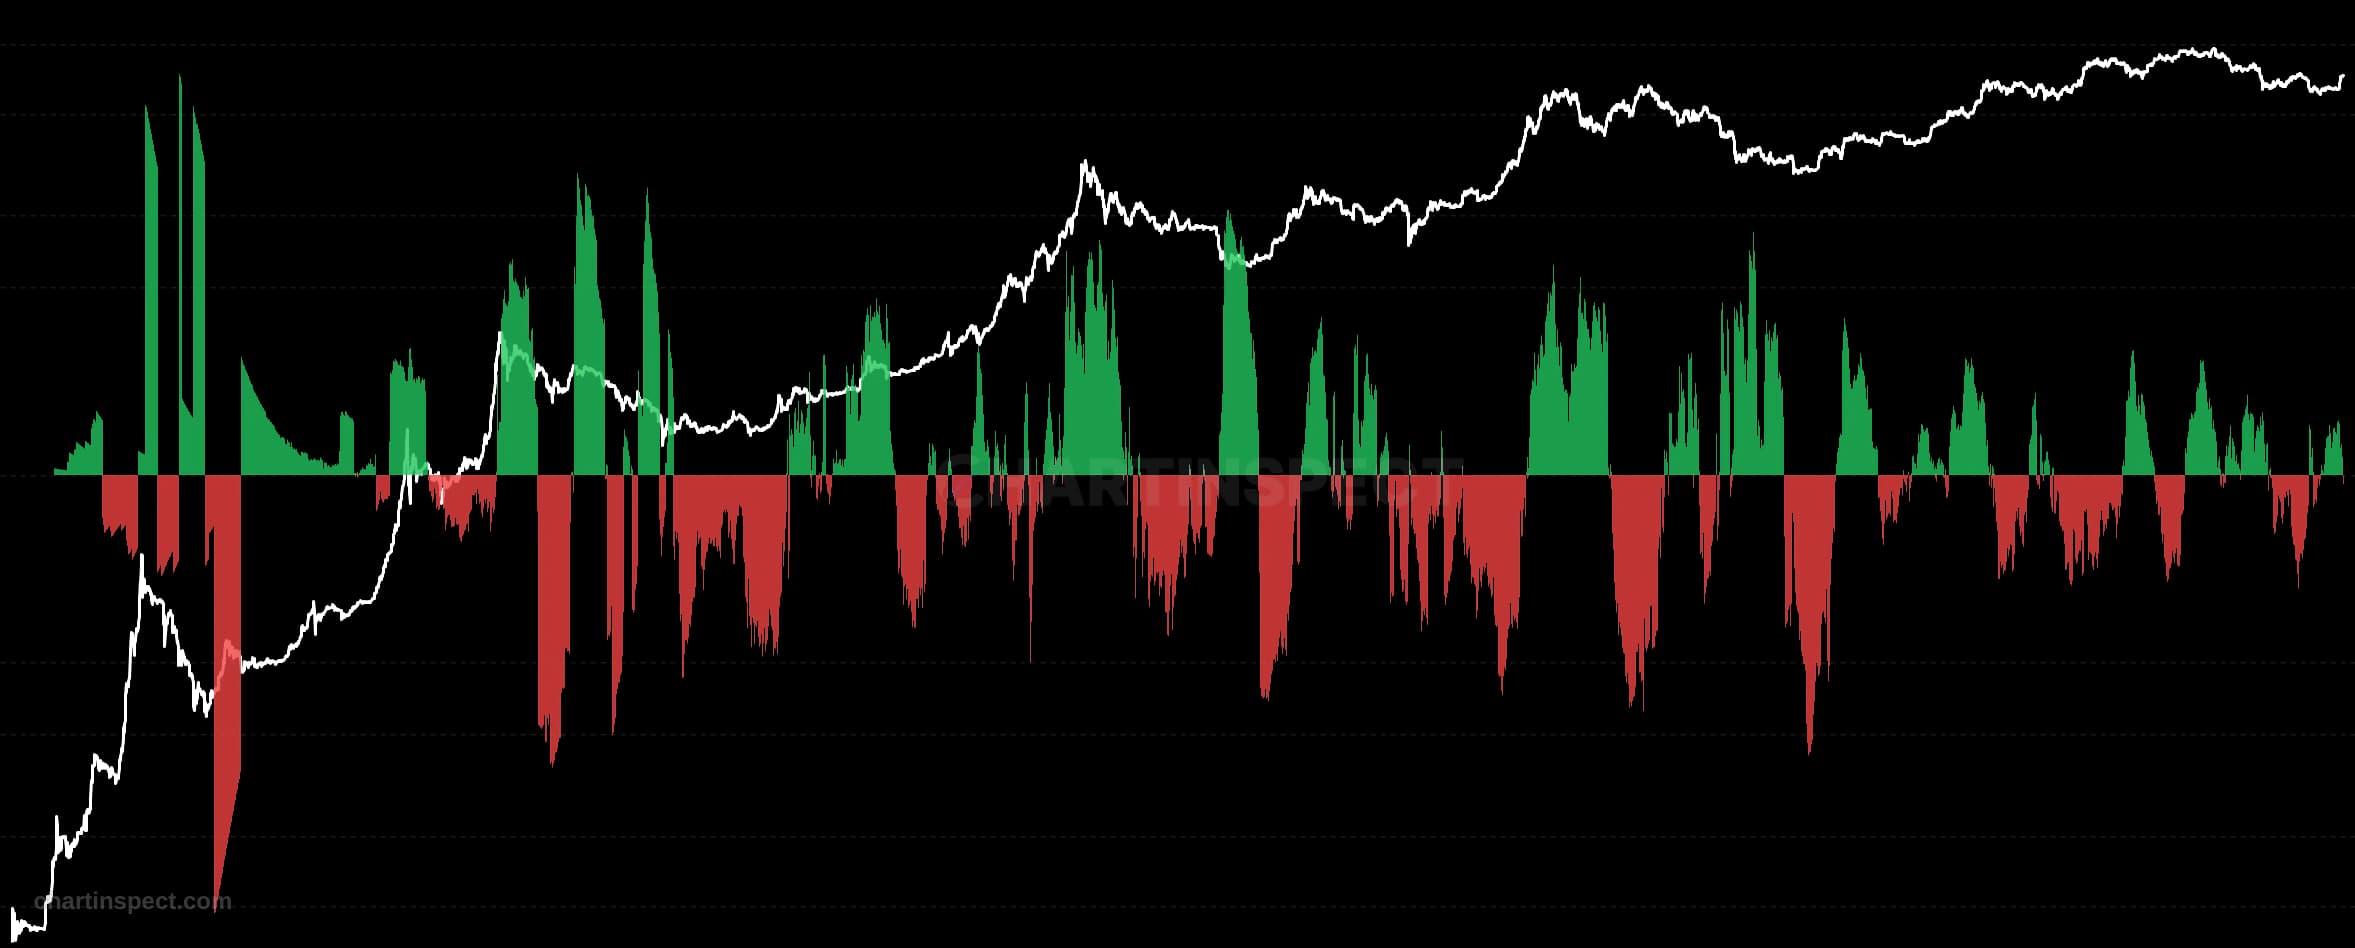
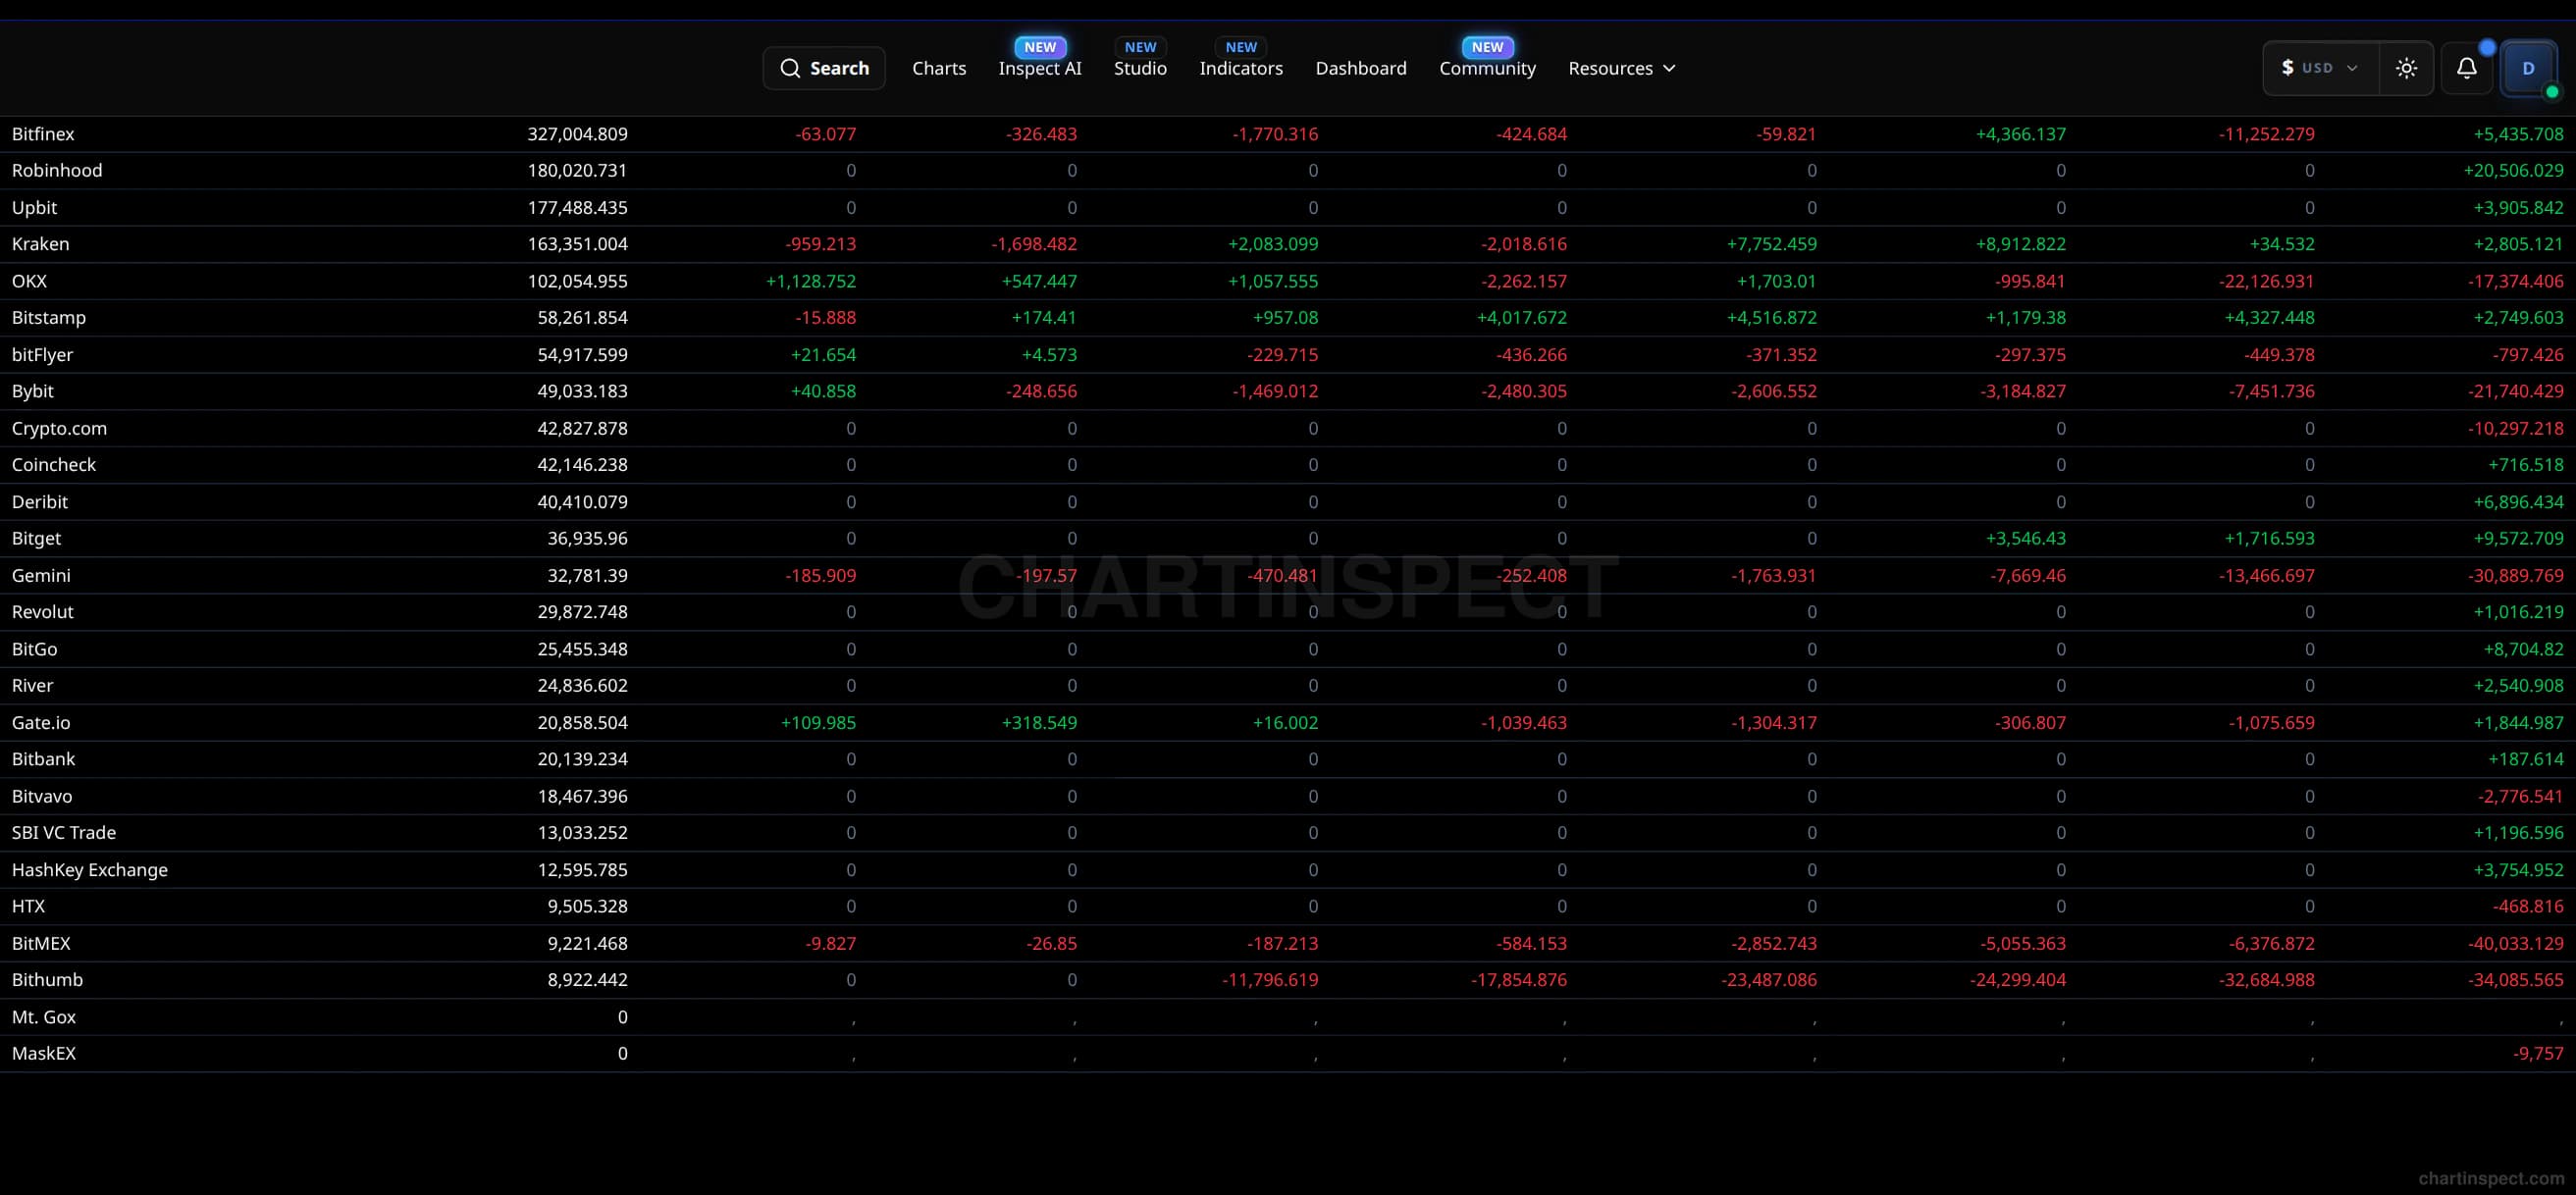
Track net Bitcoin flows onto and off exchanges. Green bars show inflows (potential selling pressure), red bars show outflows (accumulation). Reveals market sentiment and supply dynamics.
Freshness: Not yet verified
Community snapshot
No community calls on Exchange Inflows/Outflows yet. Be the first to share a take.
Related Analytics
Discover more insights with our comprehensive chart collection
Explore All 8302 Charts