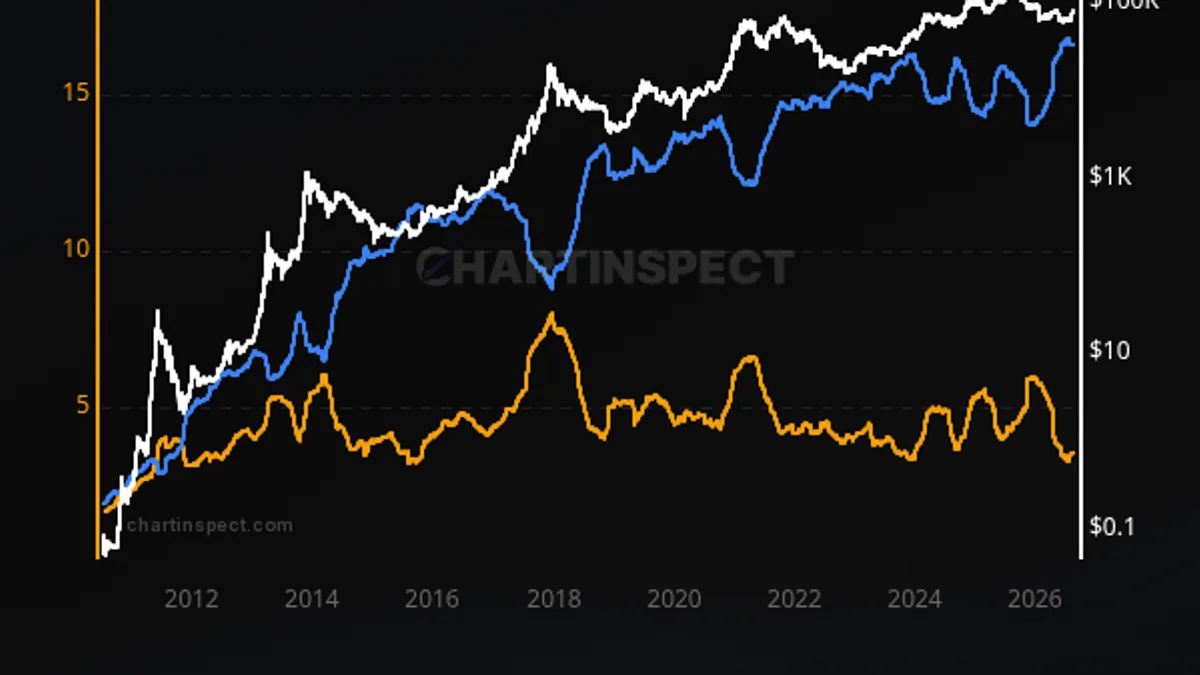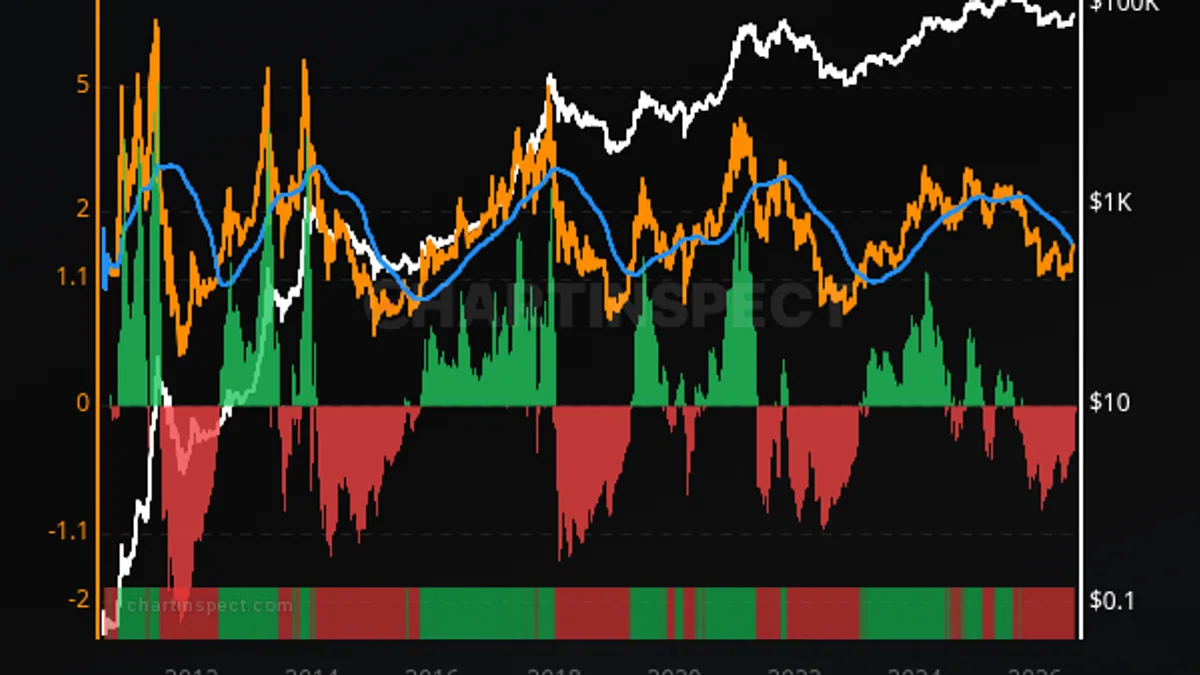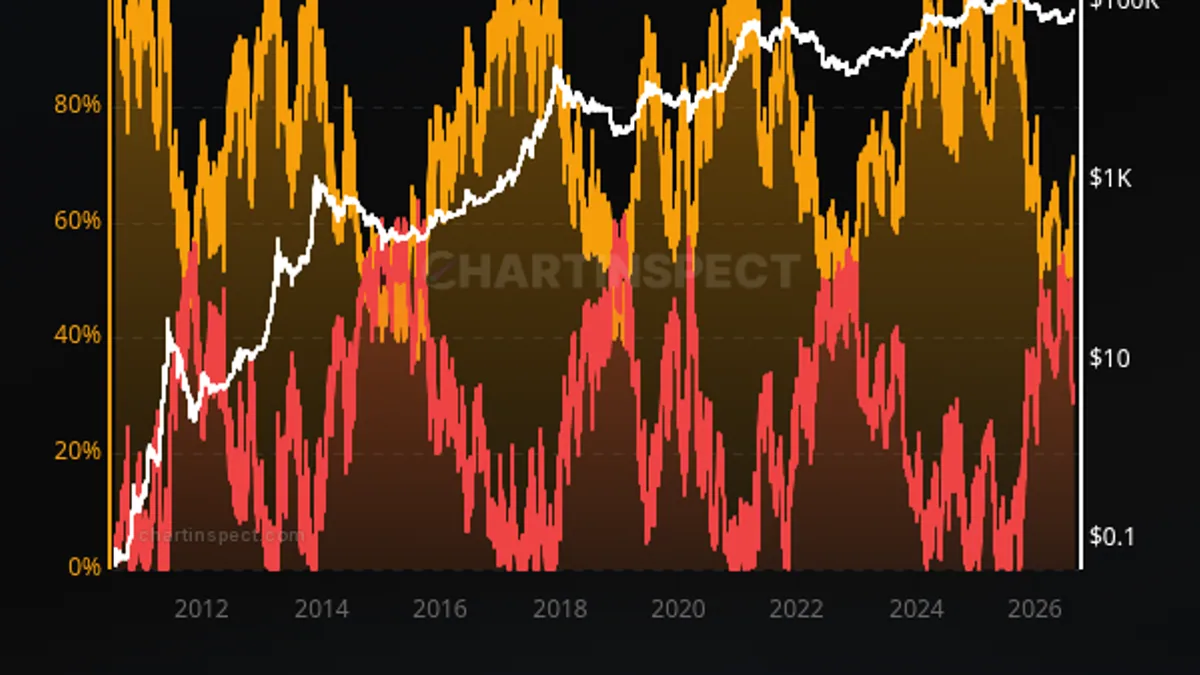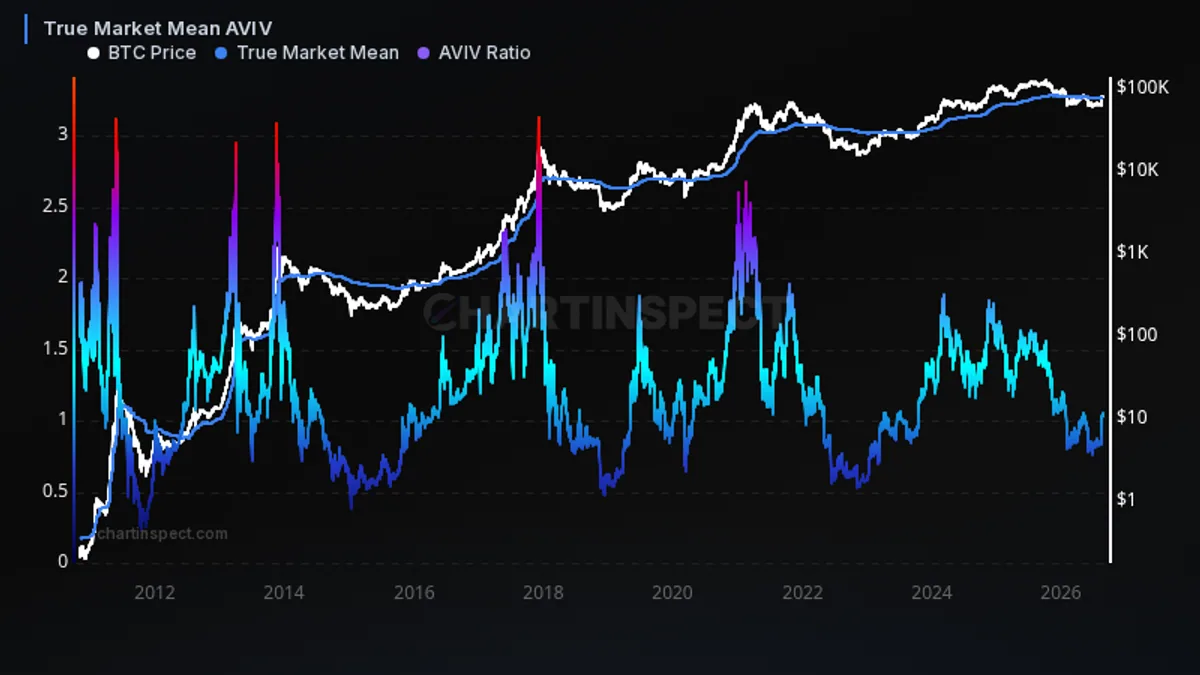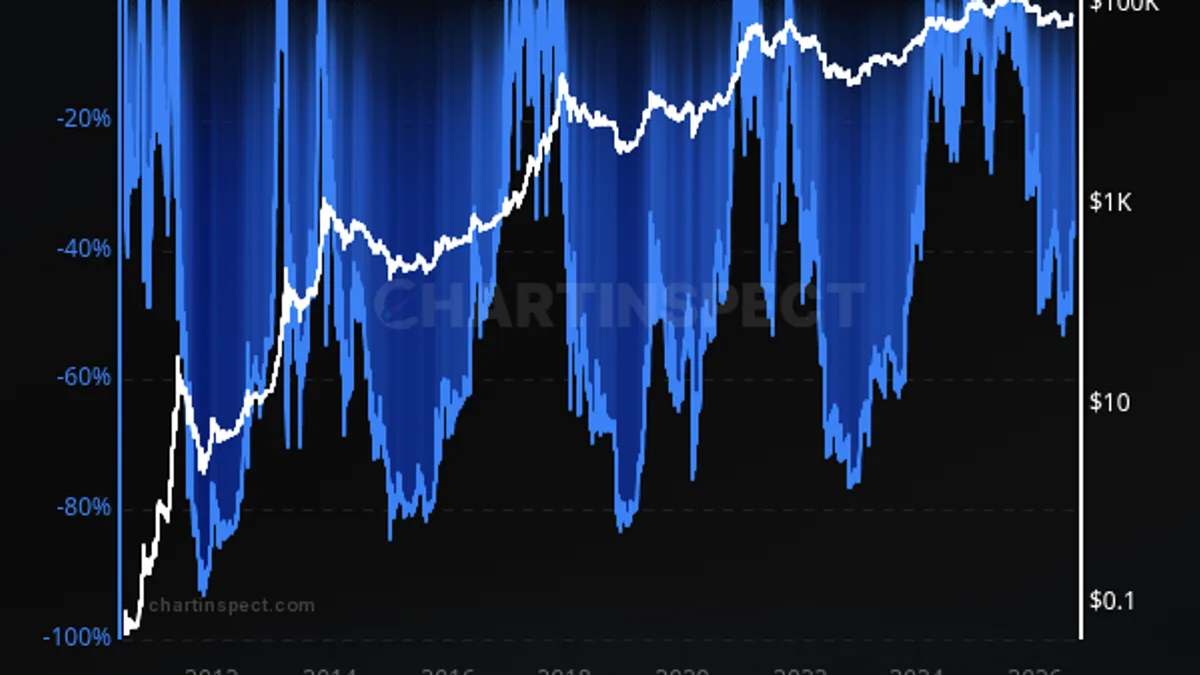
Identifying Cycle Tops & Bottoms
Master cryptocurrency market timing with price drawdown analysis, ROI metrics, and MVRV Z-Score indicators to identify major cycle tops and bottoms.
- Price Drawdown from ATH
- 1 Year ROI
- MVRV Z-Score
Necessary cookies keep ChartInspect working. With your permission, analytics helps us improve the site and marketing measures campaigns. Analytics is on by default and you can switch it off at any time; marketing stays off until you turn it on. You can keep browsing and change either choice in Cookie settings.
Read our cookie policyExplore 6 interactive exhibits charts for financial and market analysis.
Open any chart for historical context, interactive timeframes, and cryptocurrency market comparisons.
Guided walkthroughs that combine several charts to teach one market-analysis idea. Read one, or build and share your own.

Master cryptocurrency market timing with price drawdown analysis, ROI metrics, and MVRV Z-Score indicators to identify major cycle tops and bottoms.

Understand how different holder cohorts behave throughout market cycles. Analyze cost basis, supply distribution, and cohort MVRV to read market psychology.

Master momentum analysis with MVRV, RHODL, SOPR, and P/L ratio momentum to identify trend strength, turning points, and optimal entry/exit timing.

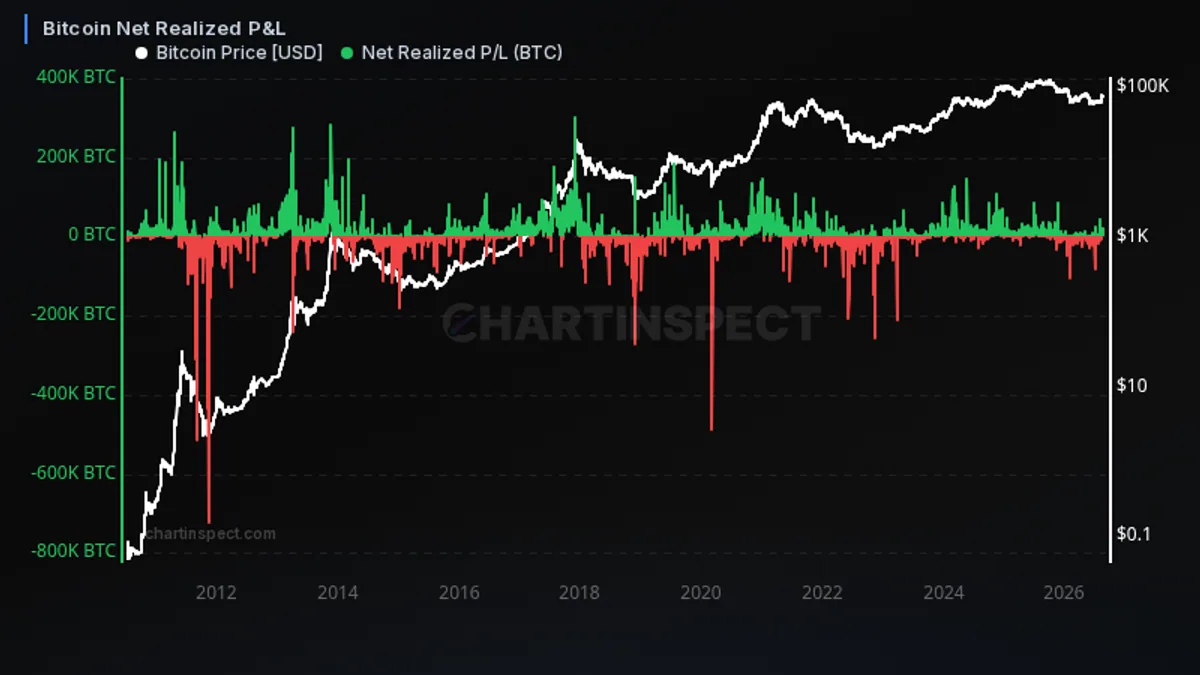
Analyze profit and loss dynamics including supply in profit/loss, realized P&L, age-based distribution, and cohort SOPR to read profit-taking behavior.

Track aggregate realized profit minus loss to gauge capital rotation and spot capitulation and euphoria phases across the market cycle.

Explore the Cointime Economics framework: liveliness, vaultedness, and active value to weight coins by how long they have been held.