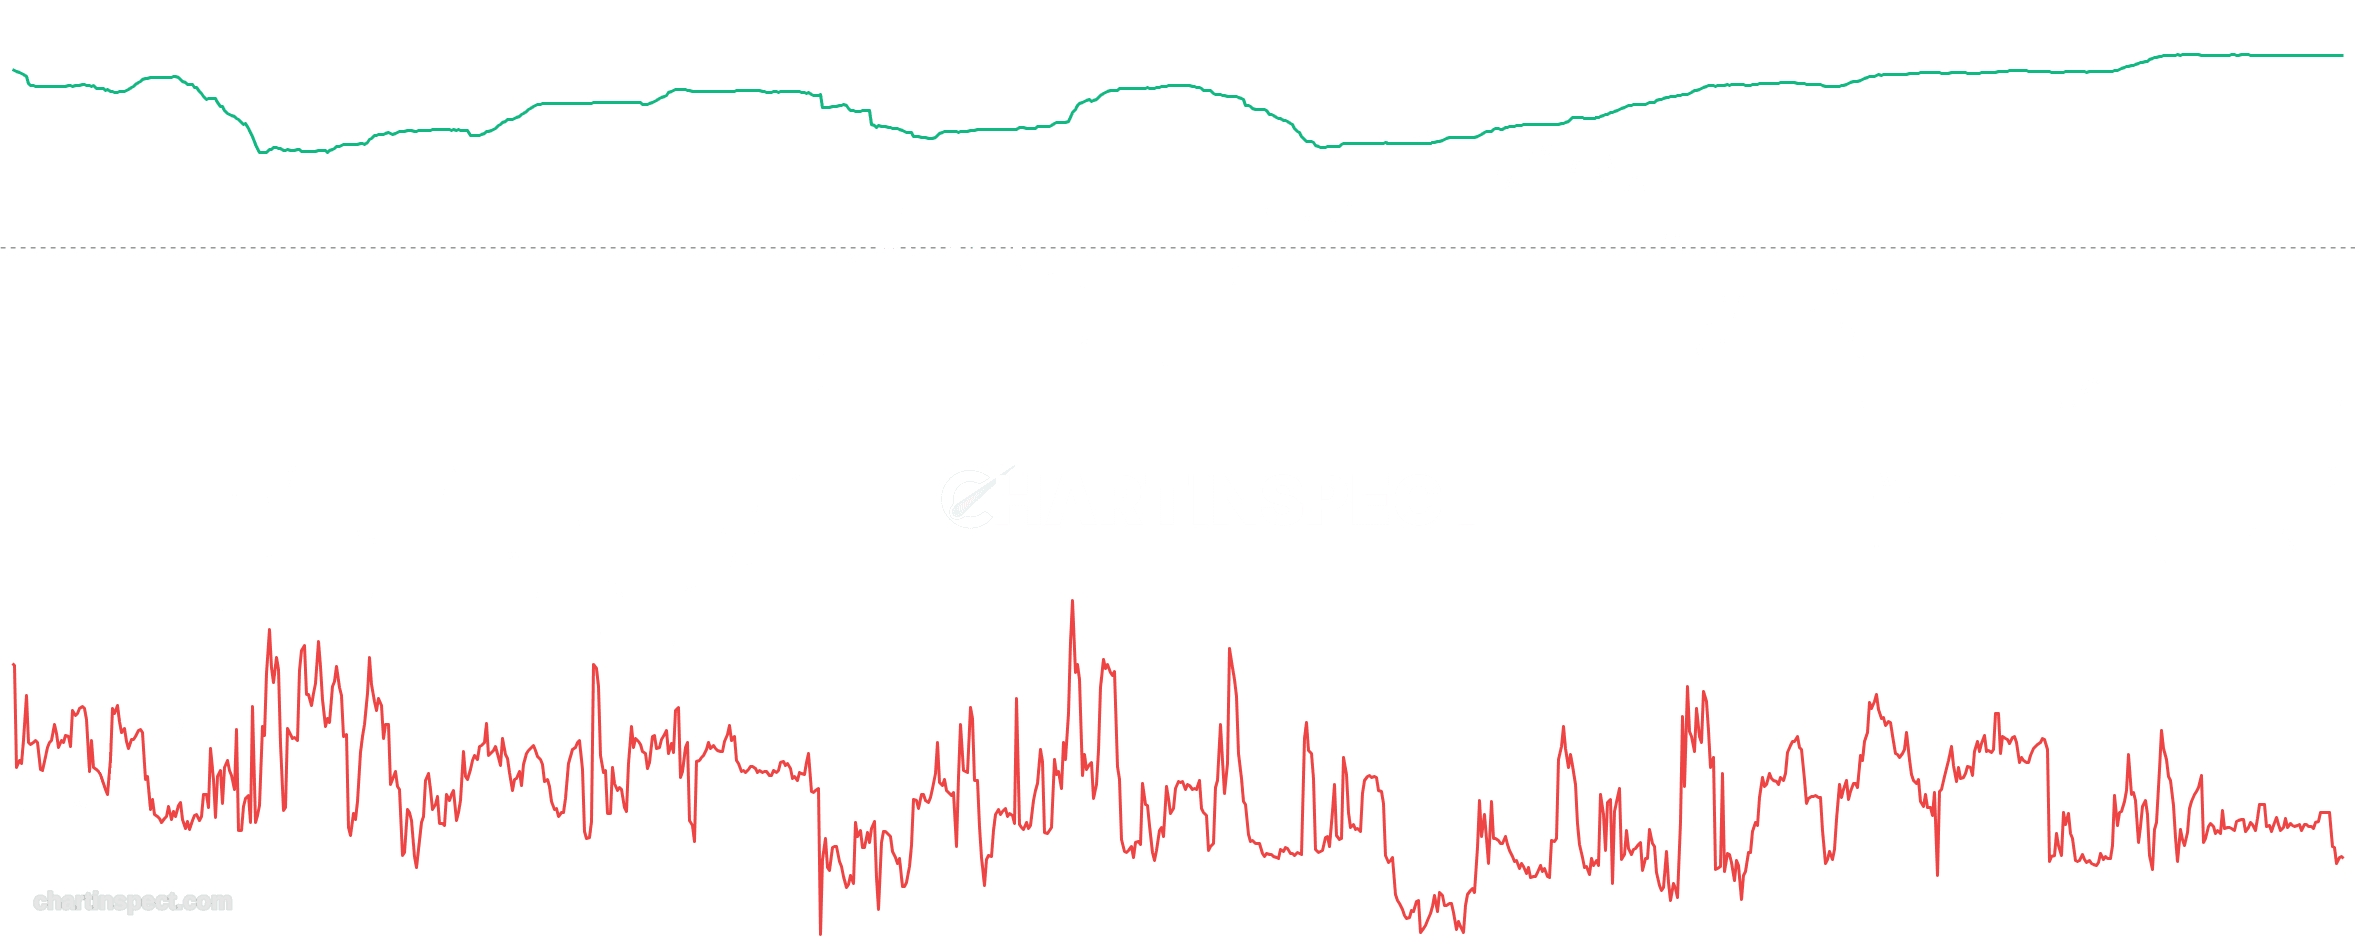
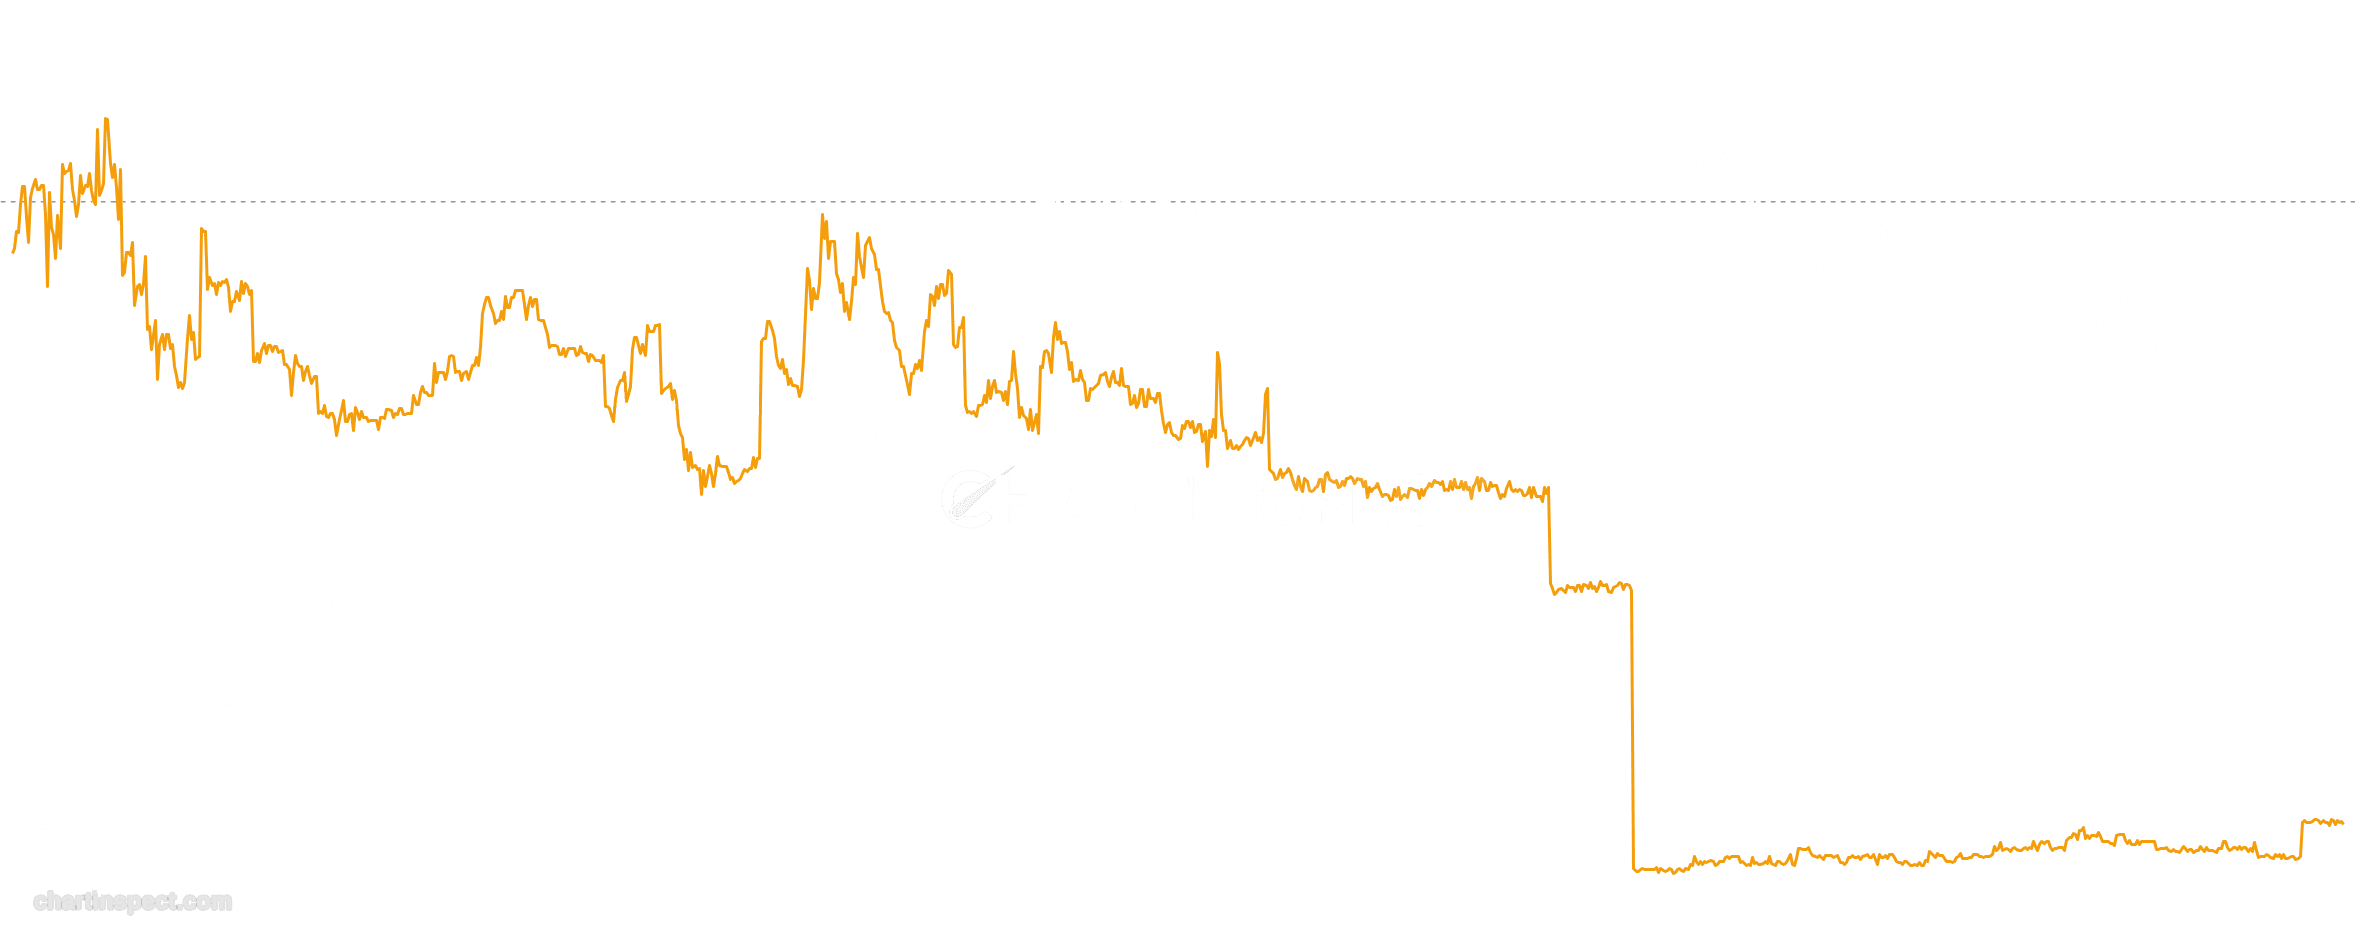
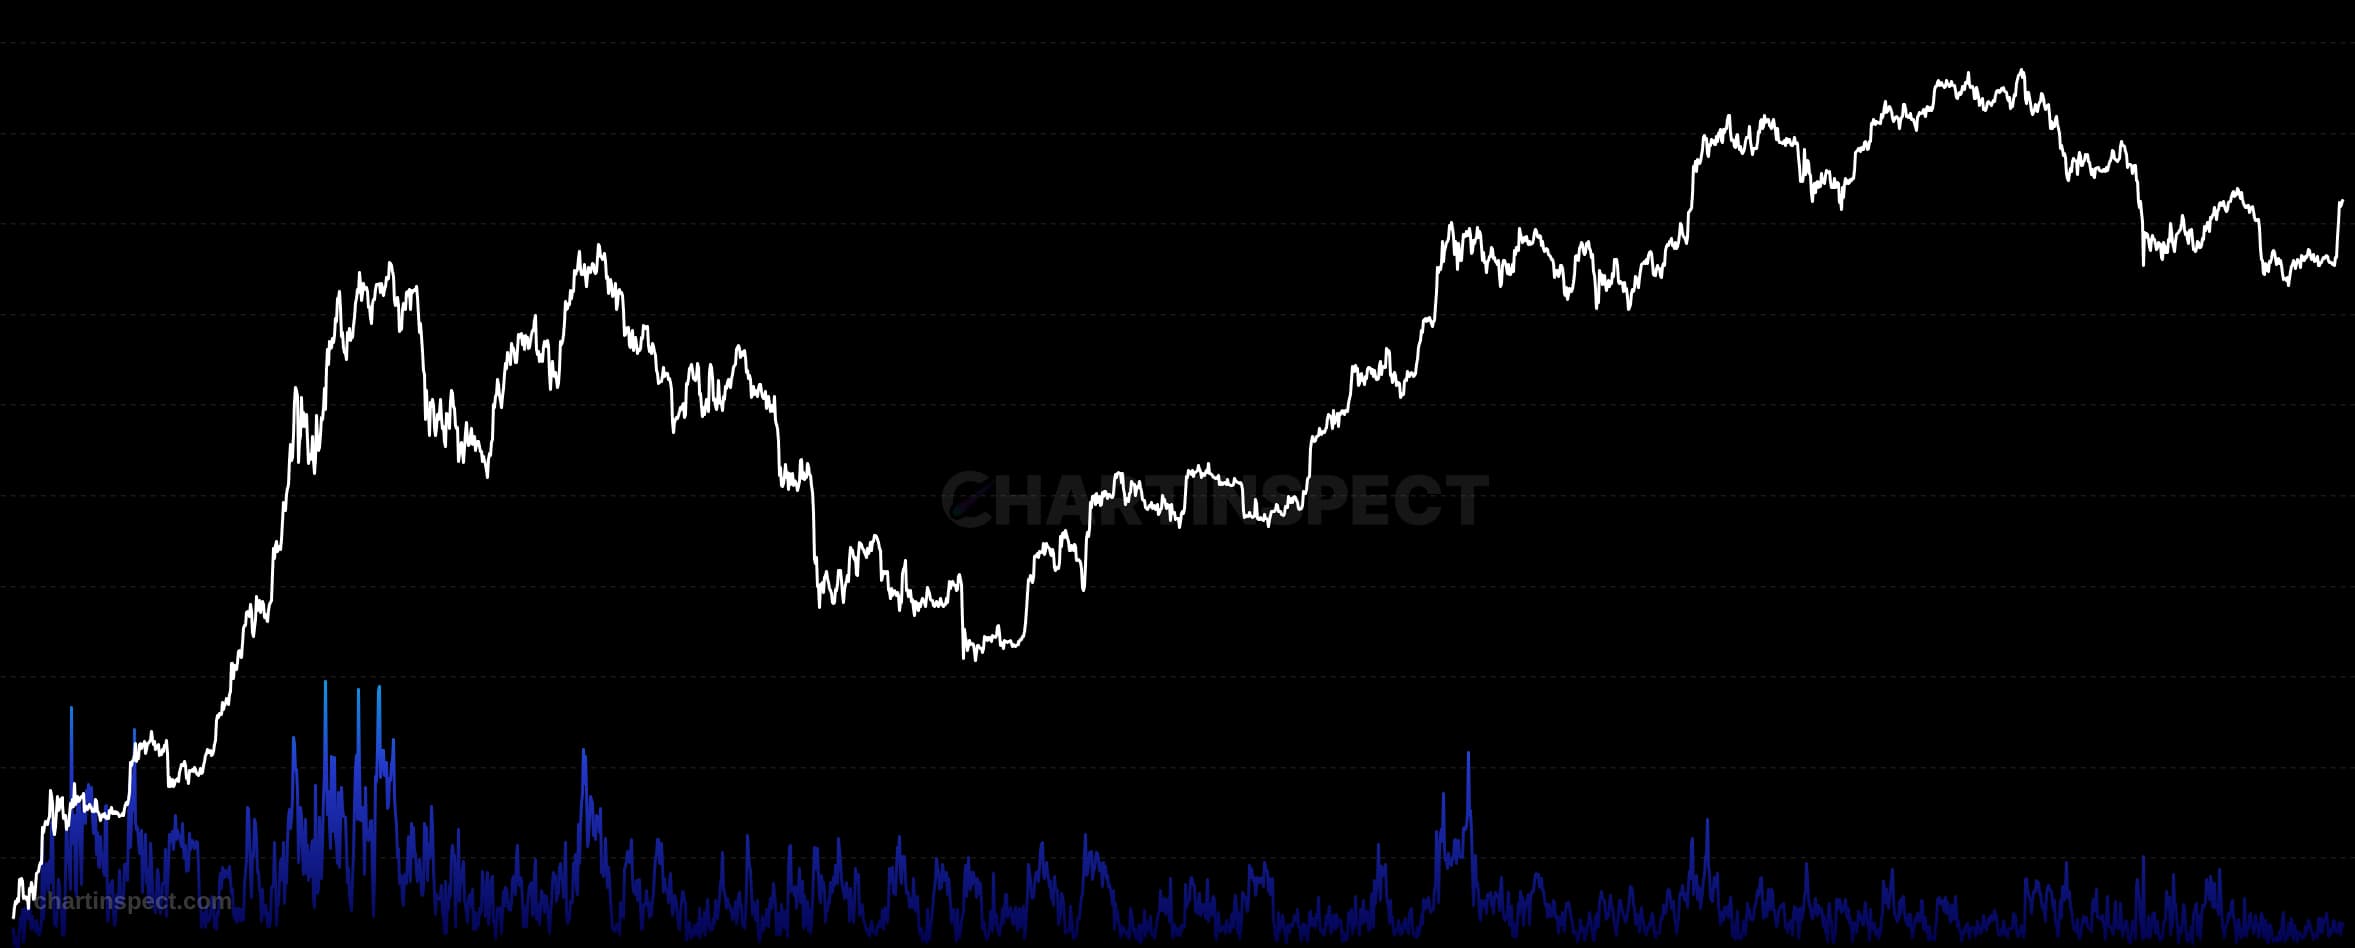
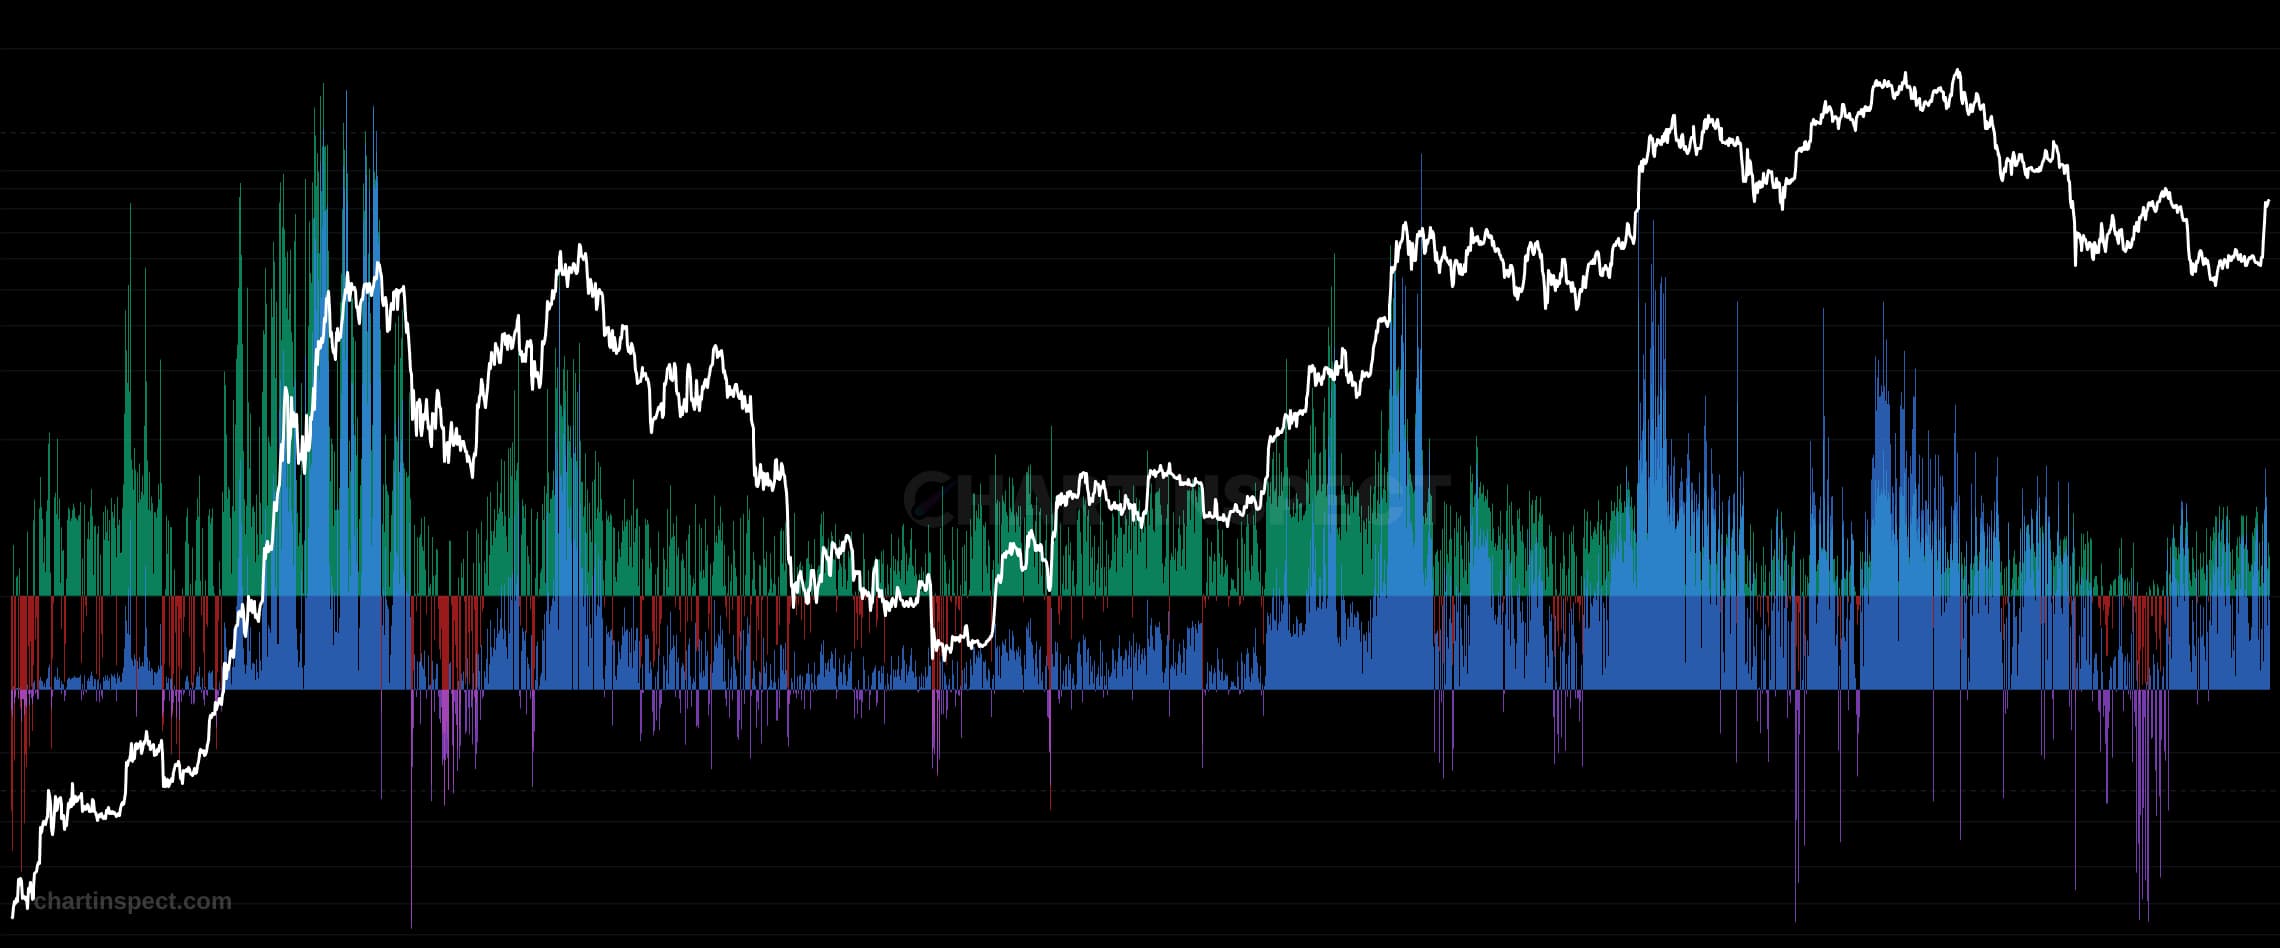
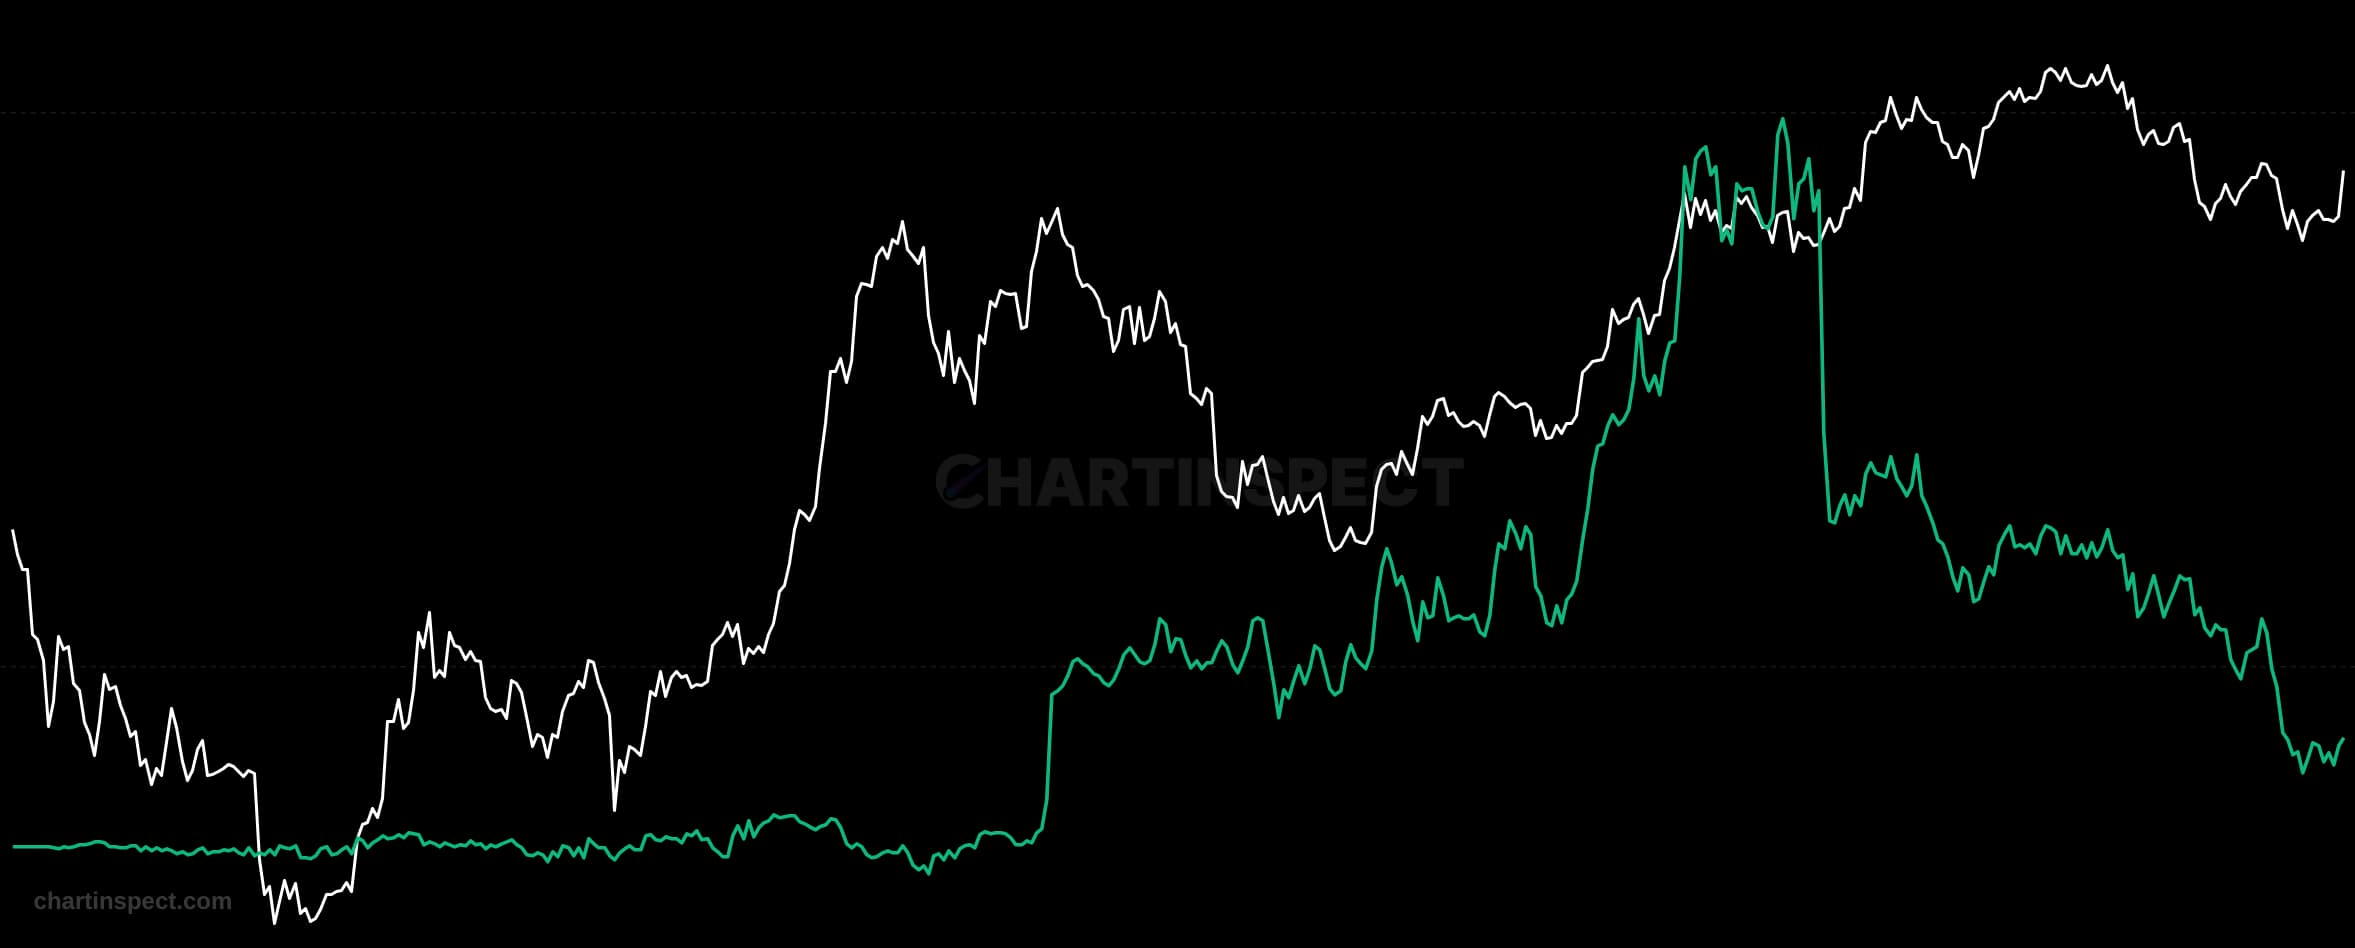
Carry Yield vs Treasury Yield plots the 90-day annualized Bitcoin futures basis against the US 2-Year Treasury yield. The basis is the premium at which dated futures trade above spot, annualized: it is the return a market maker earns by buying spot and selling the future against it, a delta-neutral position known as the cash-and-carry trade. The 2-Year Treasury is the risk-free alternative for that same capital. Plotting them together turns an abstract funding question into a direct comparison: is it worth supplying leverage to crypto, or is it better to hold government paper?
When the basis sits above the Treasury yield, the carry trade pays a premium over risk-free and capital flows in to collect it. That capital is what provides the depth, tight spreads, and leverage the market runs on, so a wide positive spread is a sign of healthy market structure rather than mere bullishness. When Treasuries out-yield the basis, the shaded periods on this chart, the economic reason to run the trade disappears. Desks unwind, liquidity thins, and the market becomes more fragile to the same size of flow. The spread has been positive for most of recorded history; sustained negative stretches are rare, and the one spanning mid-2022 into 2023 ended near the cycle low.
Read the shaded bands as regime markers, not timing signals. Each marks a contiguous run of days where carry stayed below the risk-free rate, with brief crossings merged so one blip does not split a single regime into fragments. Use the spread in basis points from the tooltip to judge how deeply negative the market has gone, and treat the band's day count as a measure of how long the liquidity incentive has been absent. Basis history is sourced from Deribit's dated futures, the venue institutional basis trades reference, and the yield from the Federal Reserve's DGS2 series, forward-filled across weekends and US holidays because crypto trades every day.
Check the selected asset or market, units, and date range. Compare equivalent series over the same period and distinguish a market-wide measure from one asset or venue.