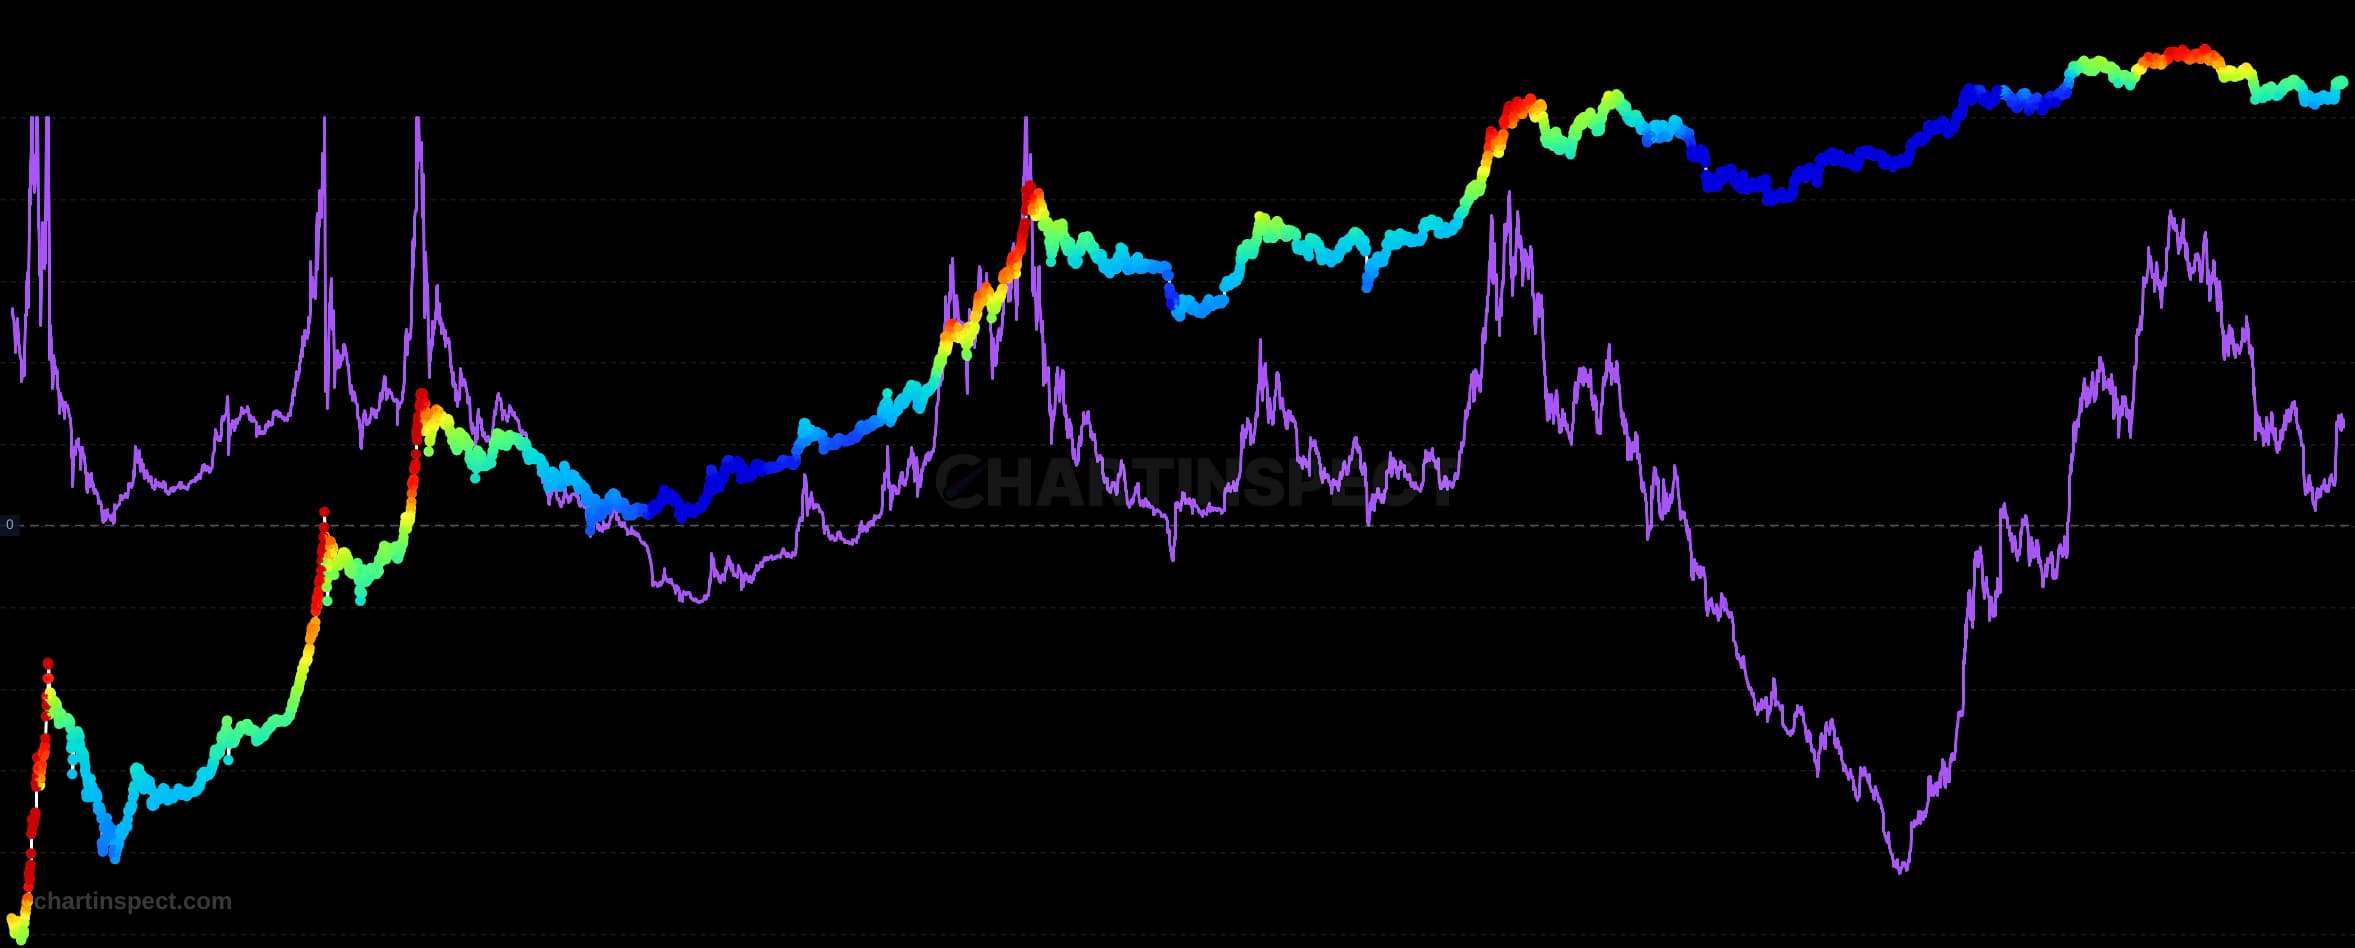
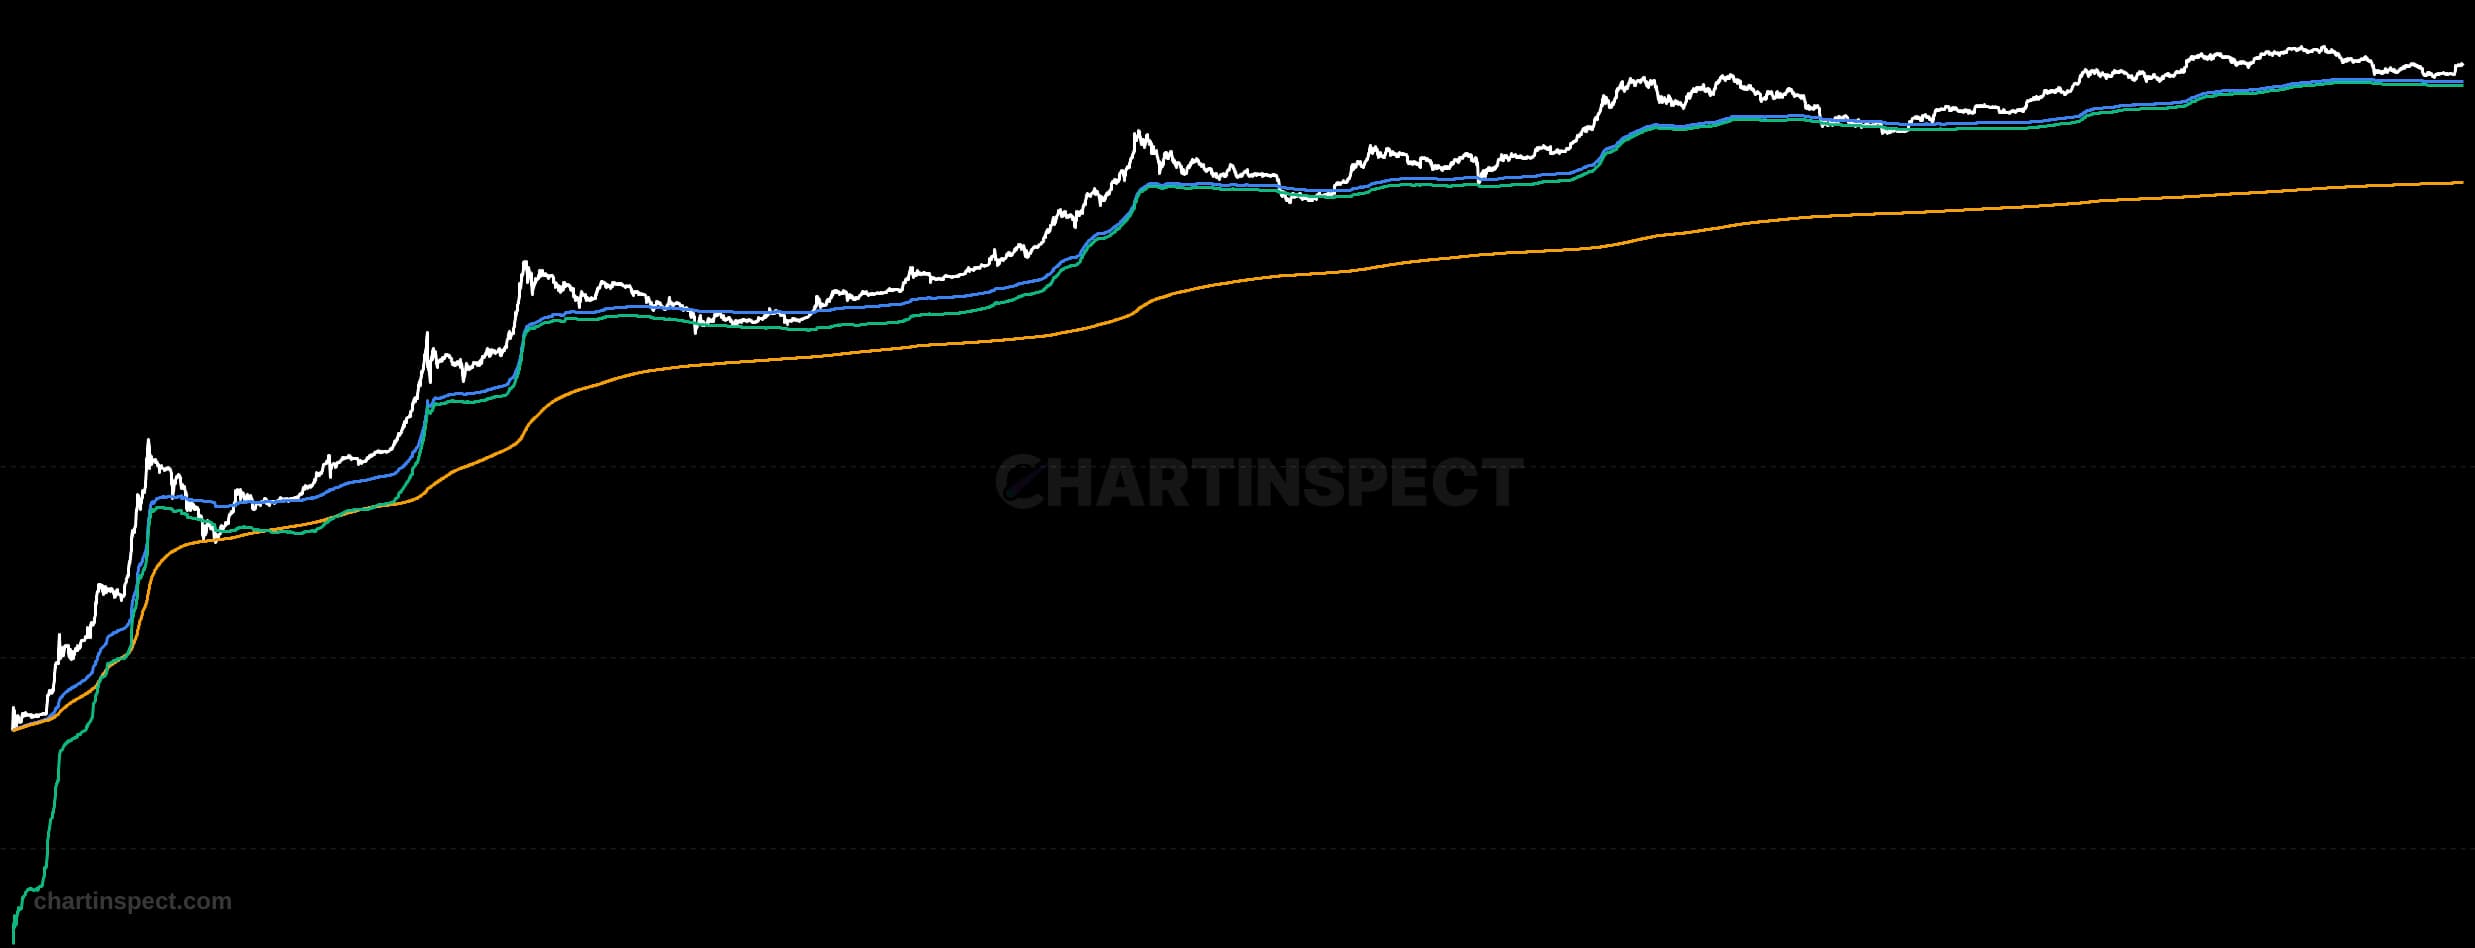
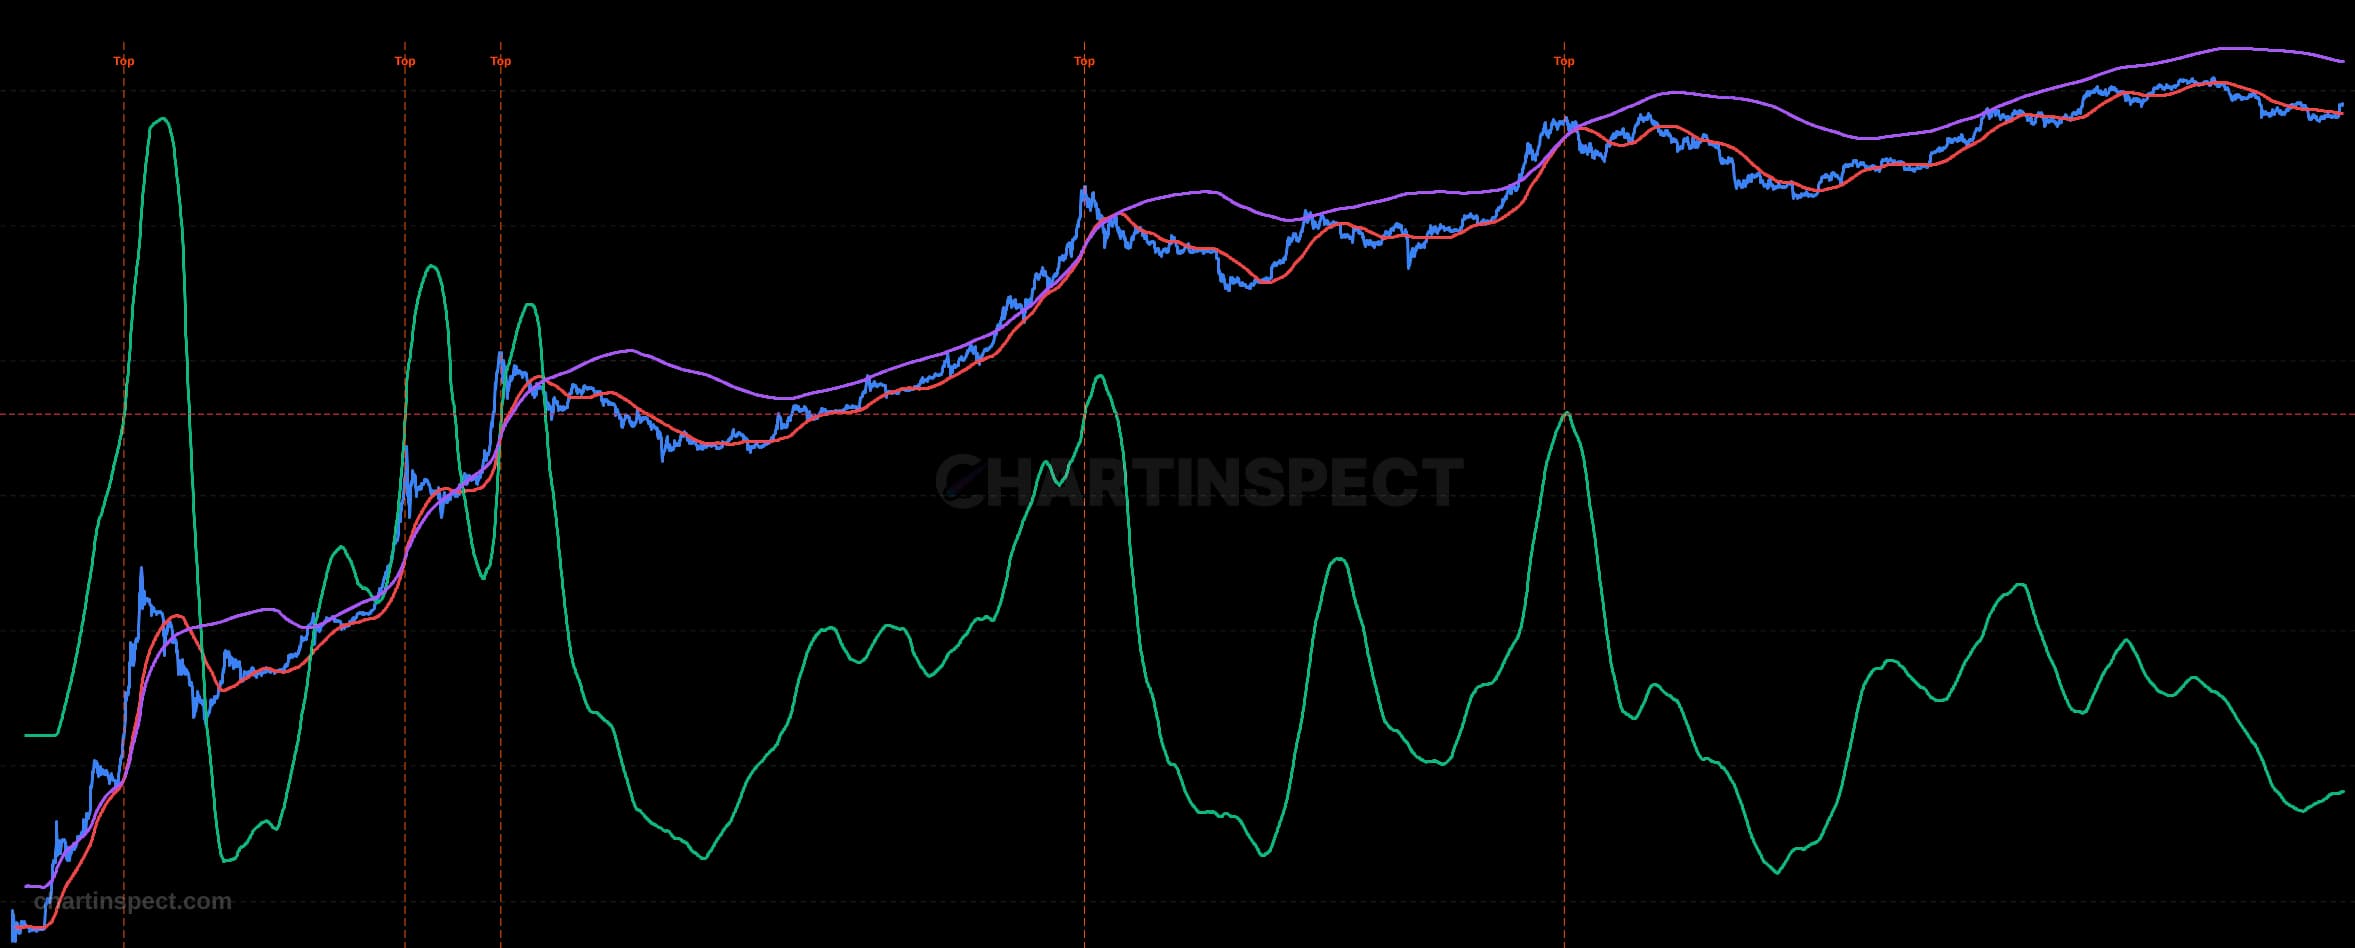
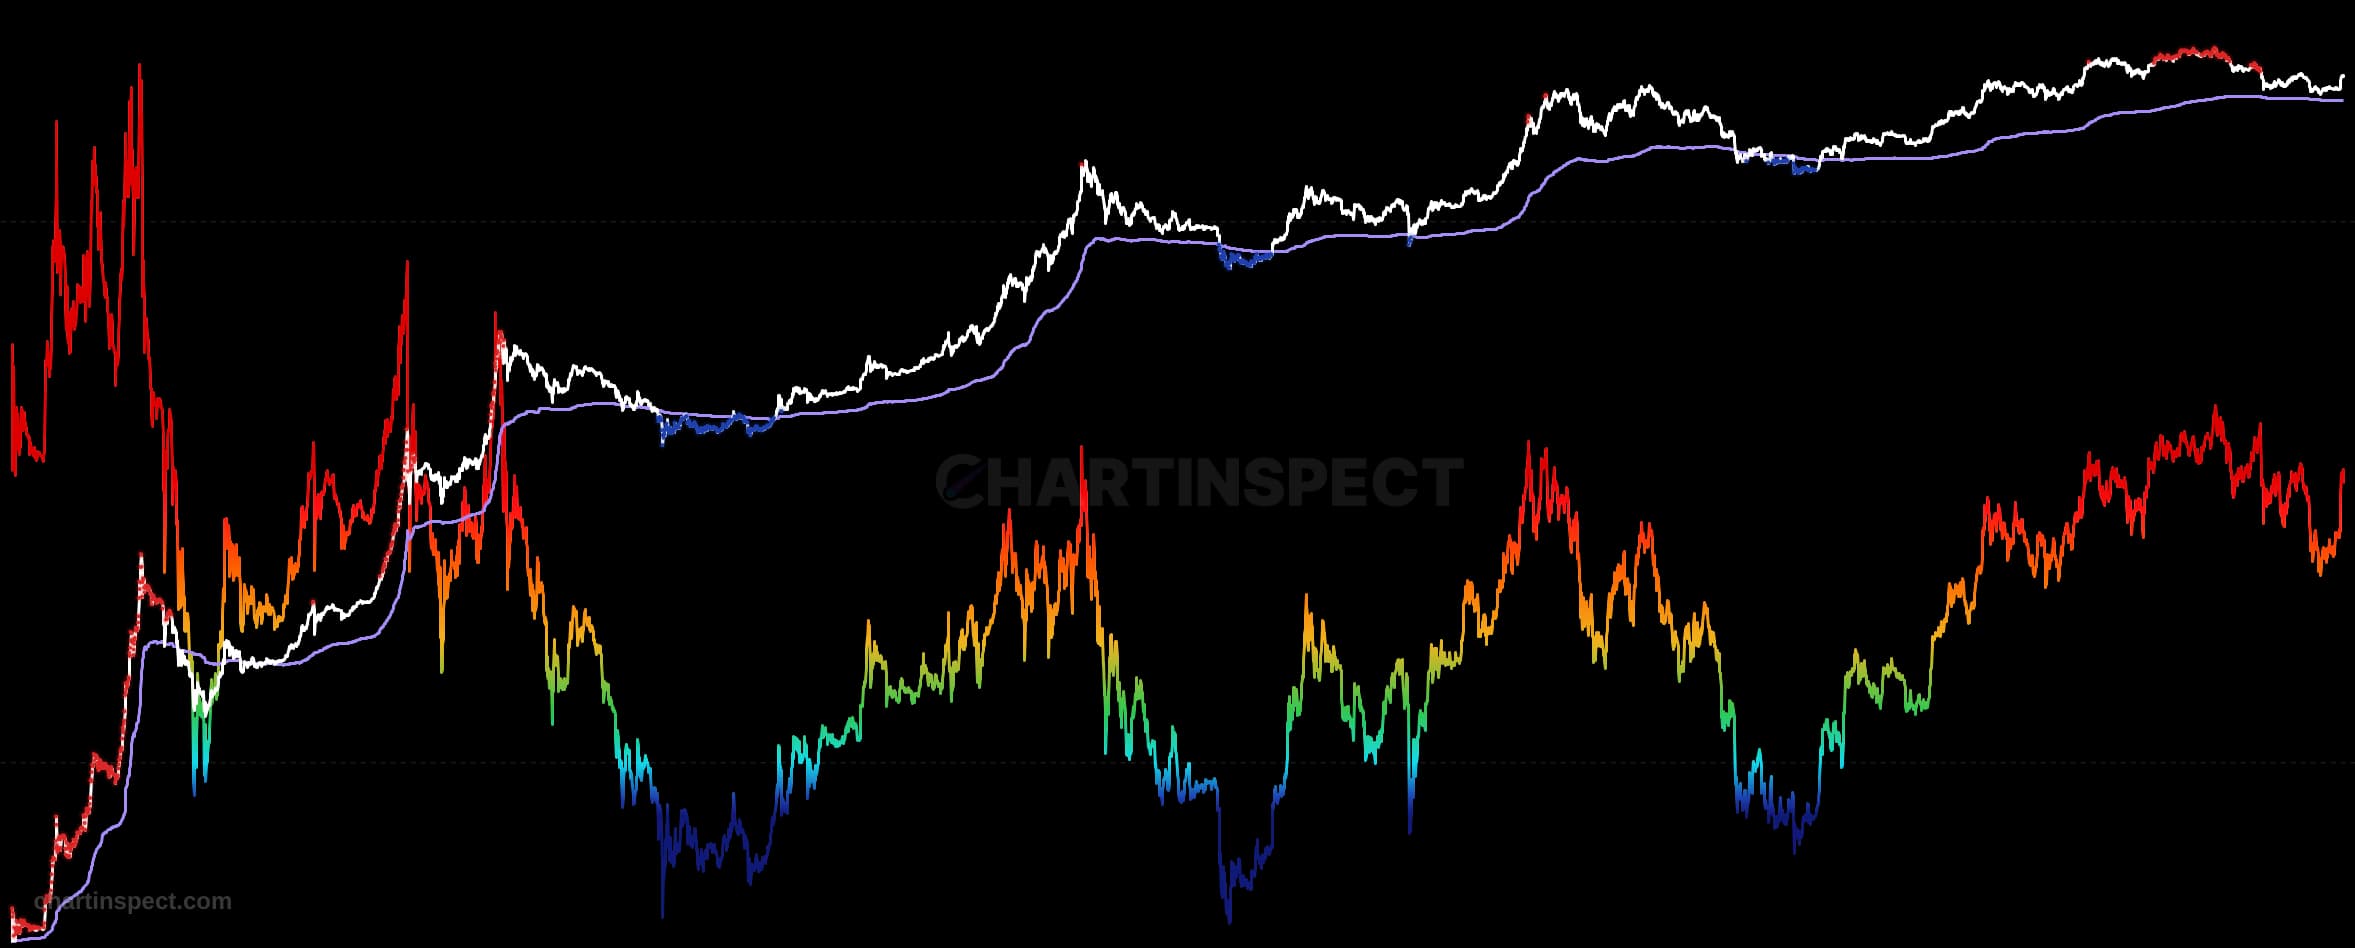
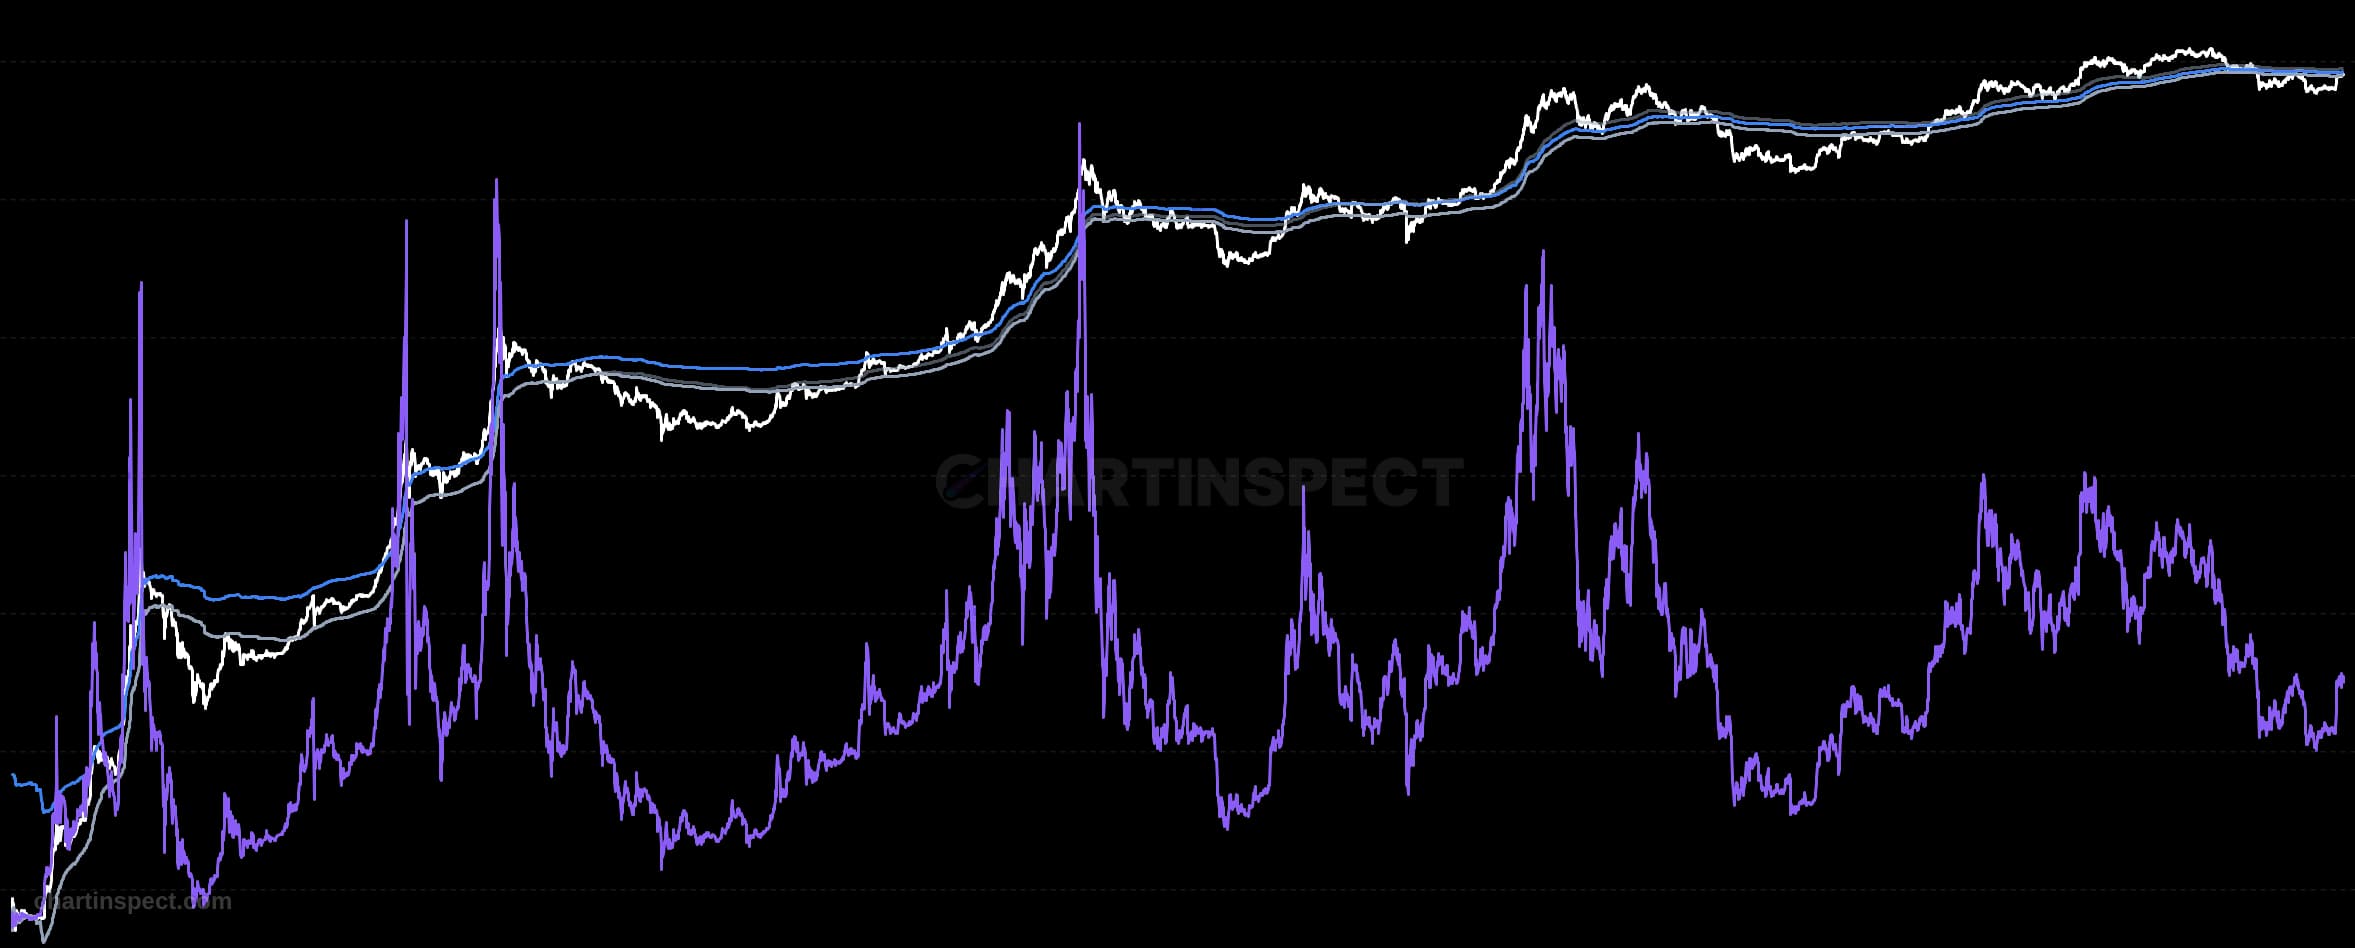
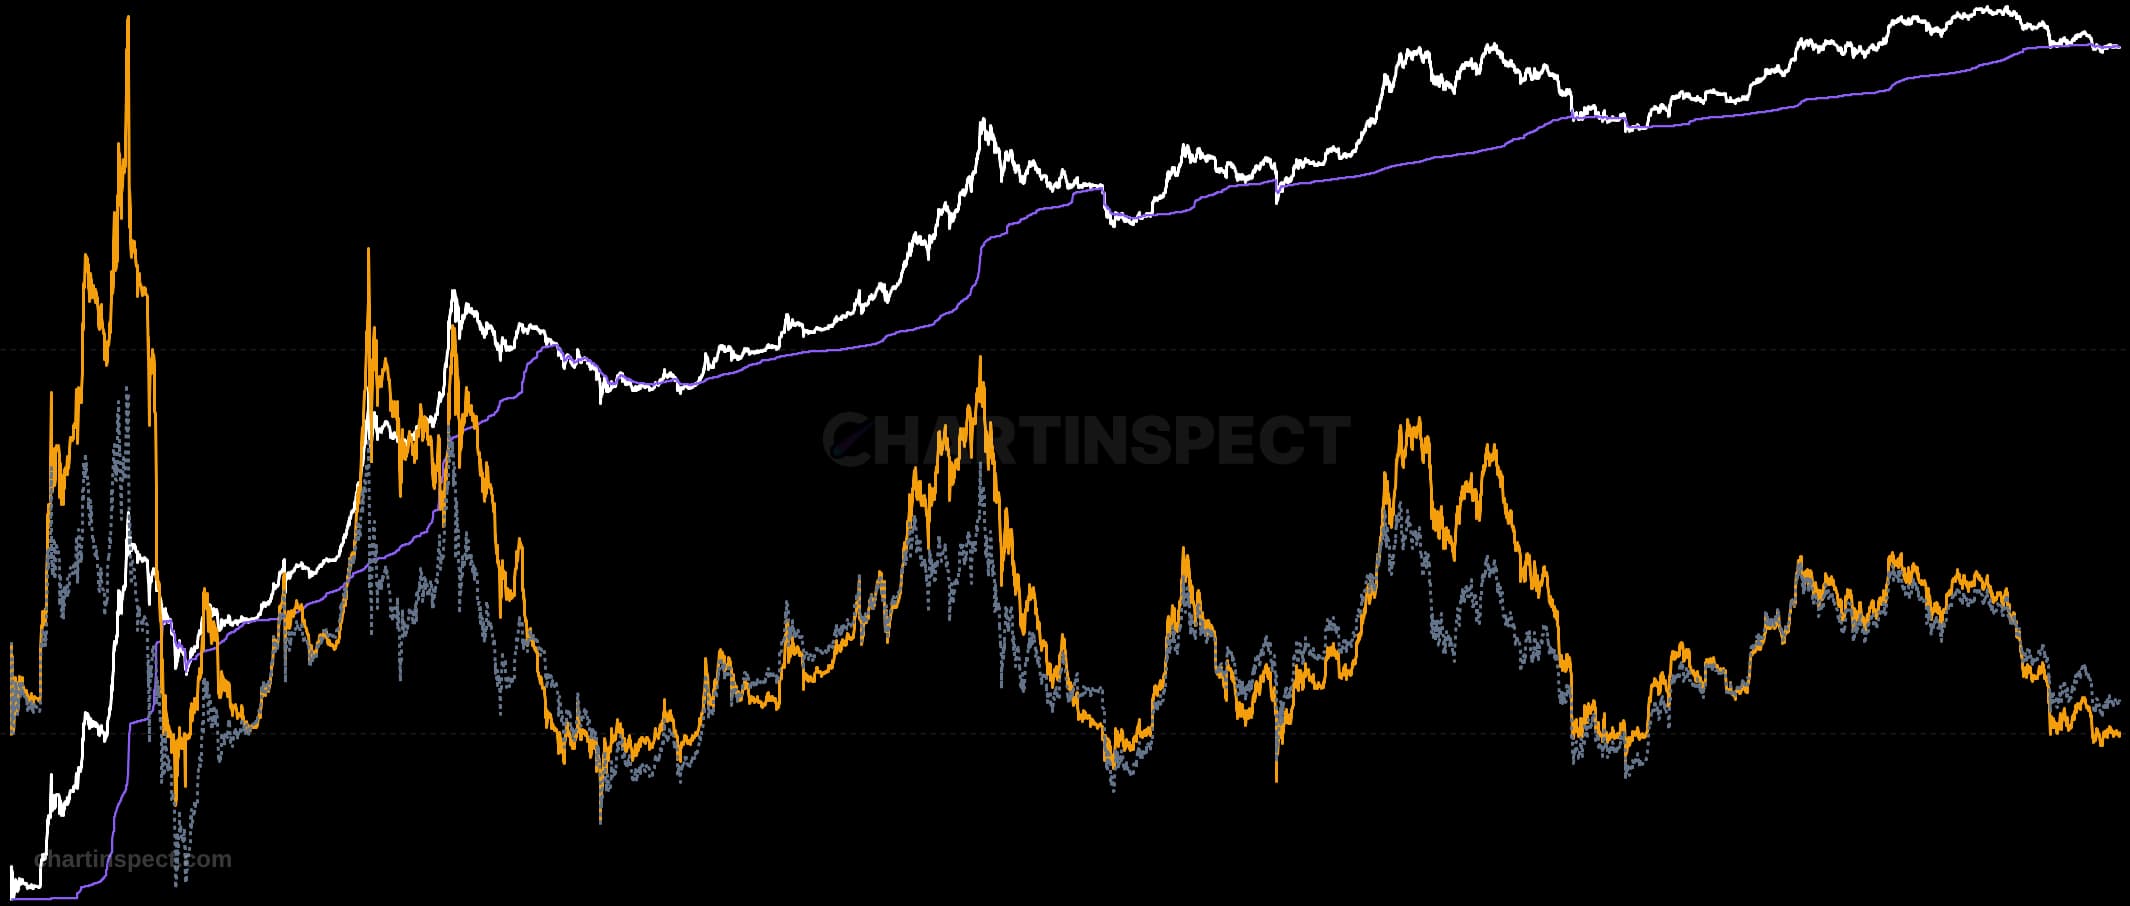
Bitcoin Active MVRV Norm starts with Active MVRV, a valuation ratio that adjusts standard MVRV for network activity using Cointime Economics principles, so that dormant supply is discounted and economically active coins drive the signal. That activity-adjusted ratio is then normalized over a multi-cycle rolling window, rescaling it into a consistent 0 to 100% cycle indicator that stays comparable across Bitcoin's very different price regimes rather than drifting higher with each cycle.
Read the chart as a bounded oscillator between 0 and 100%. Because the normalization is anchored to a multi-cycle rolling window, the same percentage level carries a similar meaning in 2017, 2021, and today: it tells you where active supply sits relative to its own recent history, not against an absolute dollar valuation. Rising readings mean active supply is stretching further above its cost basis, while falling readings mean it is reverting toward or below what active holders paid.
Use the extremes as cycle context. High readings above 70% indicate active supply is extremely overvalued relative to recent history and have historically aligned with Bitcoin cycle tops. Low readings below 8% indicate active supply is near or below its cost basis and have historically aligned with cycle bottoms. Treat the middle of the range as neutral, and lean on the top and bottom bands as the zones where risk and opportunity have historically concentrated.
Check the selected asset, units, and cohort before comparing readings. Compare the metric over consistent dates and use related measures to understand what contributes to a change.