Loading chart data
Loading chart data
About 200-Week MA Heatmap
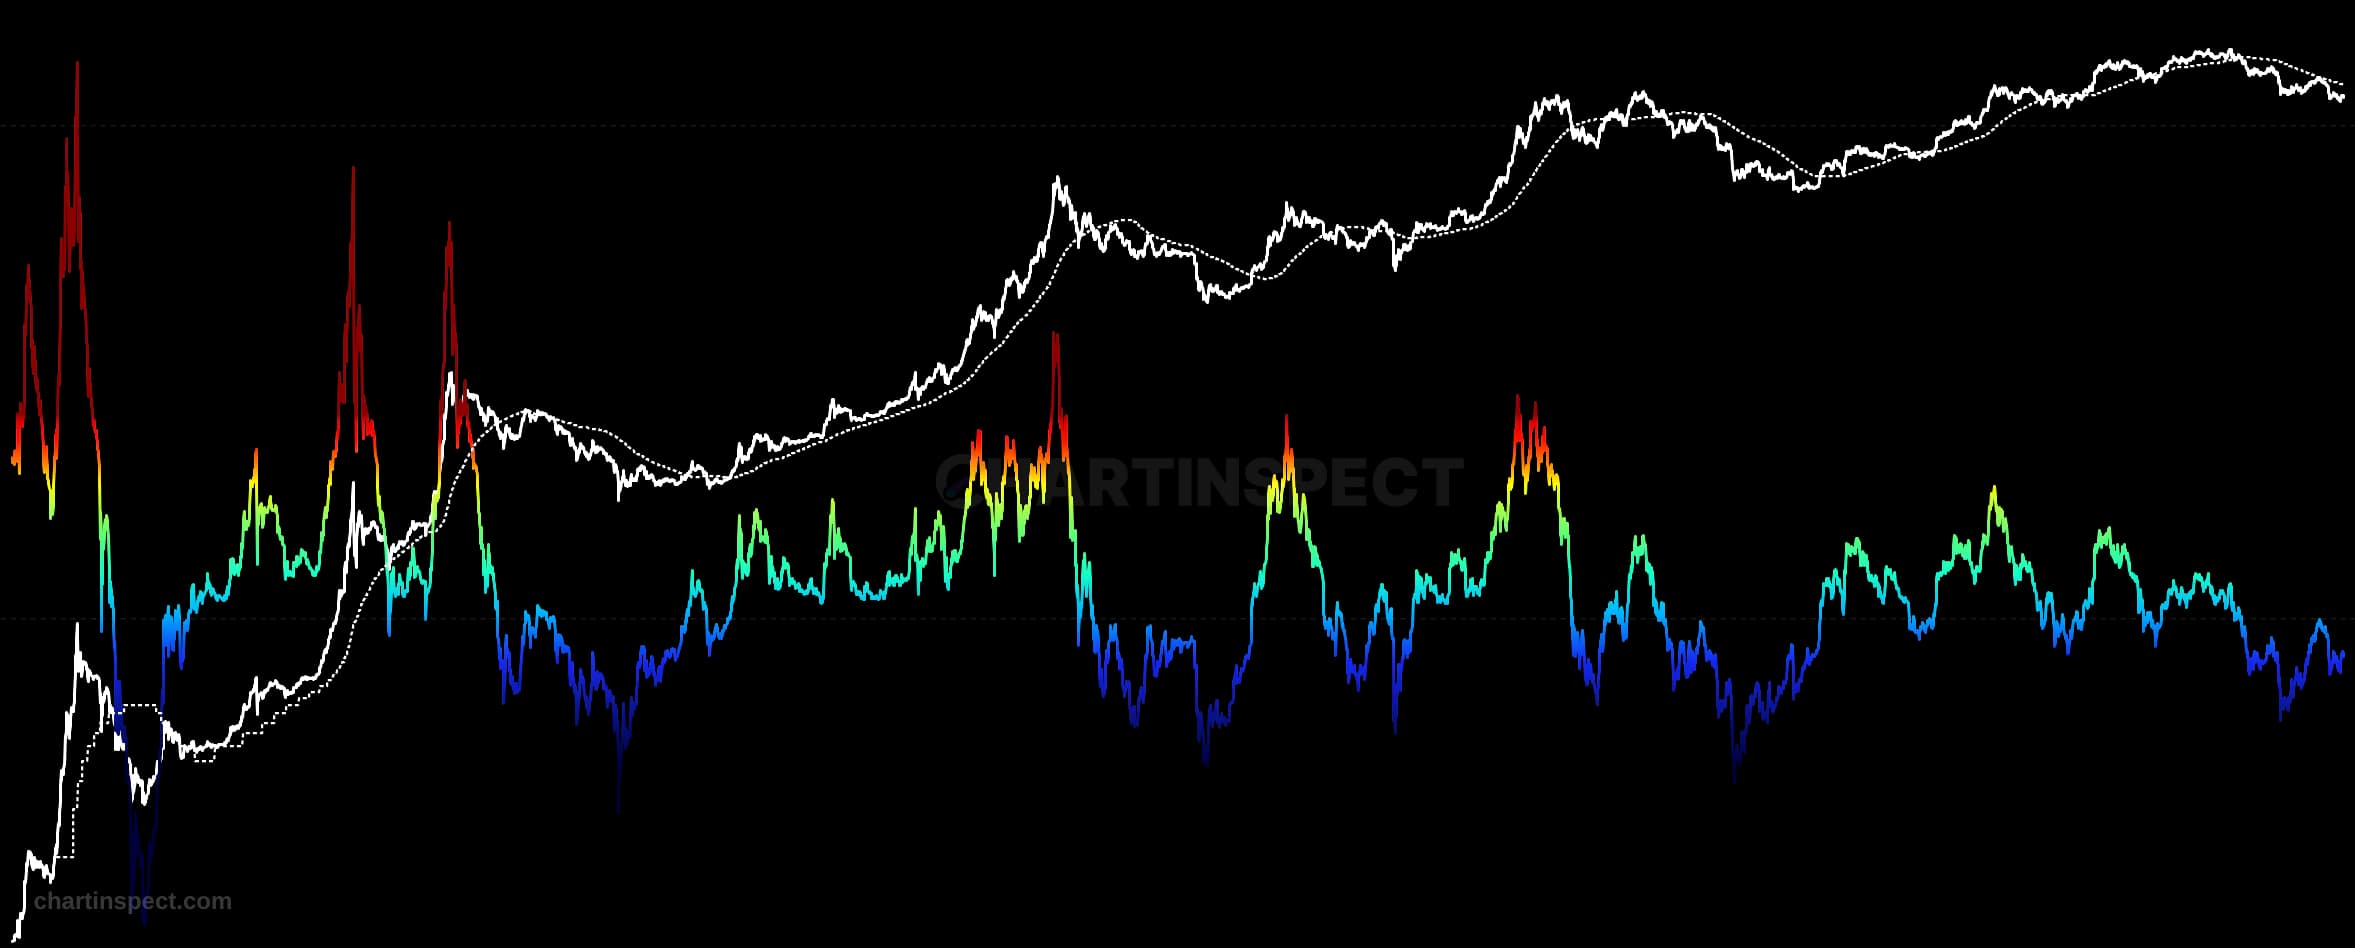
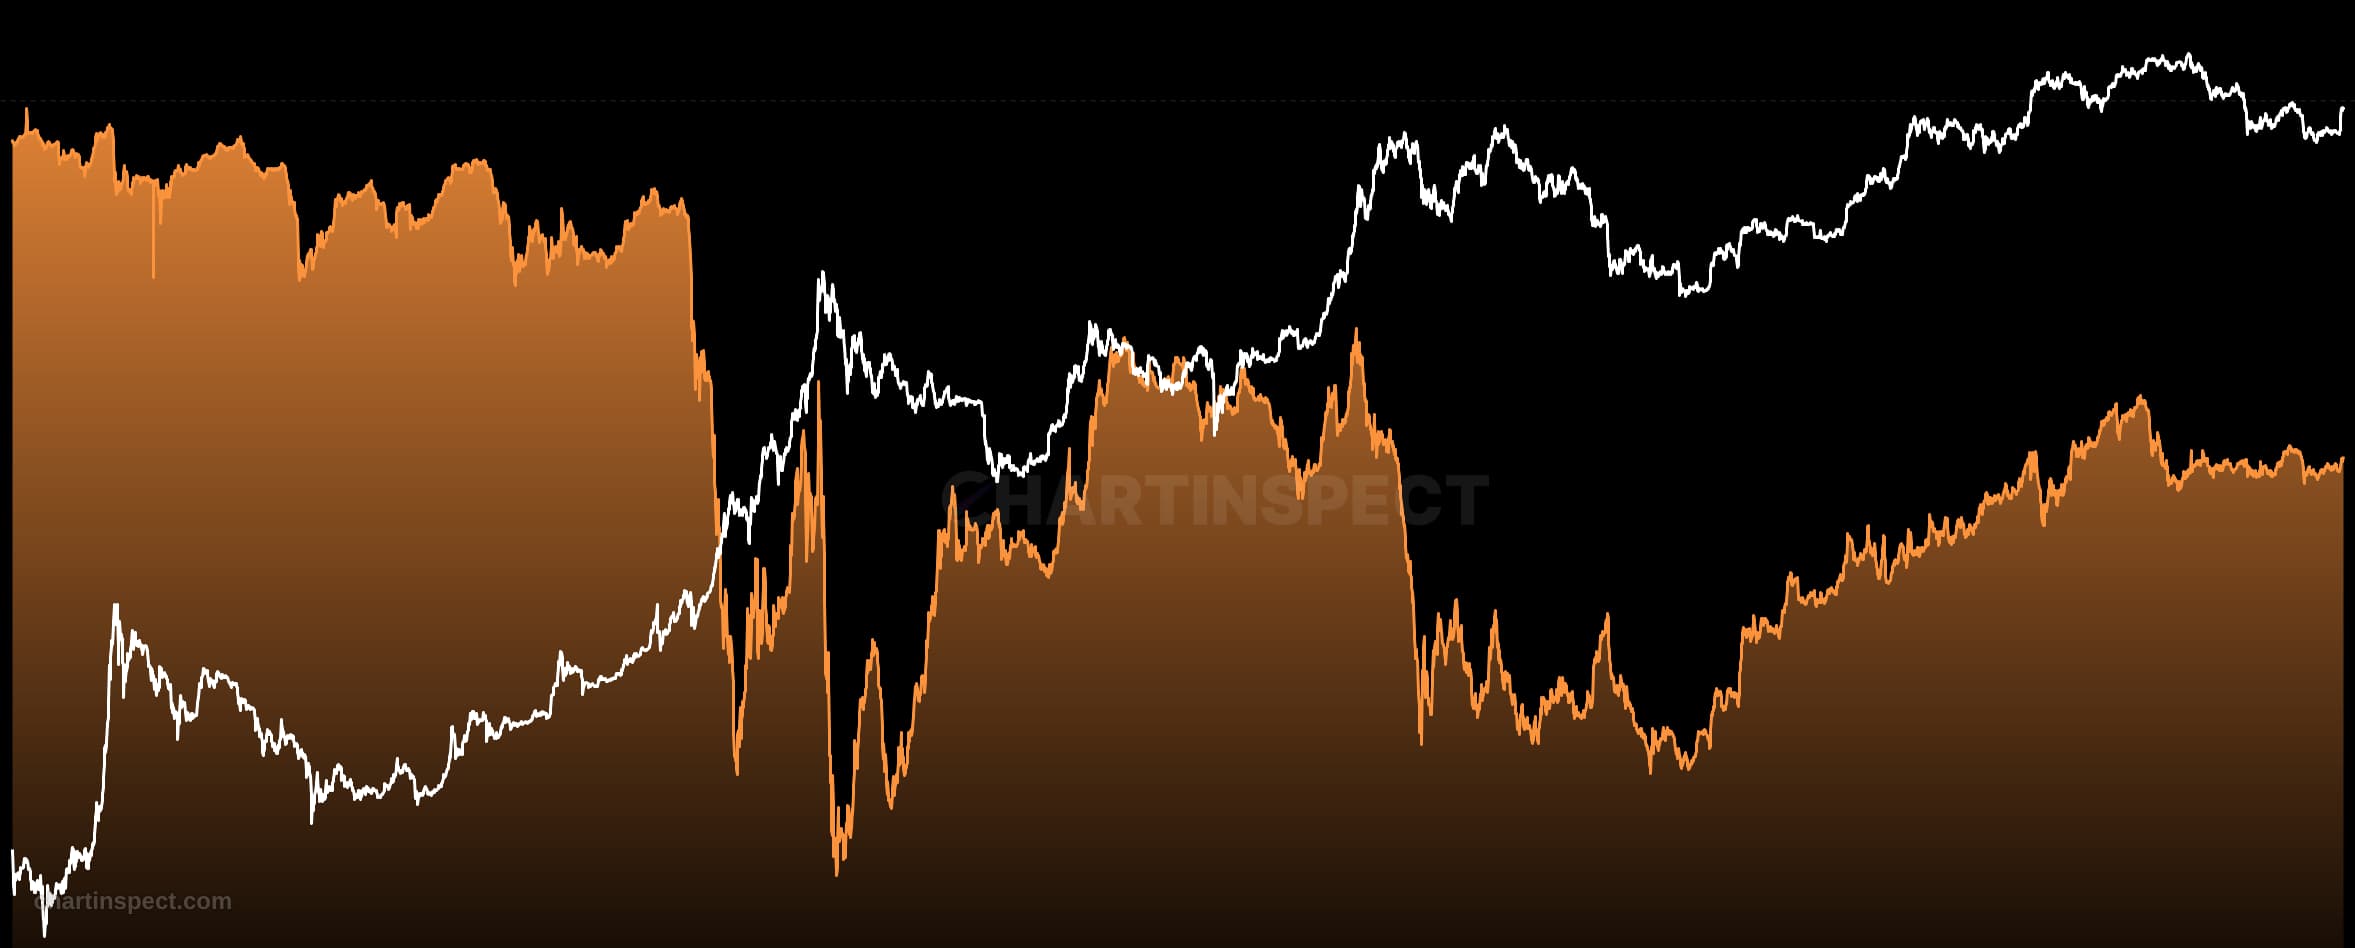
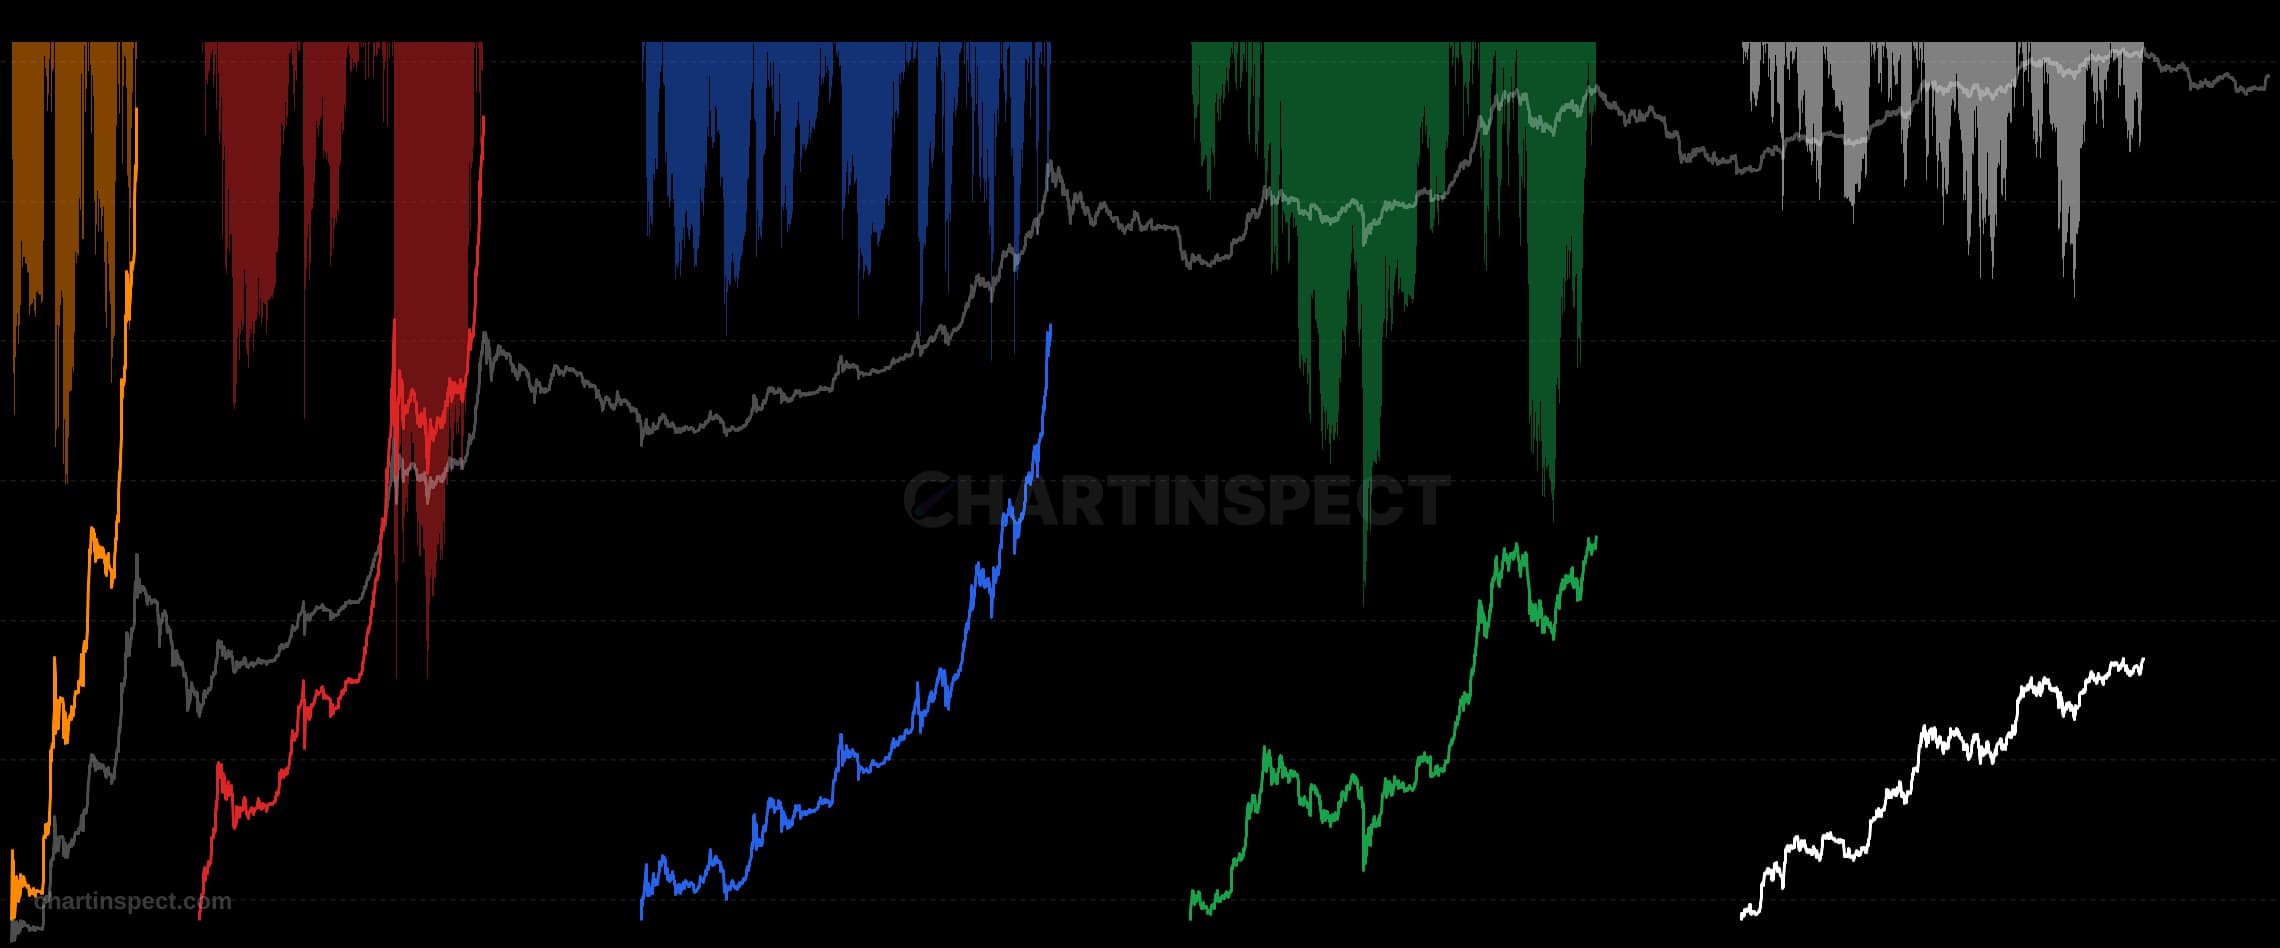
One of Bitcoin's most-shared long-term charts. Price is colored by how fast its 200-week moving average is rising: cool blues near cycle bottoms, hot reds at cycle tops. The 200-week MA has acted as a durable price floor across every cycle.
Freshness: Not yet verified
Community snapshot
No community calls on 200-Week MA Heatmap yet. Be the first to share a take.
Related Analytics
Discover more insights with our comprehensive chart collection
Explore All 9143 Charts